Ripple’s recent price action reflects a state of indecision following a rejection at the .6 resistance level. The market is currently undergoing a low-volatility consolidation phase, signaling a potential continuation of the corrective stage in the short term. By Shayan The Daily Chart XRP’s impulsive uptrend broke several critical resistance levels, culminating in a significant rally toward the .6 resistance zone. This level marked a peak in bullish momentum, leading to a rejection and subsequent consolidation. The price has since retraced toward the previously broken .3 threshold, a key support level, reflecting the buyers’ efforts to sustain the bullish trend. However, the market is currently in a phase of indecision, characterized by low-volatility fluctuations.
Topics:
CryptoVizArt considers the following as important: Ripple (XRP) Price, XRP Analysis, xrpbtc, xrpusd
This could be interesting, too:
Dimitar Dzhondzhorov writes Is a Major Ripple v. SEC Lawsuit Development Expected This Week? Here’s Why
Mandy Williams writes Ripple Releases Institutional DeFi Roadmap for XRP Ledger in 2025
Dimitar Dzhondzhorov writes Ripple Whales Go on a Selling Spree: Is XRP Headed for a Further Correction?
Jordan Lyanchev writes ChatGPT and DeepSeek Analyze Ripple’s (XRP) Price Potential for 2025
Ripple’s recent price action reflects a state of indecision following a rejection at the $1.6 resistance level. The market is currently undergoing a low-volatility consolidation phase, signaling a potential continuation of the corrective stage in the short term.
By Shayan
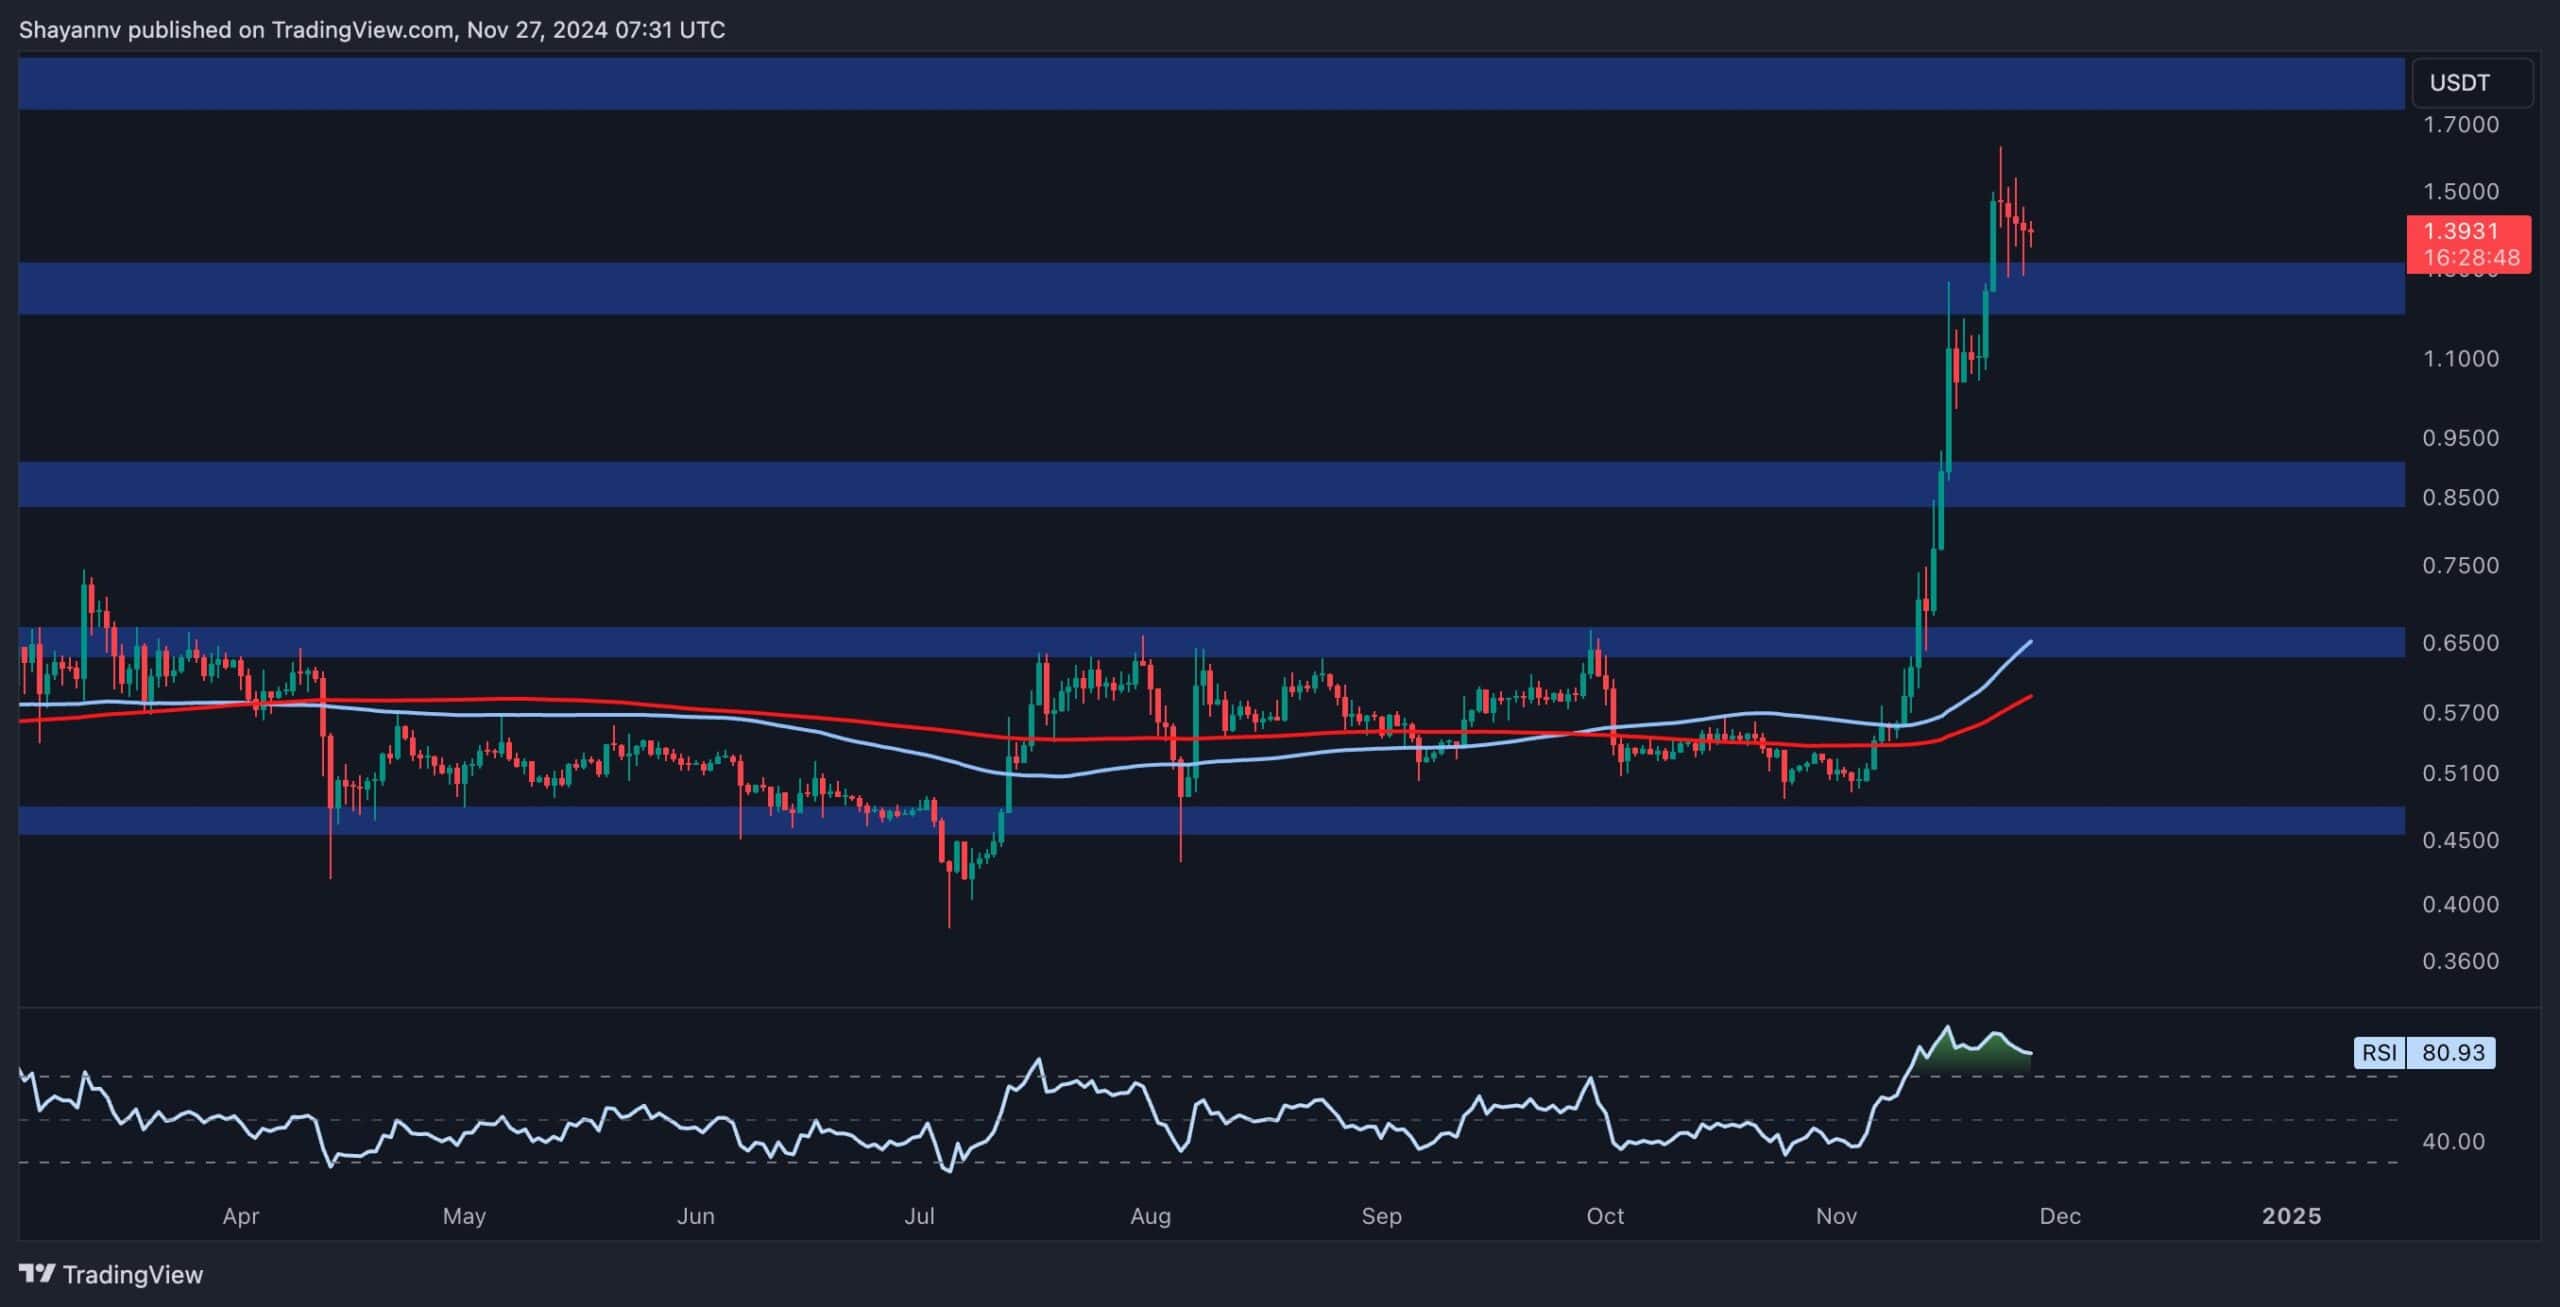
The Daily Chart
XRP’s impulsive uptrend broke several critical resistance levels, culminating in a significant rally toward the $1.6 resistance zone.
This level marked a peak in bullish momentum, leading to a rejection and subsequent consolidation. The price has since retraced toward the previously broken $1.3 threshold, a key support level, reflecting the buyers’ efforts to sustain the bullish trend.
However, the market is currently in a phase of indecision, characterized by low-volatility fluctuations. The RSI indicator also highlights an overbought condition, further supporting the likelihood of a continuation in the consolidation stage. This phase is expected to persist in the short term, with an eventual breakout needed to define the next direction.
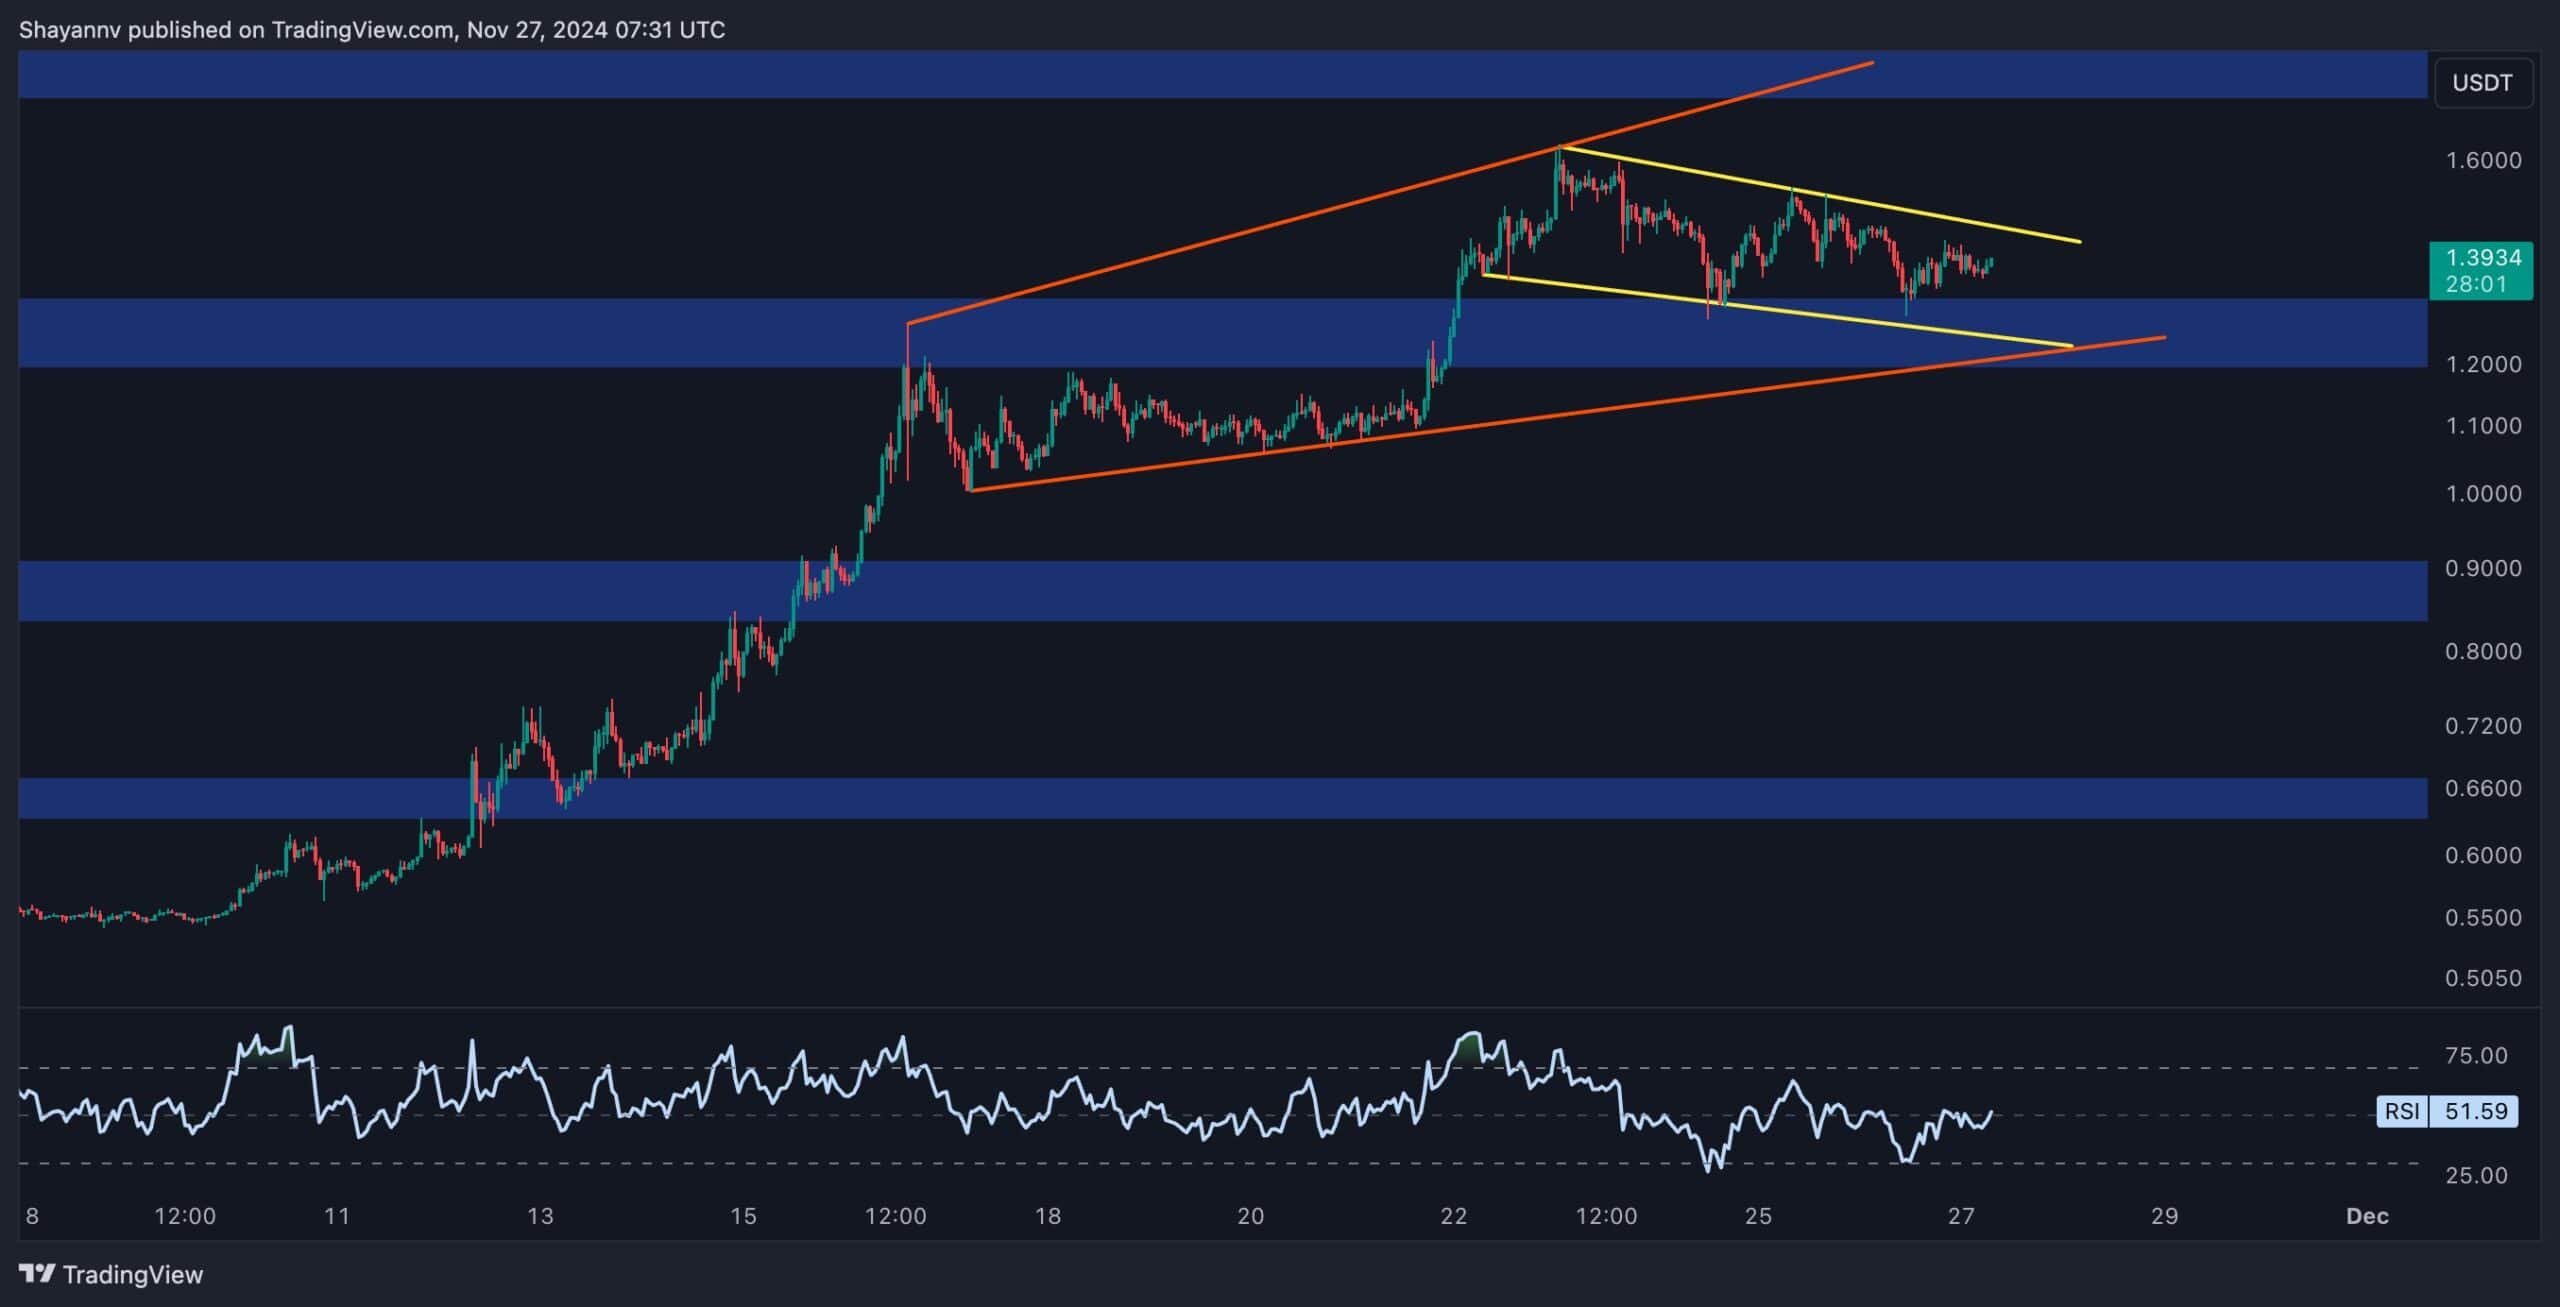
The 4-Hour Chart
On the 4-hour timeframe, XRP’s price action still maintains a bullish structure, marked by a sequence of higher highs and higher lows. The formation of an expanding wedge pattern reflects the buyers’ dominance up to the $1.6 resistance region, where the price experienced a rejection.
This has led to the emergence of a bullish flag pattern, suggesting the potential for a continuation of the prior uptrend if the price breaks above its upper boundary.
With the cryptocurrency now approaching the critical support level at $1.3, the consolidation stage could end in the mid-term. A breakout above the flag could result in XRP retesting the $1.6 threshold, with further gains likely if the resistance is overcome.