According to a popular monitoring resource, the number of new addresses on Ethereum’s blockchain shares a very similar pattern with the ETH price most of the time. Lately, however, the price is taking the lead.Correlation: ETH Price And New Ethereum AddressesThe popular cryptocurrency monitoring resource TokenAnalyst has presented interesting findings regarding the number of new addresses on Ethereum’s blockchain and their correlation to ETH’s price.We were playing around with our API and plotted new ETH addresses by day (incl. smart contracts) vs price.This very interesting graph emerged ?? https://t.co/5WNKkqgcYw pic.twitter.com/0IZXG7VP6l— TokenAnalyst (@thetokenanalyst) December 10, 2019First things first, as described by TokenAnalyst, the numbers of new addresses represent the full
Topics:
George Georgiev considers the following as important: AA News, ETH, ethereum price
This could be interesting, too:
Chayanika Deka writes SEC Closes Investigation Into Gemini, Winklevoss Seeks Reimbursement
Wayne Jones writes CZ Criticizes Safe Wallet’s Post-Mortem on Bybit Hack
Mandy Williams writes Bitcoin ETFs Record Over .6B in Outflows in the Past 2 Weeks
Wayne Jones writes This Trending AI Token Hits New ATH After Binance Listing
According to a popular monitoring resource, the number of new addresses on Ethereum’s blockchain shares a very similar pattern with the ETH price most of the time. Lately, however, the price is taking the lead.
Correlation: ETH Price And New Ethereum Addresses
The popular cryptocurrency monitoring resource TokenAnalyst has presented interesting findings regarding the number of new addresses on Ethereum’s blockchain and their correlation to ETH’s price.
We were playing around with our API and plotted new ETH addresses by day (incl. smart contracts) vs price.
This very interesting graph emerged ?? https://t.co/5WNKkqgcYw pic.twitter.com/0IZXG7VP6l
— TokenAnalyst (@thetokenanalyst) December 10, 2019
First things first, as described by TokenAnalyst, the numbers of new addresses represent the full historical number of unique addresses that appeared for the first time in a transaction, including the total number of addresses on the network every single day throughout its history.
As evident on the chart, the new addresses peaked in December and January in 2018, when ETH’s price reached its current all-time high value of around $1,400. After that, the number of addresses started to decline and so did the price.
However, it’s also important to note that at the beginning of the bear market in 2018 the price was declining at a rate much quicker than that of the addresses.
While the correlation between the price and the number of addresses is much more evident during the peak, there is a slight disbalance in 2019 and the movements aren’t so identical.
Bitcoin Sees a Similar Pattern
Interestingly enough, similarities of the kind can also be found with Bitcoin.
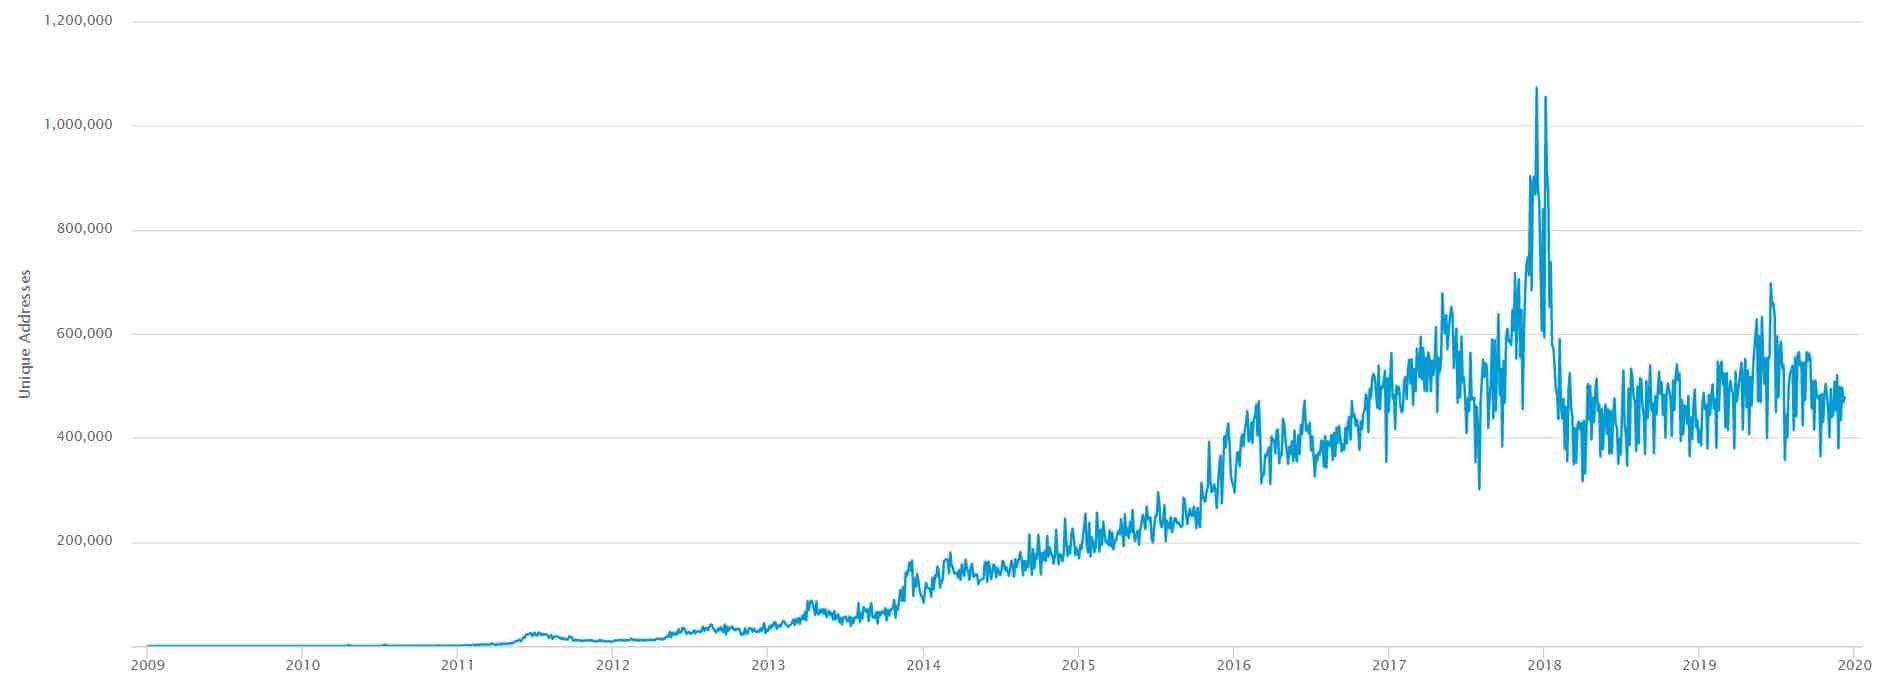
According to the chart, the number of unique bitcoin addresses used on Bitcoin’s blockchain peaked in December 2017. This is exactly when the BTC price hit its all-time high of around $20,000.
As it is the case with Ethereum, this same number began declining as the market turned and the prices started to tumble.