ETH/USD – Ethereum Returns To June 2018 Price LevelsKey Support Levels: 0, 1, 0.Key Resistance Levels: 0, 0, 0.Ethereum broke the 0 level for the first time in 2020 last Friday as it surged into the 1 resistance. Yesterday, the bulls continued to drive ETH even higher as they closed the day slightly above the 8 resistance (bearish .618 Fib Retracement).Today, after a retest of the same 1 resistance turned support level, the bulls penetrated 0 to reach as high as 8.50 – where they met resistance at a 1.414 Fib Extension and as of writing these lines – ETH is trading on that level. This latest price surge put Ethereum at a fresh 30-Month High as it reached prices not seen since June 2018.ETH/USD Daily Chart. Source: TradingViewETH-USD Short Term Price
Topics:
Yaz Sheikh considers the following as important: ETH Analysis, ETHBTC, Ethereum (ETH) Price, ethusd
This could be interesting, too:
CryptoVizArt writes Will Weak Momentum Drive ETH to .5K? (Ethereum Price Analysis)
Jordan Lyanchev writes Bybit Hack Fallout: Arthur Hayes, Samson Mow Push for Ethereum Rollback
Mandy Williams writes Ethereum Key Metrics Point to Persistent Bullish Outlook for ETH: CryptoQuant
CryptoVizArt writes Ethereum Price Analysis: Following a 15% Weekly Crash, What’s Next for ETH?
ETH/USD – Ethereum Returns To June 2018 Price Levels
Key Support Levels: $550, $521, $500.
Key Resistance Levels: $580, $600, $620.
Ethereum broke the $500 level for the first time in 2020 last Friday as it surged into the $511 resistance. Yesterday, the bulls continued to drive ETH even higher as they closed the day slightly above the $548 resistance (bearish .618 Fib Retracement).
Today, after a retest of the same $511 resistance turned support level, the bulls penetrated $550 to reach as high as $568.50 – where they met resistance at a 1.414 Fib Extension and as of writing these lines – ETH is trading on that level. This latest price surge put Ethereum at a fresh 30-Month High as it reached prices not seen since June 2018.
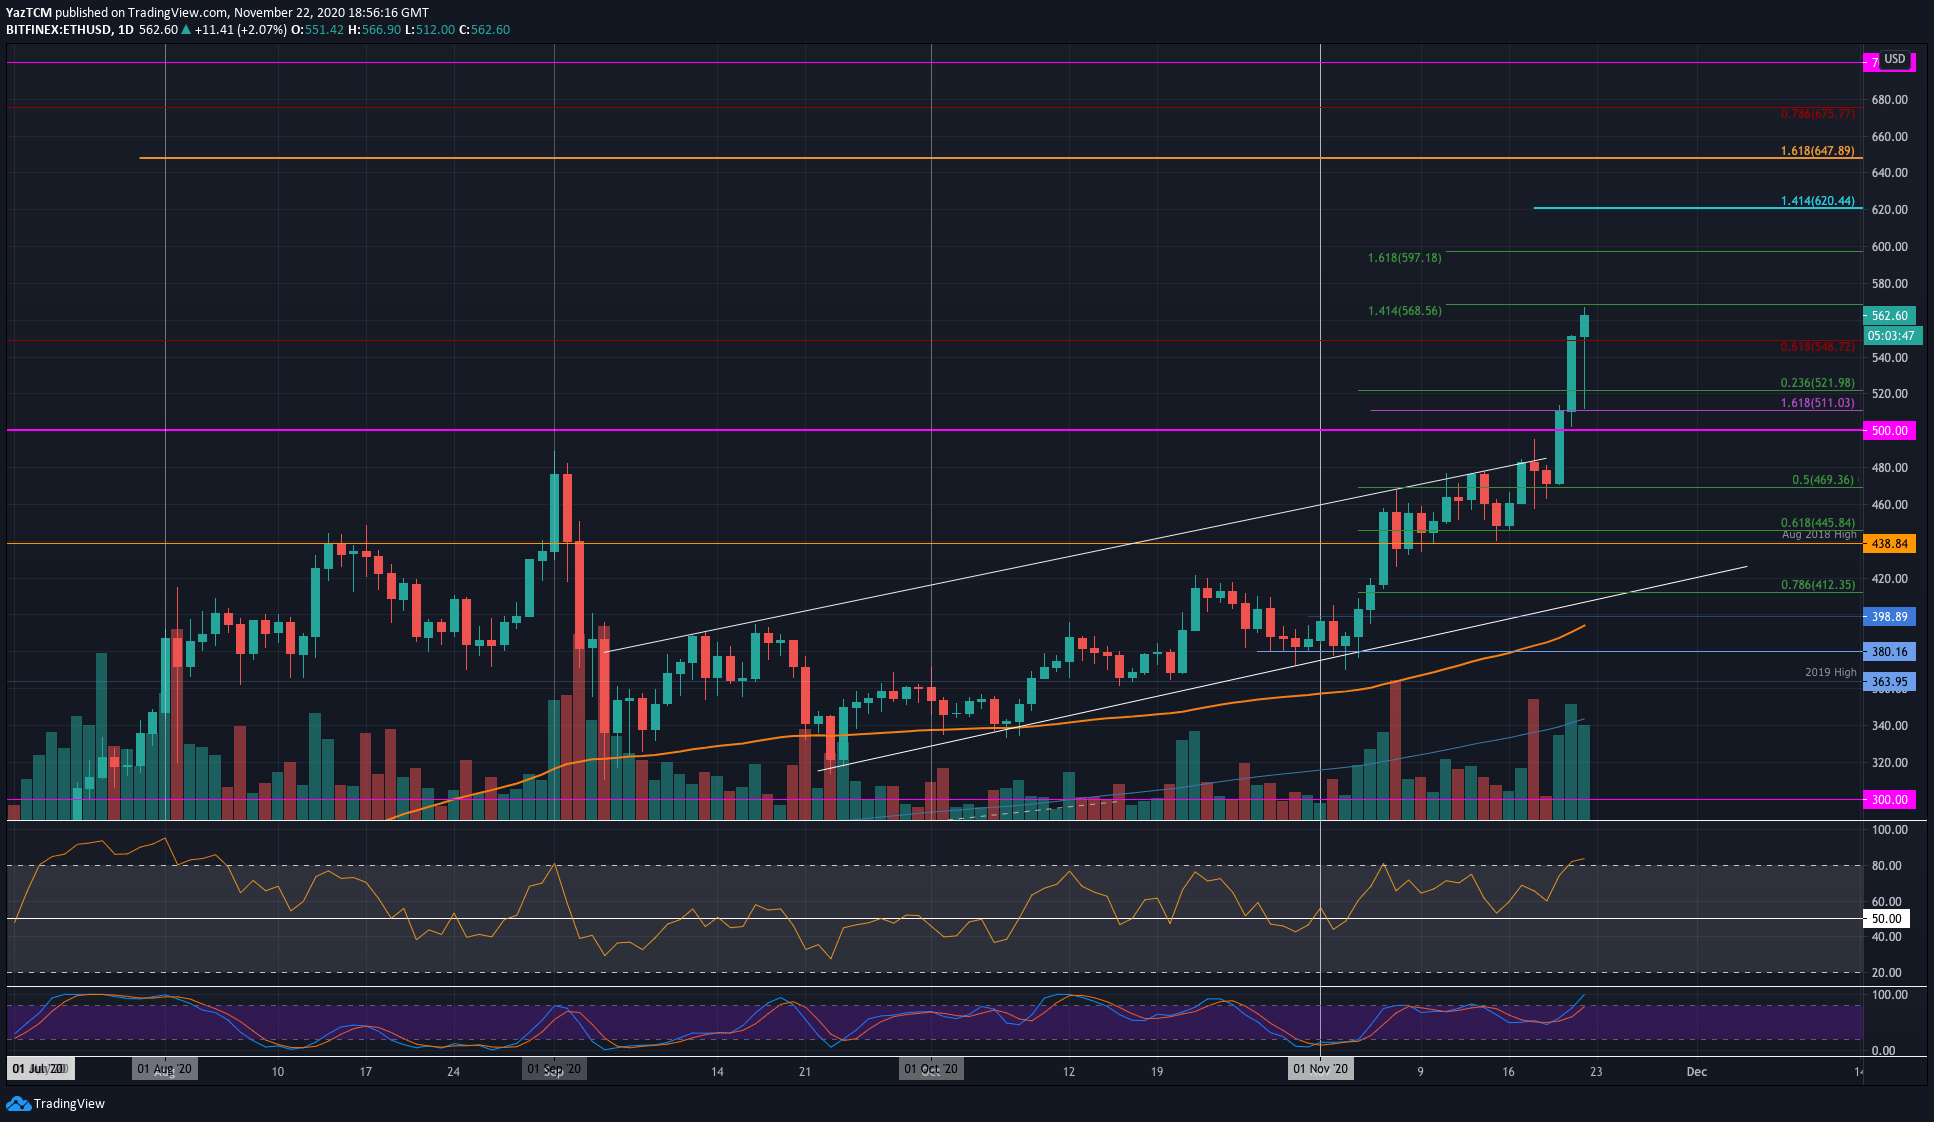
ETH-USD Short Term Price Prediction
Looking ahead, once the bulls break $568.50 – $570, the first level of resistance is expected at $580. This is followed by resistance at $600 (1.618 Fib Extension and psychological level). If the bulls continue beyond $600, resistance lies at $620, $650, and $675 (bearish .786 Fib Retracement).
On the other side, the first level of support lies at $550. Beneath this, support lies at $521 (.236 Fib), $500, and $470 (.5 Fib).
The RSI is in overbought territory and has been the highest since early August – suggesting the bulls might be overextending slightly, and correction might be coming up before new highs.
ETH/BTC – Bulls Rebound Into 100-days EMA.
Key Support Levels: 0.03 BTC, 0.0295 BTC, 0.0289 BTC.
Key Resistance Levels: 0.0313 BTC, 0.032 BTC, 0.033 BTC.
Against Bitcoin, Ethereum rebounded from the 6-month lows at 0.0265 BTC on Friday. It pushed as high as 0.0295 BTC yesterday, where it met the resistance at the 200-days EMA. During the move higher, Ethereum also managed to break a 3-month-old falling trend line as can be seen on the following chart.
Today, the buyers continued beyond the 200-days EMA as they pushed above the 0.03 BTC resistance to reach the nest resistance level at 0.0305 BTC (100-days EMA), as of writing these lines.
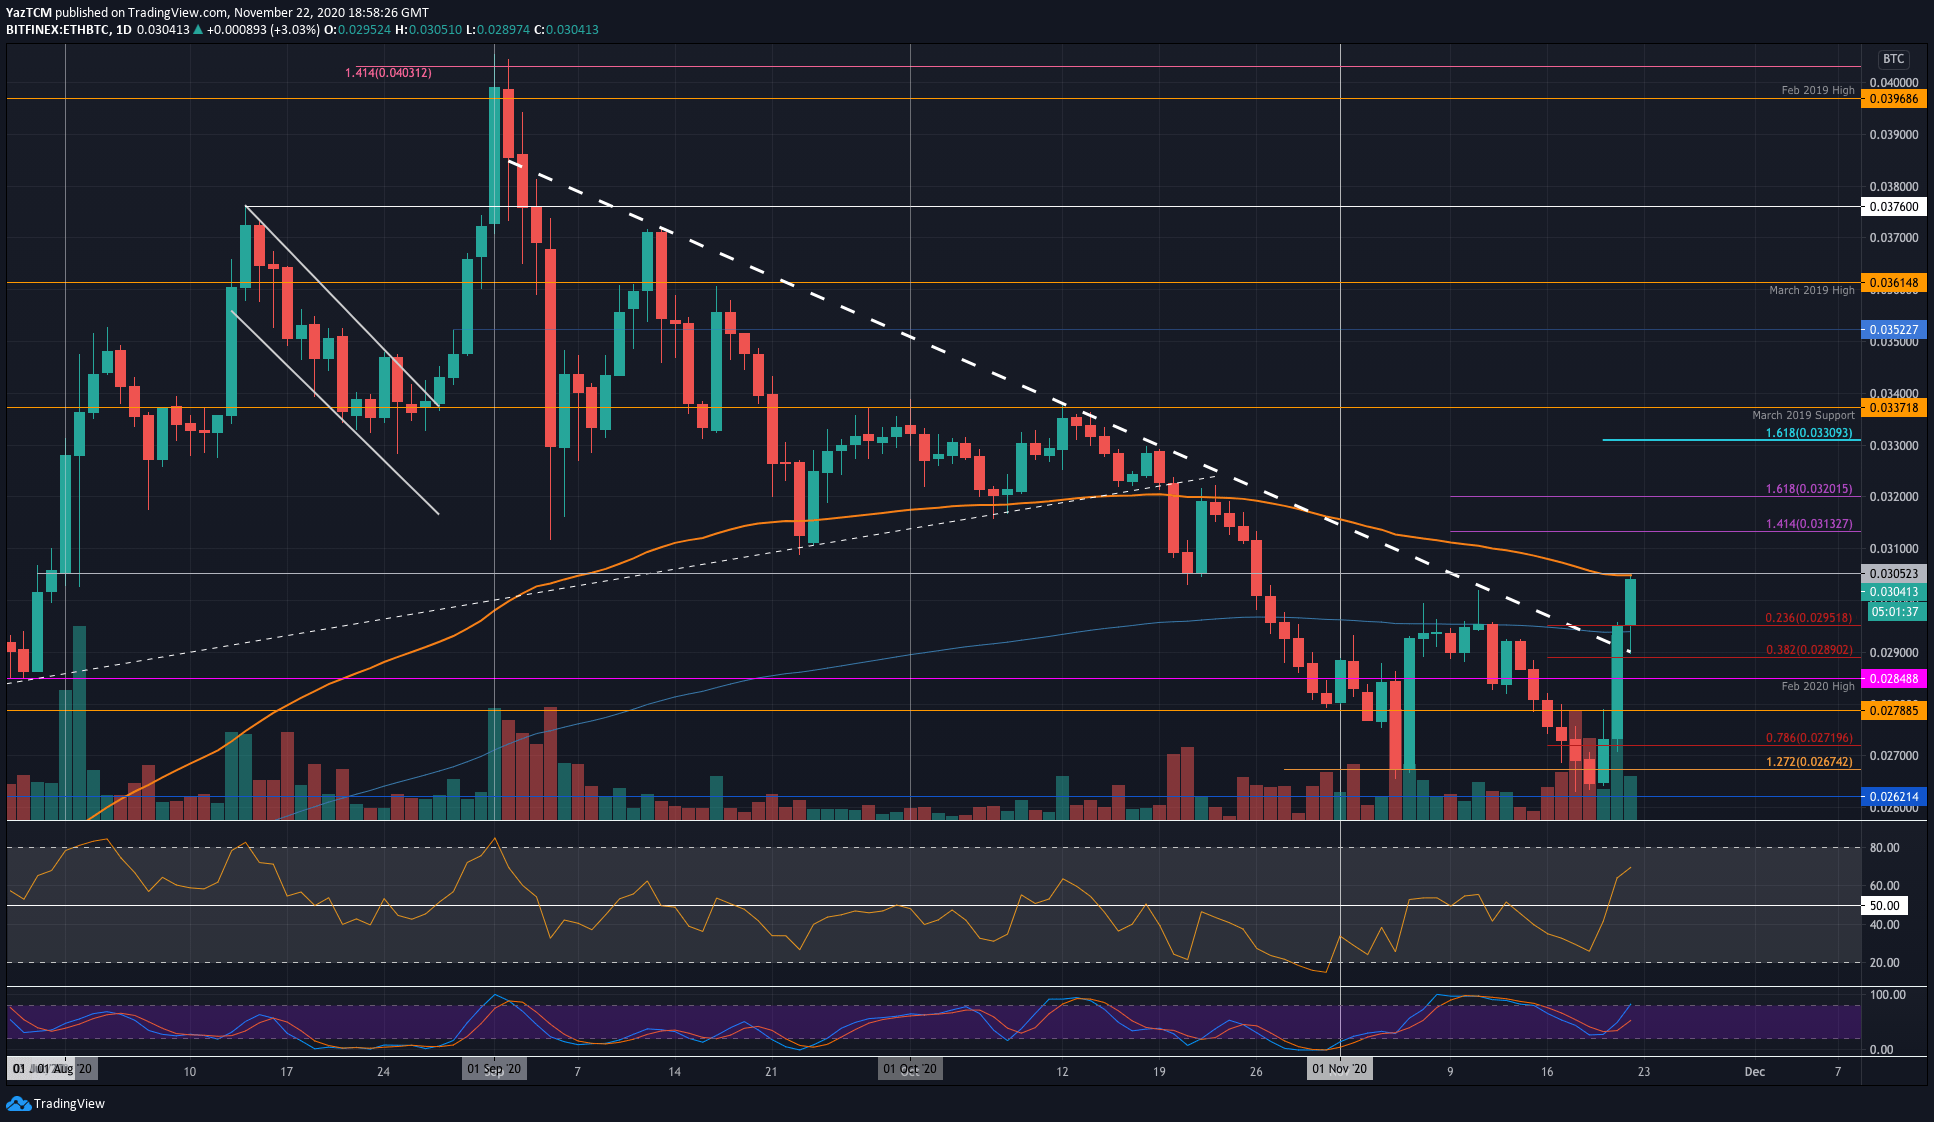
ETH-BTC Short Term Price Prediction
Looking ahead, if the bulls break the resistance at the 100-days EMA, the first level of resistance is expected at 0.0313 BTC (1.414 Fib Extension). Above this, resistance lies at 0.032 BTC (1.618 Fib Extension), 0.033 BTC, and 0.0337 BTC (March 2019 Support).
On the other side, the first level of support lies at 0.03 BTC. Beneath this, support is found at 0.0295 BTC (.236 Fib & 200-days EMA), 0.0289 BTC (.382 Fib), and 0.0285 BTC (Feb 2020 High).
The RSI recently swung back into the bull’s favor as it breaks the mid-line. Additionally, the Stochastic RSI also produced a bullish crossover signal that supported the rebound.