ETH/USD: ATH Area Tested One Last Time?Key Support Levels: 25, 92, 50.Key Resistance Levels: 0, 00, 30.Ethereum managed to climb by 8% today as it pushed from 75, breaking 00 to reach 56 as the current daily high. The cryptocurrency is now trading around the previous Jan-2018 ATH price, which was 40, according to Bitstamp.Even though ETH saw a higher price earlier in January, reaching as high as 80, the coin couldn’t hold above and failed to close a daily candle above the previous ATH price area. Following the 80 rejection, ETH plunged back into the 00 support as of last week.If ETH finally overcomes the 40 previous ATH area, we can expect a huge move into the price discovery area. Where ETH/USD never traded before and not a lot of resistance is
Topics:
Yaz Sheikh considers the following as important: ETH Analysis, ETHBTC, Ethereum (ETH) Price, ethusd
This could be interesting, too:
CryptoVizArt writes Will Weak Momentum Drive ETH to .5K? (Ethereum Price Analysis)
Jordan Lyanchev writes Bybit Hack Fallout: Arthur Hayes, Samson Mow Push for Ethereum Rollback
Mandy Williams writes Ethereum Key Metrics Point to Persistent Bullish Outlook for ETH: CryptoQuant
CryptoVizArt writes Ethereum Price Analysis: Following a 15% Weekly Crash, What’s Next for ETH?
ETH/USD: ATH Area Tested One Last Time?
Key Support Levels: $1425, $1392, $1350.
Key Resistance Levels: $480, $1500, $1530.
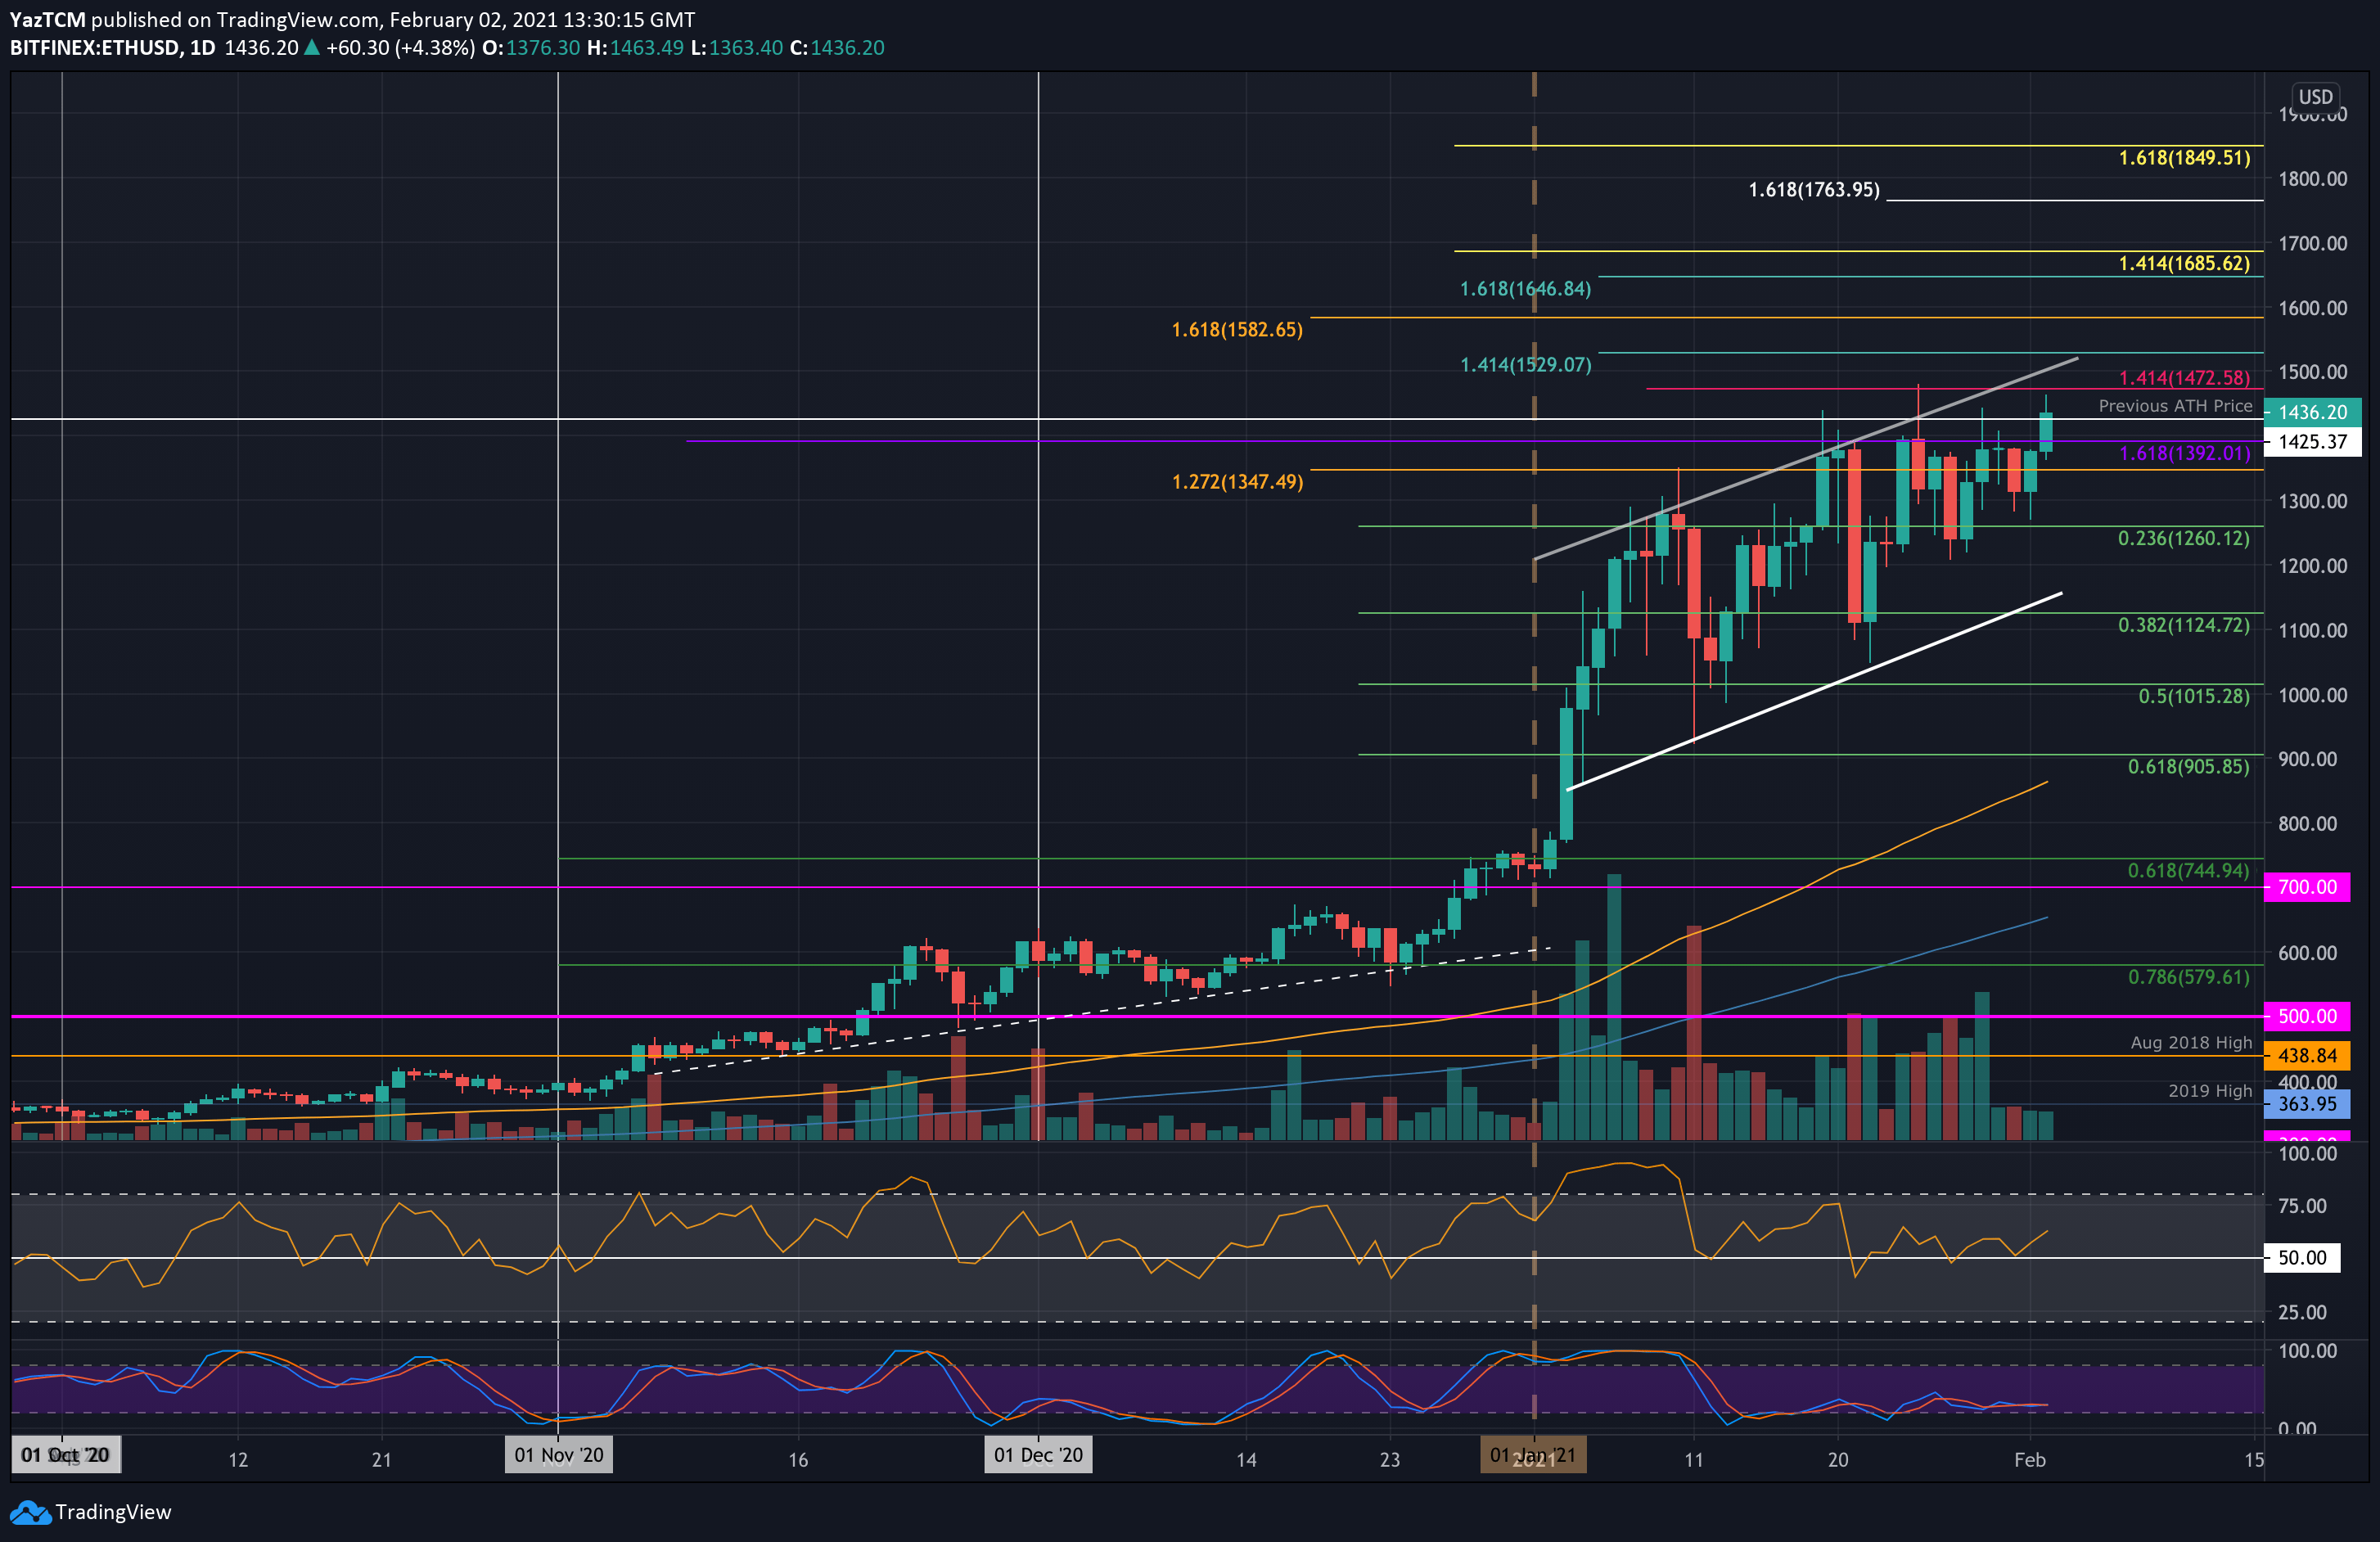
Ethereum managed to climb by 8% today as it pushed from $1375, breaking $1400 to reach $1456 as the current daily high. The cryptocurrency is now trading around the previous Jan-2018 ATH price, which was $1440, according to Bitstamp.
Even though ETH saw a higher price earlier in January, reaching as high as $1480, the coin couldn’t hold above and failed to close a daily candle above the previous ATH price area. Following the $1480 rejection, ETH plunged back into the $1200 support as of last week.
If ETH finally overcomes the $1440 previous ATH area, we can expect a huge move into the price discovery area. Where ETH/USD never traded before and not a lot of resistance is expected, just as Bitcoin did with the $20K previous ATH level.
ETH-USD Short Term Price Prediction
Looking ahead, the first level of resistance lies at current levels, which is the 2018 ATH. This is followed by $1480 (the current ATH Price) and resistance at $1500, provided by a rising price channel’s upper boundary and the psychological level.
Beyond the channel, resistance is found at $1530 (1.414 Fib Extension), $1600, and $1650 (1.618 Fib Extension).
From the bearish side, the first support lies at $1425 (previous ATH). This is followed by $1392, $1350, and $1300. Further support lies at $1260 (.236 Fib) and $1200.
The RSI also bounced higher from the midline, indicating the rising bullish momentum within the market.
ETH/BTC: Facing 0.042 Resistance
Key Support Levels: 0.0405 BTC, 0.0396 BTC, 0.039 BTC.
Key Resistance Levels: 0.0416 BTC, 0.042 – 0.0424 BTC, 0.0434 BTC..
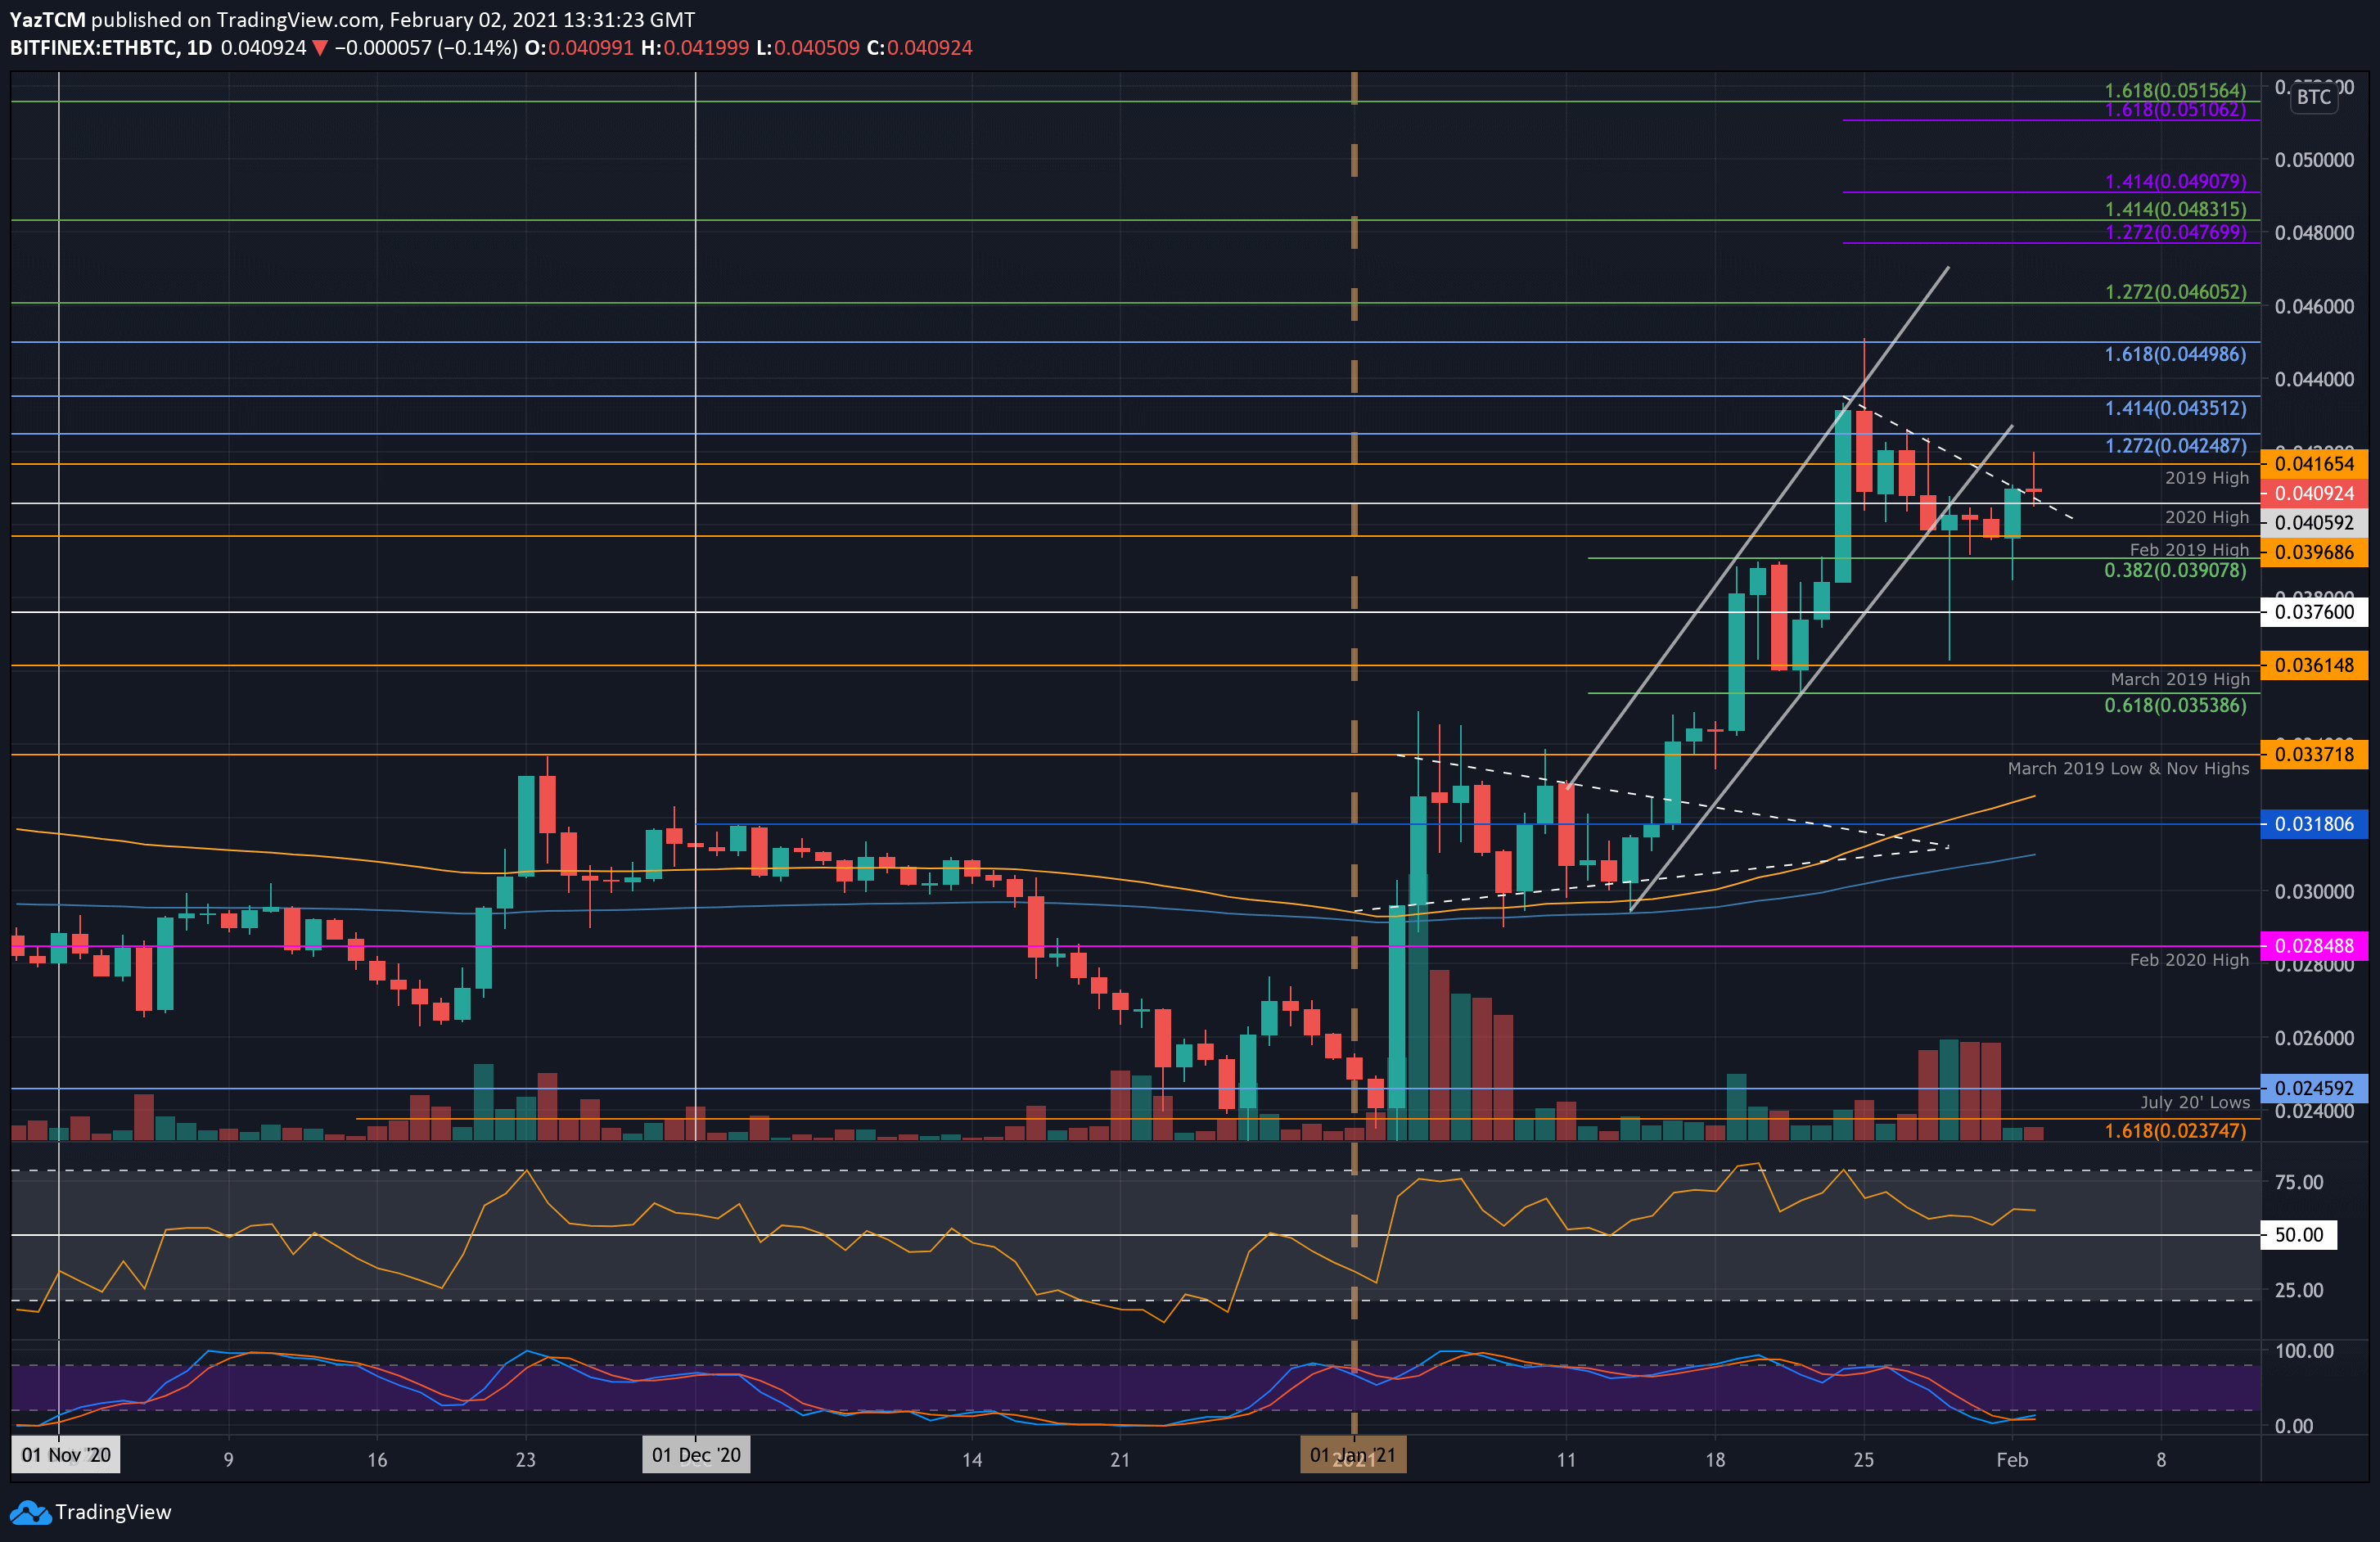
Against Bitcoin, Ethereum pushed as high as 0.045 BTC on January 25th. From there, it met resistance on the upper boundary of the marked ascending price channel and started to descend, till breaking below the channel. Following the breakdown, ETH/BTC found support upon 0.0396 BTC (Feb 2019 High), after reaching as low as 0.036, while Bitcoin spiked beyond $38K due to Elon Musk’s pump last Friday.
Yesterday, ETH finally reclaimed the critical 0.04 level, and today the bullish momentum continued as ETH recorded a daily high of 0.042.
ETH-BTC Short Term Price Prediction
Looking ahead, the first level of resistance lies at 0.0416 BTC (2019 High). This is followed by 0.042 – 0.0424 BTC (1.272 Fib Extension), 0.0435 BTC (1.414 Fib Extension & lower boundary of the ascending channel), 0.044 BTC, and 0.045 BTC (1.618 Fib Extension).
On the other side, the first support lies at 0.0405 BTC (2020 High). This is followed by 0.0396 BTC (Feb 2019 High), 0.0390 BTC (.382 Fib), and 0.0376 BTC.
The RSI is above the midline, around 60, as the bulls control the market in the longer-term. Besides, the Stochastic RSI had gone through a bullish crossover signal from the oversold area, which might give fuel for another leg up.