Ethereum increased 10% from its lowest level at the beginning of the week (below .9K), and the bulls regained some market control. But the big question is whether the bearish short-term sentiment is over? Technical Analysis Technical Analysis By Grizzly The Daily Chart On the daily timeframe, the bulls were able to push the price towards the resistance range of 00-00. As the Taker Buy/Sell Ration and Volume Delta shows, the buyer takers have been more powerful in the last few days, and the seller takers have retreated somewhat over the past ten days. In the short term, the main challenge for ETH is breaking above the resistance range marked in red. If ETH can close a daily candle above this range, we can expect another attempt at 00, along with the daily MA200.
Topics:
CryptoVizArt considers the following as important: ETH Analysis, ETHBTC, ethusd
This could be interesting, too:
Mandy Williams writes Ethereum Derivatives Metrics Signal Modest Downside Tail Risk Ahead: Nansen
Jordan Lyanchev writes Weekly Bitcoin, Ethereum ETF Recap: Light at the End of the Tunnel for BTC
CryptoVizArt writes Will Weak Momentum Drive ETH to .5K? (Ethereum Price Analysis)
Jordan Lyanchev writes Bybit Hack Fallout: Arthur Hayes, Samson Mow Push for Ethereum Rollback
Ethereum increased 10% from its lowest level at the beginning of the week (below $2.9K), and the bulls regained some market control. But the big question is whether the bearish short-term sentiment is over?
Technical Analysis
Technical Analysis By Grizzly
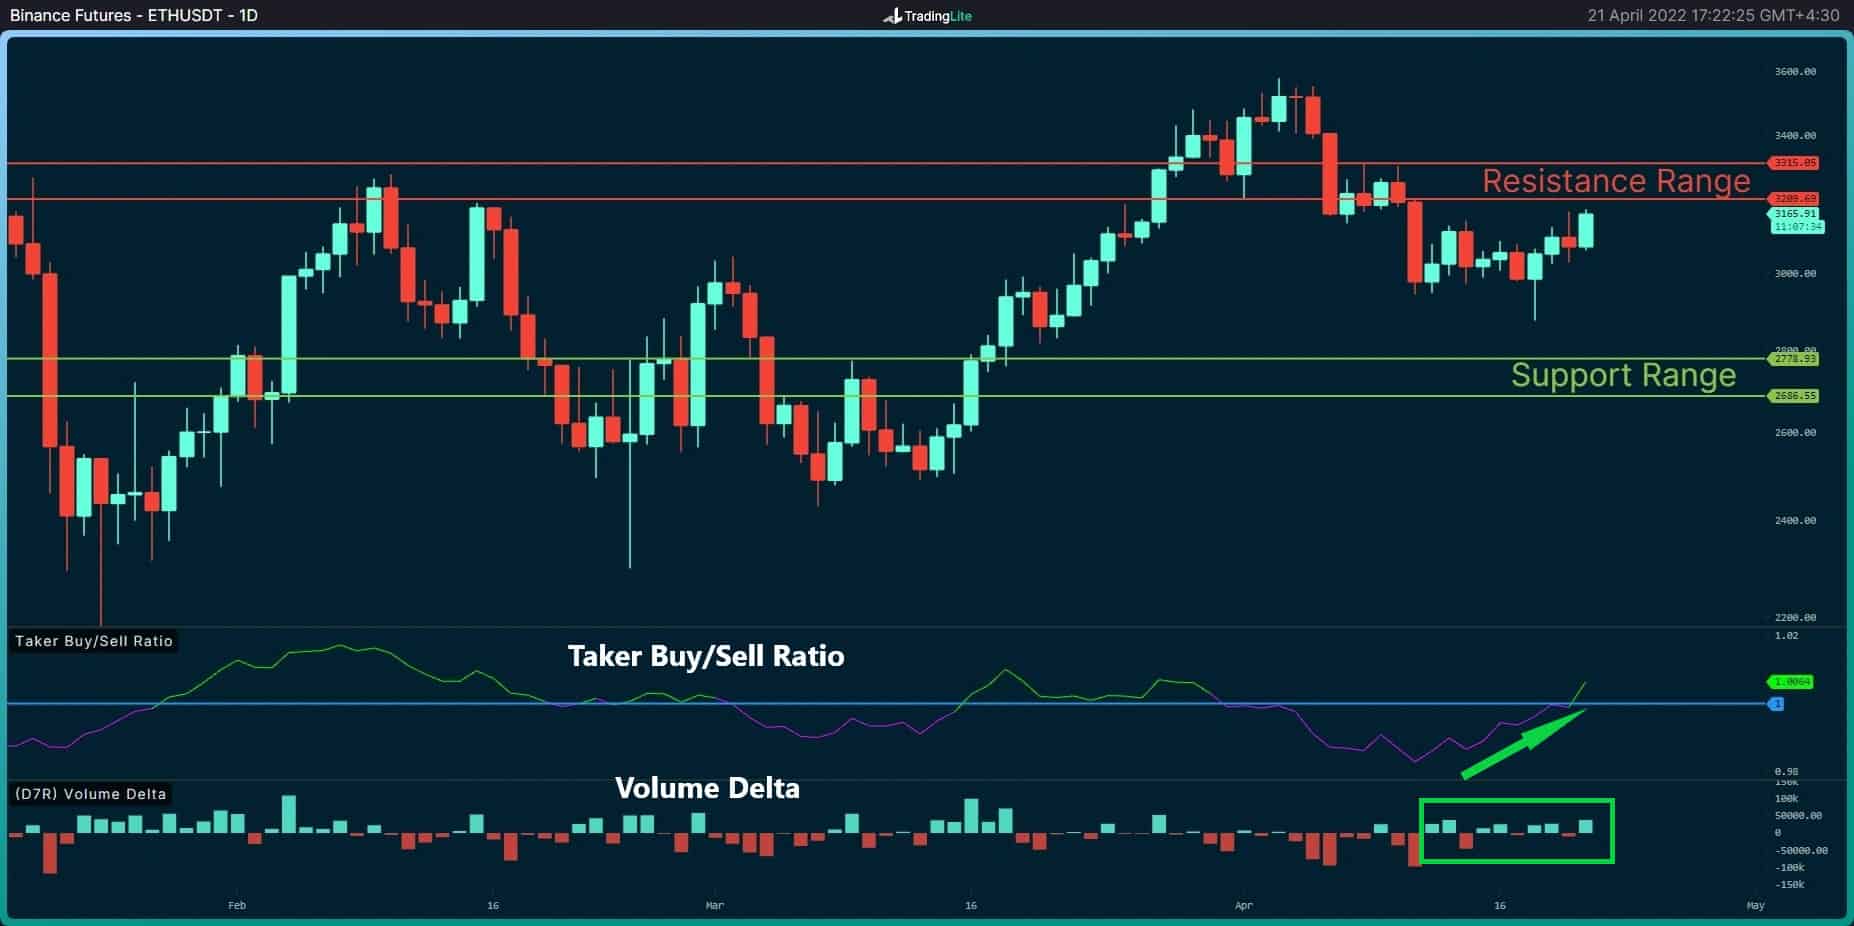
The Daily Chart
On the daily timeframe, the bulls were able to push the price towards the resistance range of $3200-$3300.
As the Taker Buy/Sell Ration and Volume Delta shows, the buyer takers have been more powerful in the last few days, and the seller takers have retreated somewhat over the past ten days. In the short term, the main challenge for ETH is breaking above the resistance range marked in red.
If ETH can close a daily candle above this range, we can expect another attempt at $3600, along with the daily MA200. On the other hand, if ETH gets rejected from this area, the support range of $2700 – $2800 is the first major support below $3K.
Moving Averages:
MA20: $3178
MA50: $2004
MA100: $2932
MA200: $3489
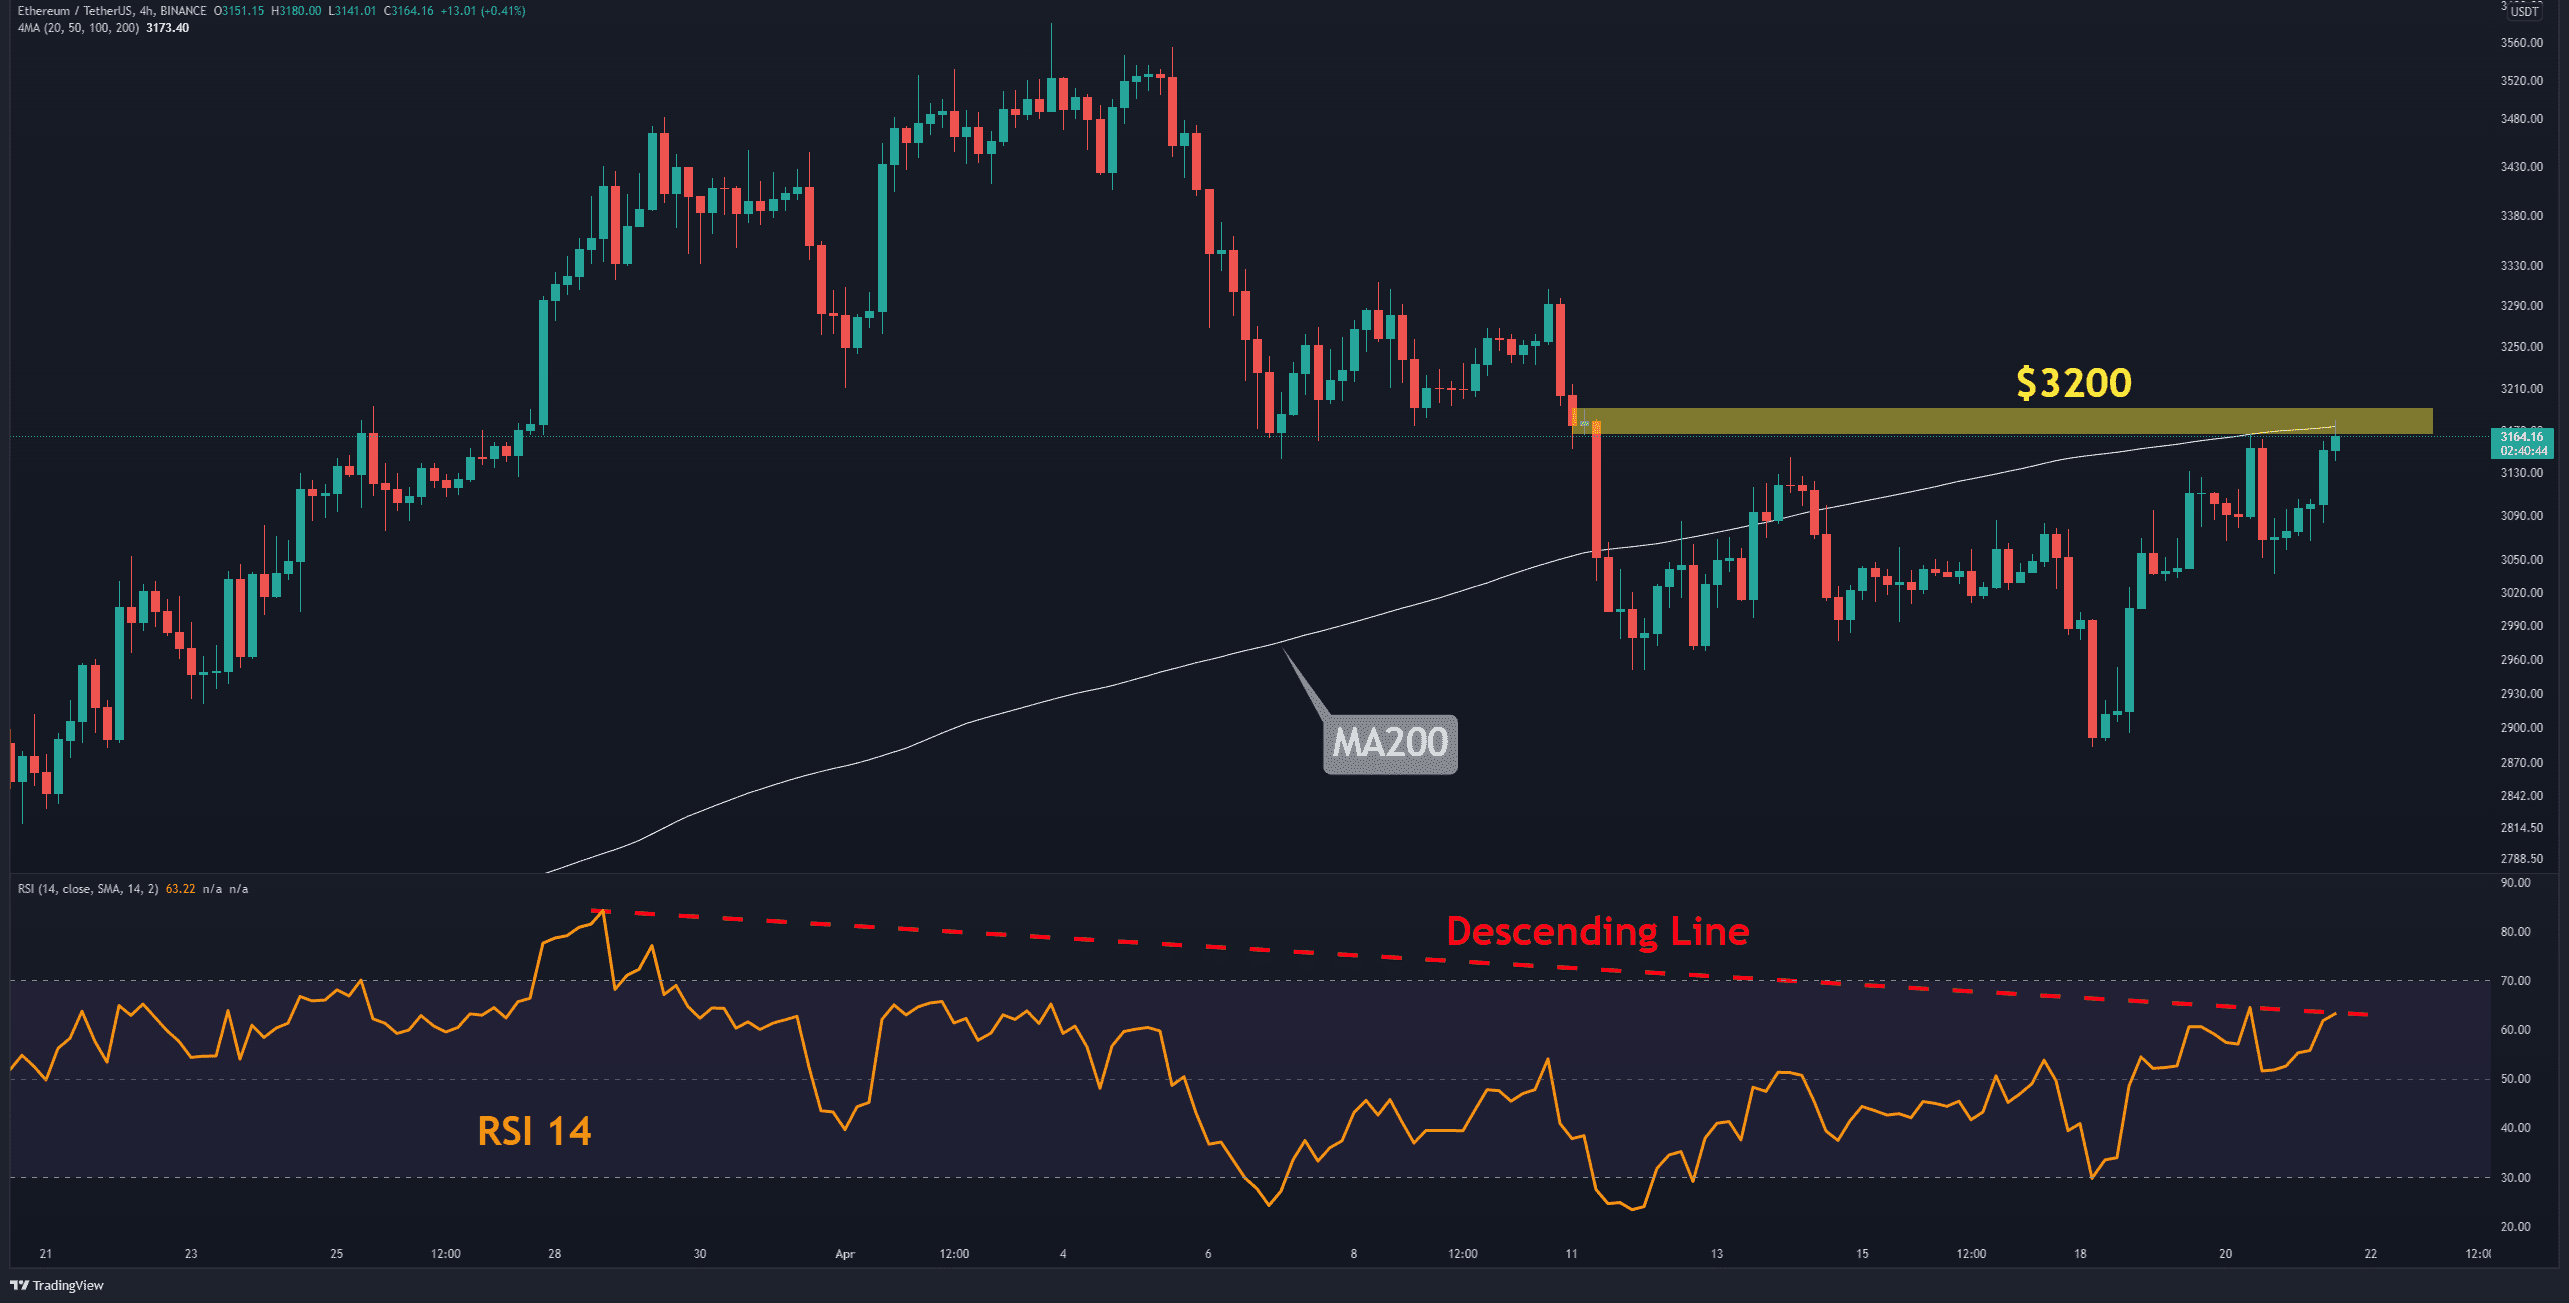
The 4-Hour Chart
On the 4-hour timeframe, Ethereum is struggling with the MA200 line. In addition, RSI 14 indicator is facing resistance at the marked descending line (marked red).
If the price can consolidate above this zone (marked yellow) in the short term, the bullish trend will likely continue.
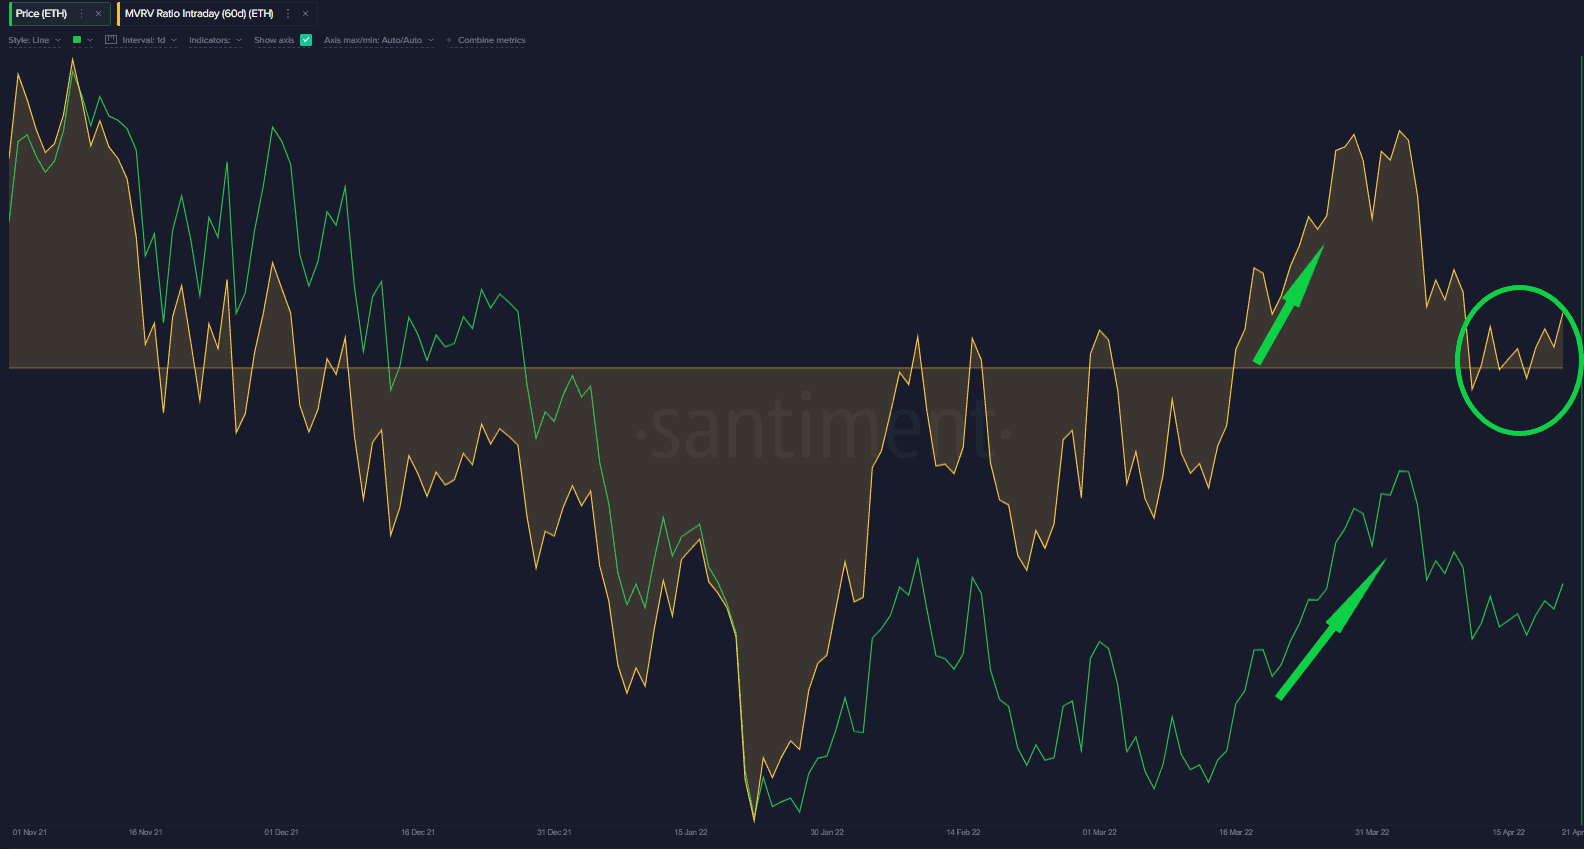
On-Chain Analysis: MVRV 60D
MVRV shows the average profit/loss of all the coins currently in circulation given the current price. MVRV 60-day is calculated by taking only the coins/tokens that moved at least once over the past 60 days.
When this metric consolidates above the baseline during an uptrend, the price likely has entered a bullish range. The bears repeatedly tried to push this metric down the baseline last week, but the bulls defended it and did not allow further correction. As long as this MVRV 60-day is above the baseline, there is a possibility for an uptrend.