Despite pushing the price higher earlier in the week, the bulls have lost momentum as the days went on. As the date of the Merge approaches and the Ethereum market grows hotter, speculation about the future of the price has reached its peak. Technical Analysis By Grizzly The Daily Chart The formation of lower highs and lower lows suggests a bearish structure. The recent bullish leg stalled when it reached the resistance of the 20-day moving average line (in yellow). However, the 100-day moving average (in white) accompanies the asset as support. If the buyers are to initiate another increase ahead of the Merge, they should push the price above ,720. Positive sentiment will dominate the market in the short term if this occurs. Alternatively, the support zone is between
Topics:
CryptoVizArt considers the following as important: ETH Analysis, ETHBTC, Ethereum (ETH) Price, ethusd
This could be interesting, too:
CryptoVizArt writes Will Weak Momentum Drive ETH to .5K? (Ethereum Price Analysis)
Jordan Lyanchev writes Bybit Hack Fallout: Arthur Hayes, Samson Mow Push for Ethereum Rollback
Mandy Williams writes Ethereum Key Metrics Point to Persistent Bullish Outlook for ETH: CryptoQuant
CryptoVizArt writes Ethereum Price Analysis: Following a 15% Weekly Crash, What’s Next for ETH?
Despite pushing the price higher earlier in the week, the bulls have lost momentum as the days went on. As the date of the Merge approaches and the Ethereum market grows hotter, speculation about the future of the price has reached its peak.
Technical Analysis
By Grizzly
The Daily Chart
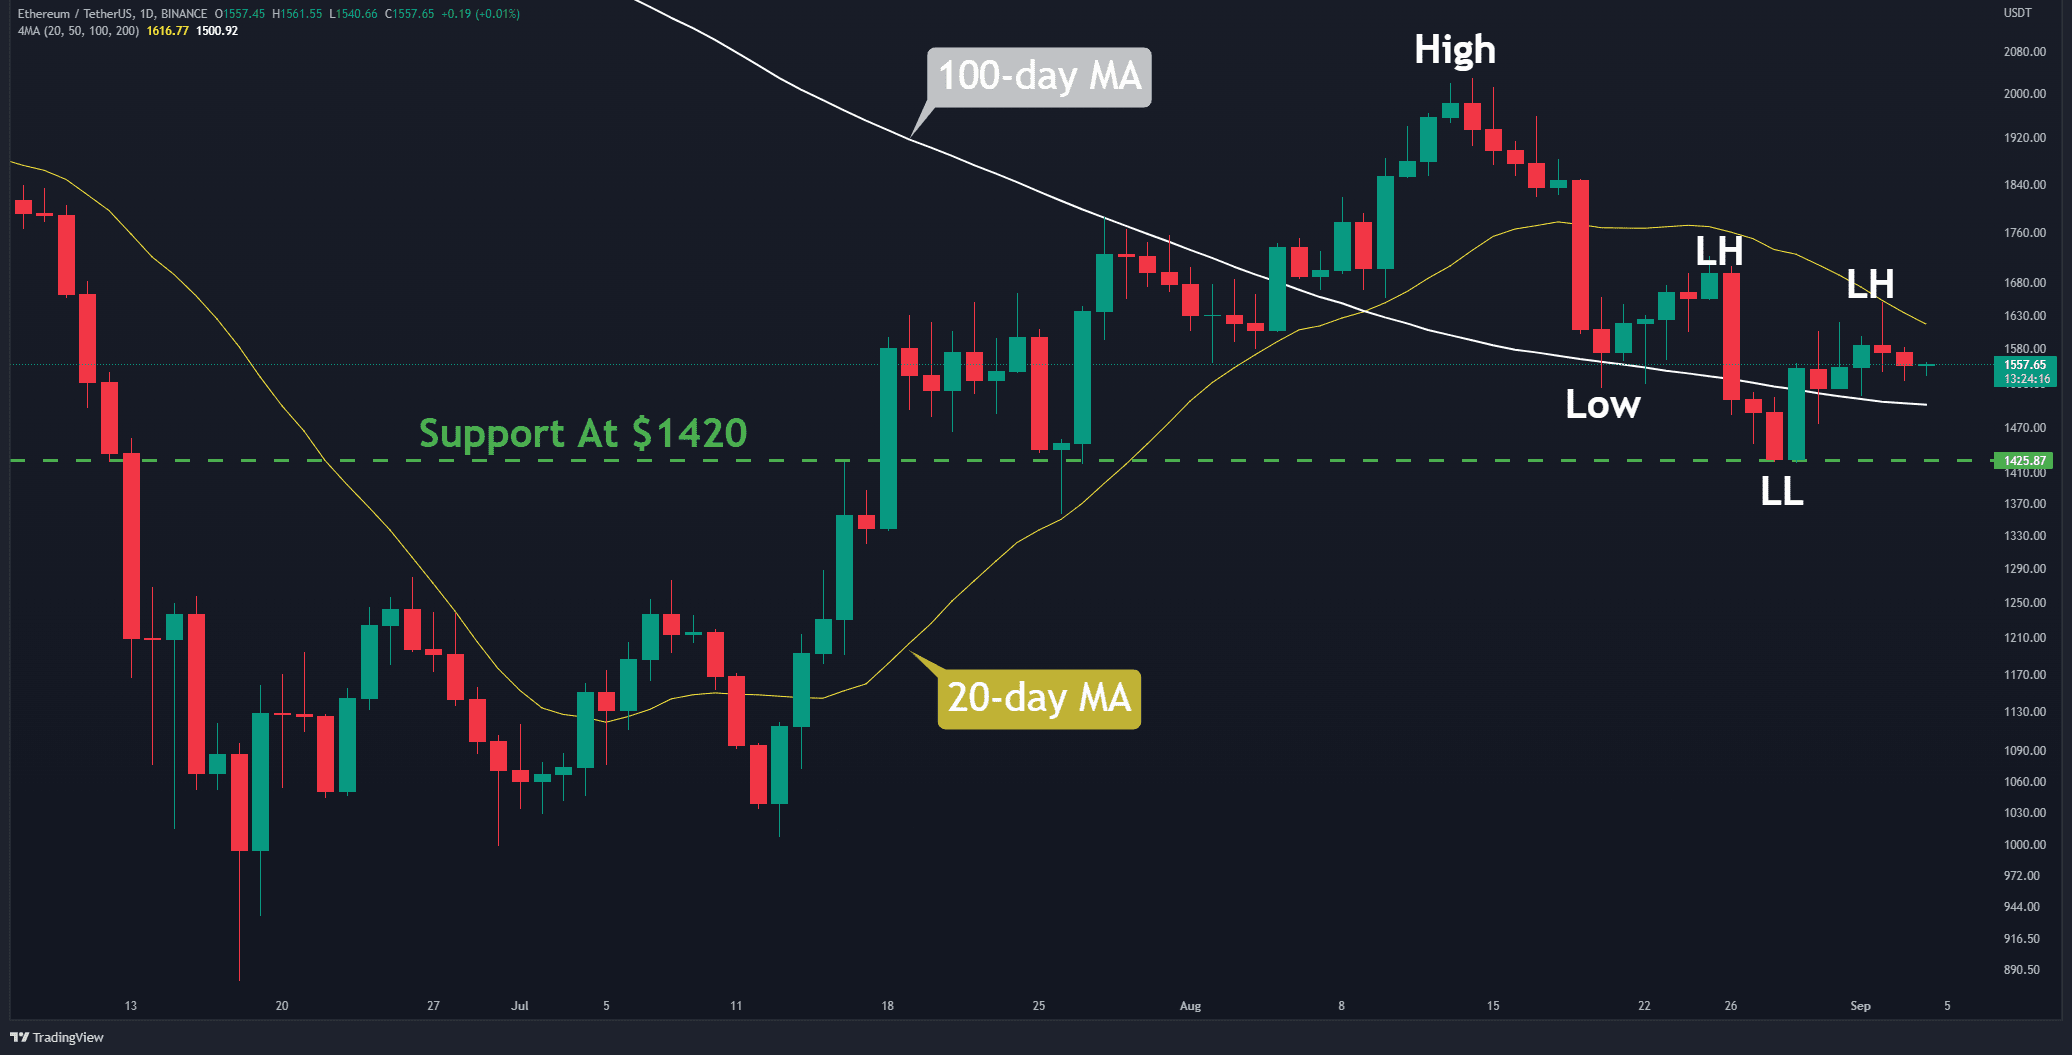
The formation of lower highs and lower lows suggests a bearish structure. The recent bullish leg stalled when it reached the resistance of the 20-day moving average line (in yellow). However, the 100-day moving average (in white) accompanies the asset as support.
If the buyers are to initiate another increase ahead of the Merge, they should push the price above $1,720. Positive sentiment will dominate the market in the short term if this occurs.
Alternatively, the support zone is between the horizontal line at $1420 (in green) and the MA100, which lies at $1500. A break and close below this zone would kill any hopes of starting a bullish rally.
In conclusion, the bearish presence remains strong until the price goes above $1720. Also, having the cryptocurrency drop below the mentioned support could trigger future cascades.
Key Support Levels: $1420 & $1300
Key Resistance Levels: $1720 & $2000
Daily Moving Averages:
MA20: $1616
MA50: $1650
MA100: $1500
MA200: $2124
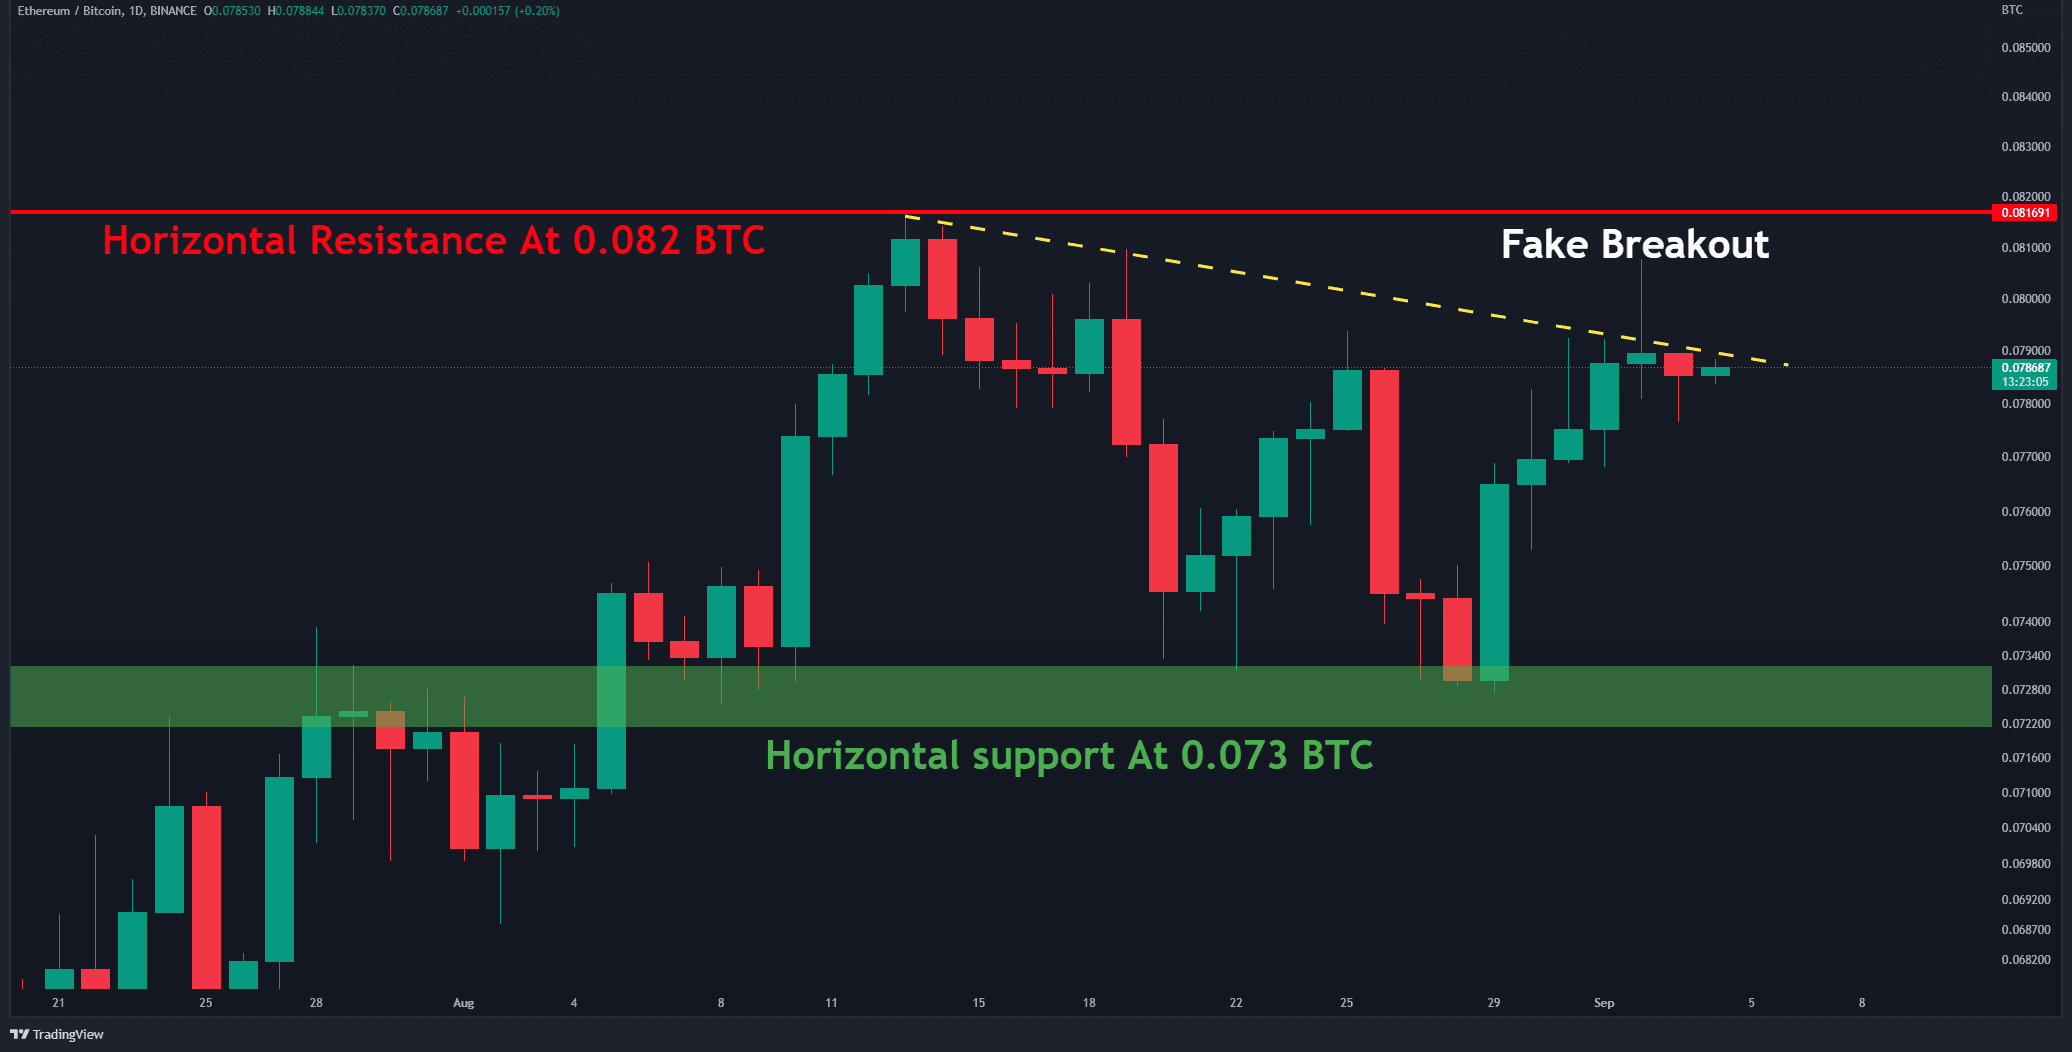
The ETH/BTC Chart
Against Bitcoin, the bears are selling above 0.08 BTC. This caused a fake breakout. More strength from buyers is evident, although they need to clear the horizontal resistance at 0.082 BTC (in red) to continue to dominate the market.
Presently, investors seem to favor Ethereum over Bitcoin. The critical support level is at 0.073 BTC (in green). If it cracks, the bullish trend change will be confirmed.
Key Support Levels: 0.0.073 & 0.065 BTC
Key Resistance Levels: 0.082 & 0.088 BTC
On-chain Analysis
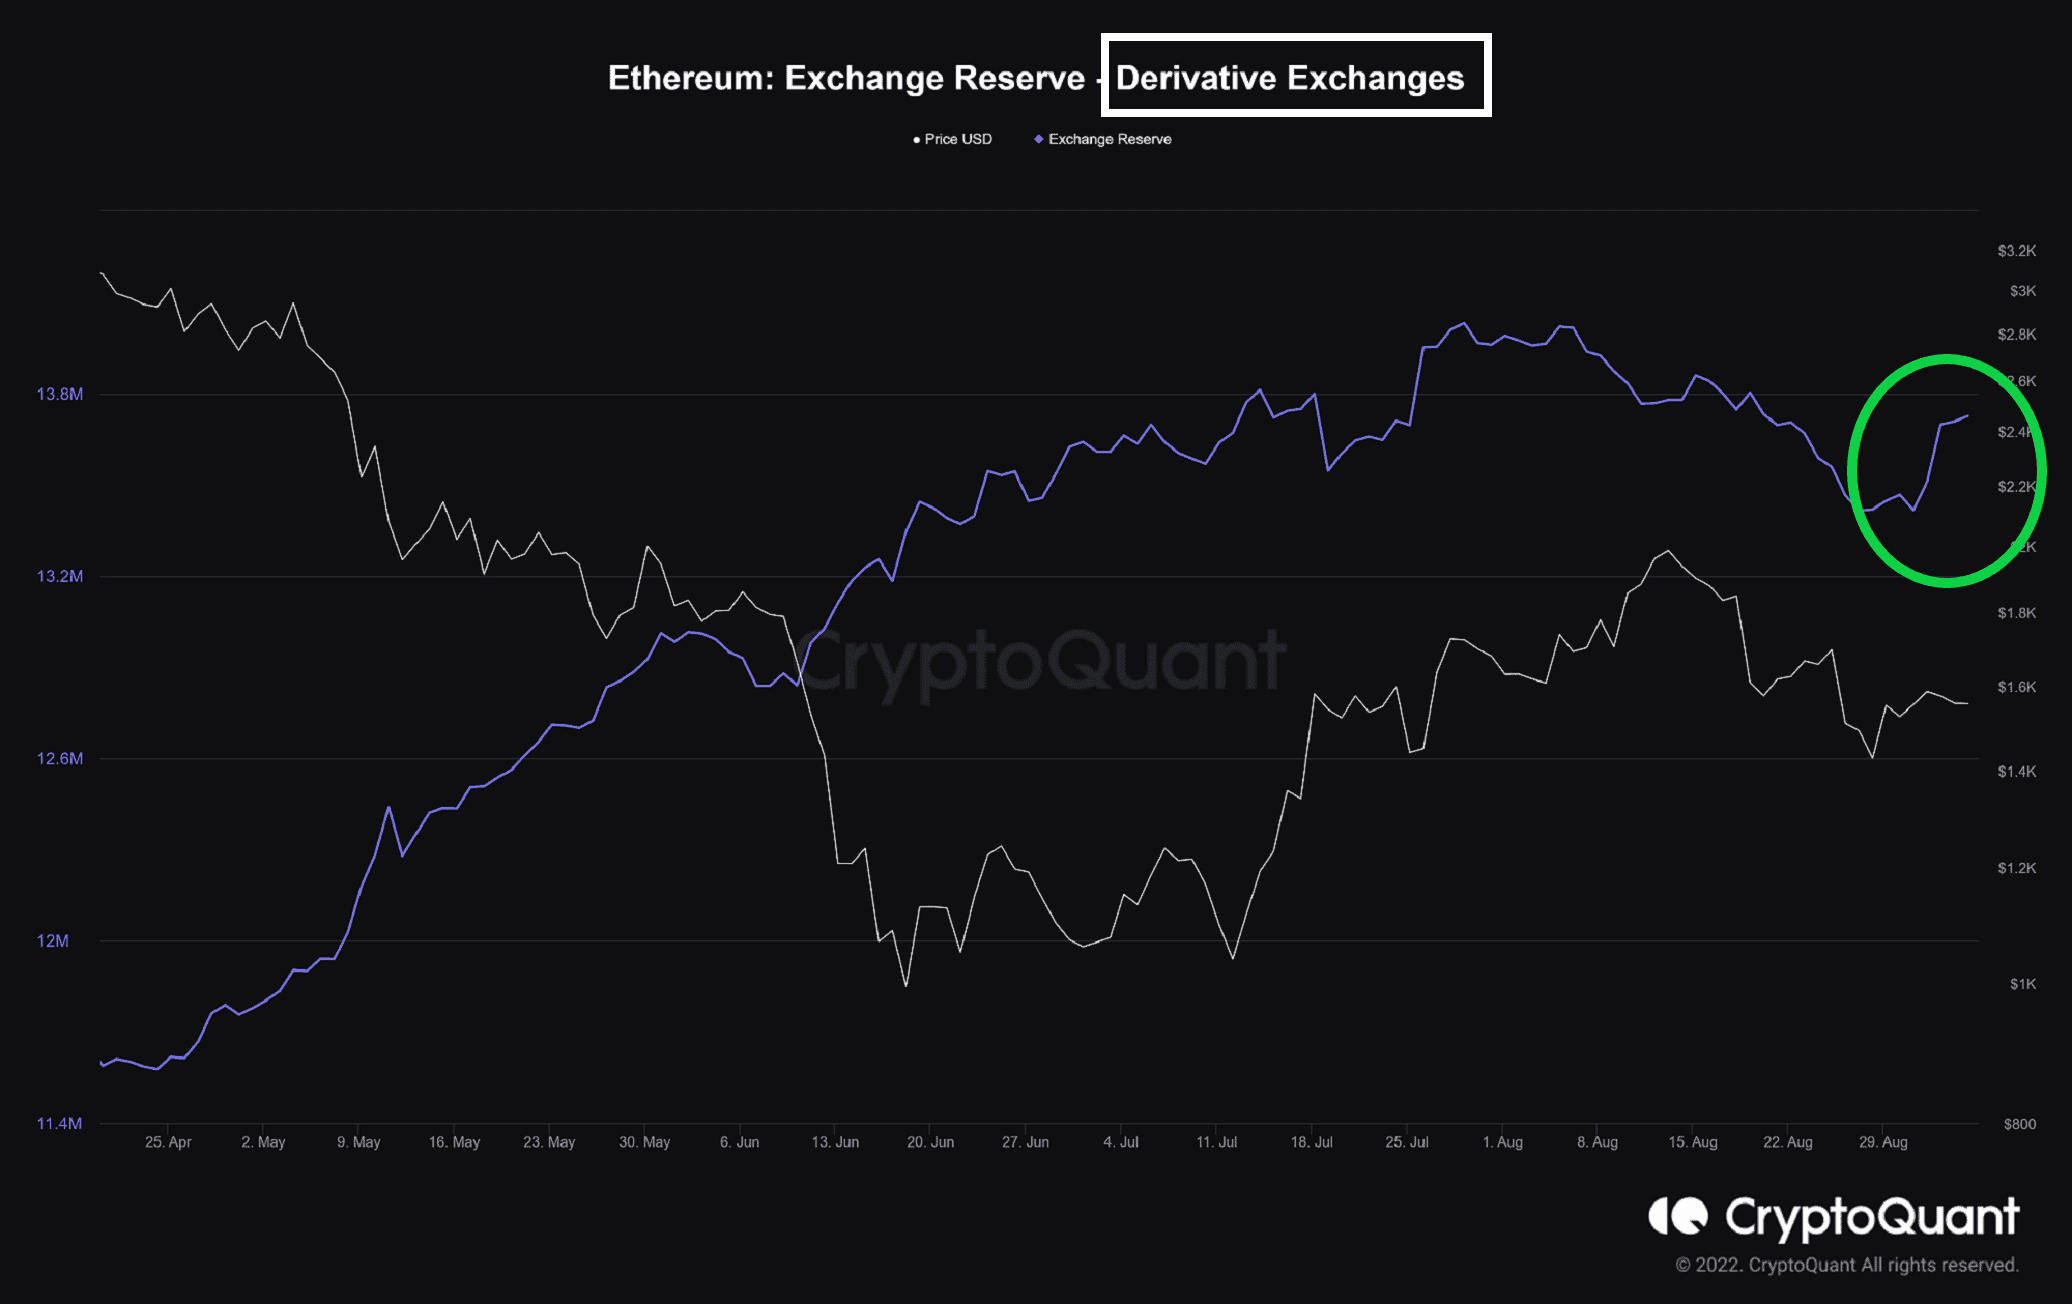
Exchange Reserve – Derivative Exchanges
Definition: The total number of coins held in derivative exchanges.
Inflow into the derivatives market is increasing again. Since these coins can be used to open both long and short positions, it is expected that the volatility will increase in the coming days. It should be noted that the last time this increase happened, it was accompanied by a rise in prices.