The bulls have been in control of the market for more than a month. They have managed to push the price by more than 100%. The majority of this rally has been without a considerable correction, begging the question if one is pending following the test of the critical K level. Technical Analysis By Grizzly The Daily Chart Buyers still dominate the market and push the price up. They were able to return to the ,000 level after 74 days. In the meantime, a critical resistance zone is blocking Ethereum. It is formed as a result of meeting the horizontal resistance in the 00-2300 range (in red), the descending line resistance (in yellow), and the 200-day moving average (in white). A close above this zone can extend the rally to ,700. On the other hand, the Relative
Topics:
CryptoVizArt considers the following as important: ETH Analysis, ETHBTC, Ethereum (ETH) Price, ethusd
This could be interesting, too:
Mandy Williams writes Ethereum Derivatives Metrics Signal Modest Downside Tail Risk Ahead: Nansen
Jordan Lyanchev writes Weekly Bitcoin, Ethereum ETF Recap: Light at the End of the Tunnel for BTC
CryptoVizArt writes Will Weak Momentum Drive ETH to .5K? (Ethereum Price Analysis)
Jordan Lyanchev writes Bybit Hack Fallout: Arthur Hayes, Samson Mow Push for Ethereum Rollback
The bulls have been in control of the market for more than a month. They have managed to push the price by more than 100%. The majority of this rally has been without a considerable correction, begging the question if one is pending following the test of the critical $2K level.
Technical Analysis
By Grizzly
The Daily Chart
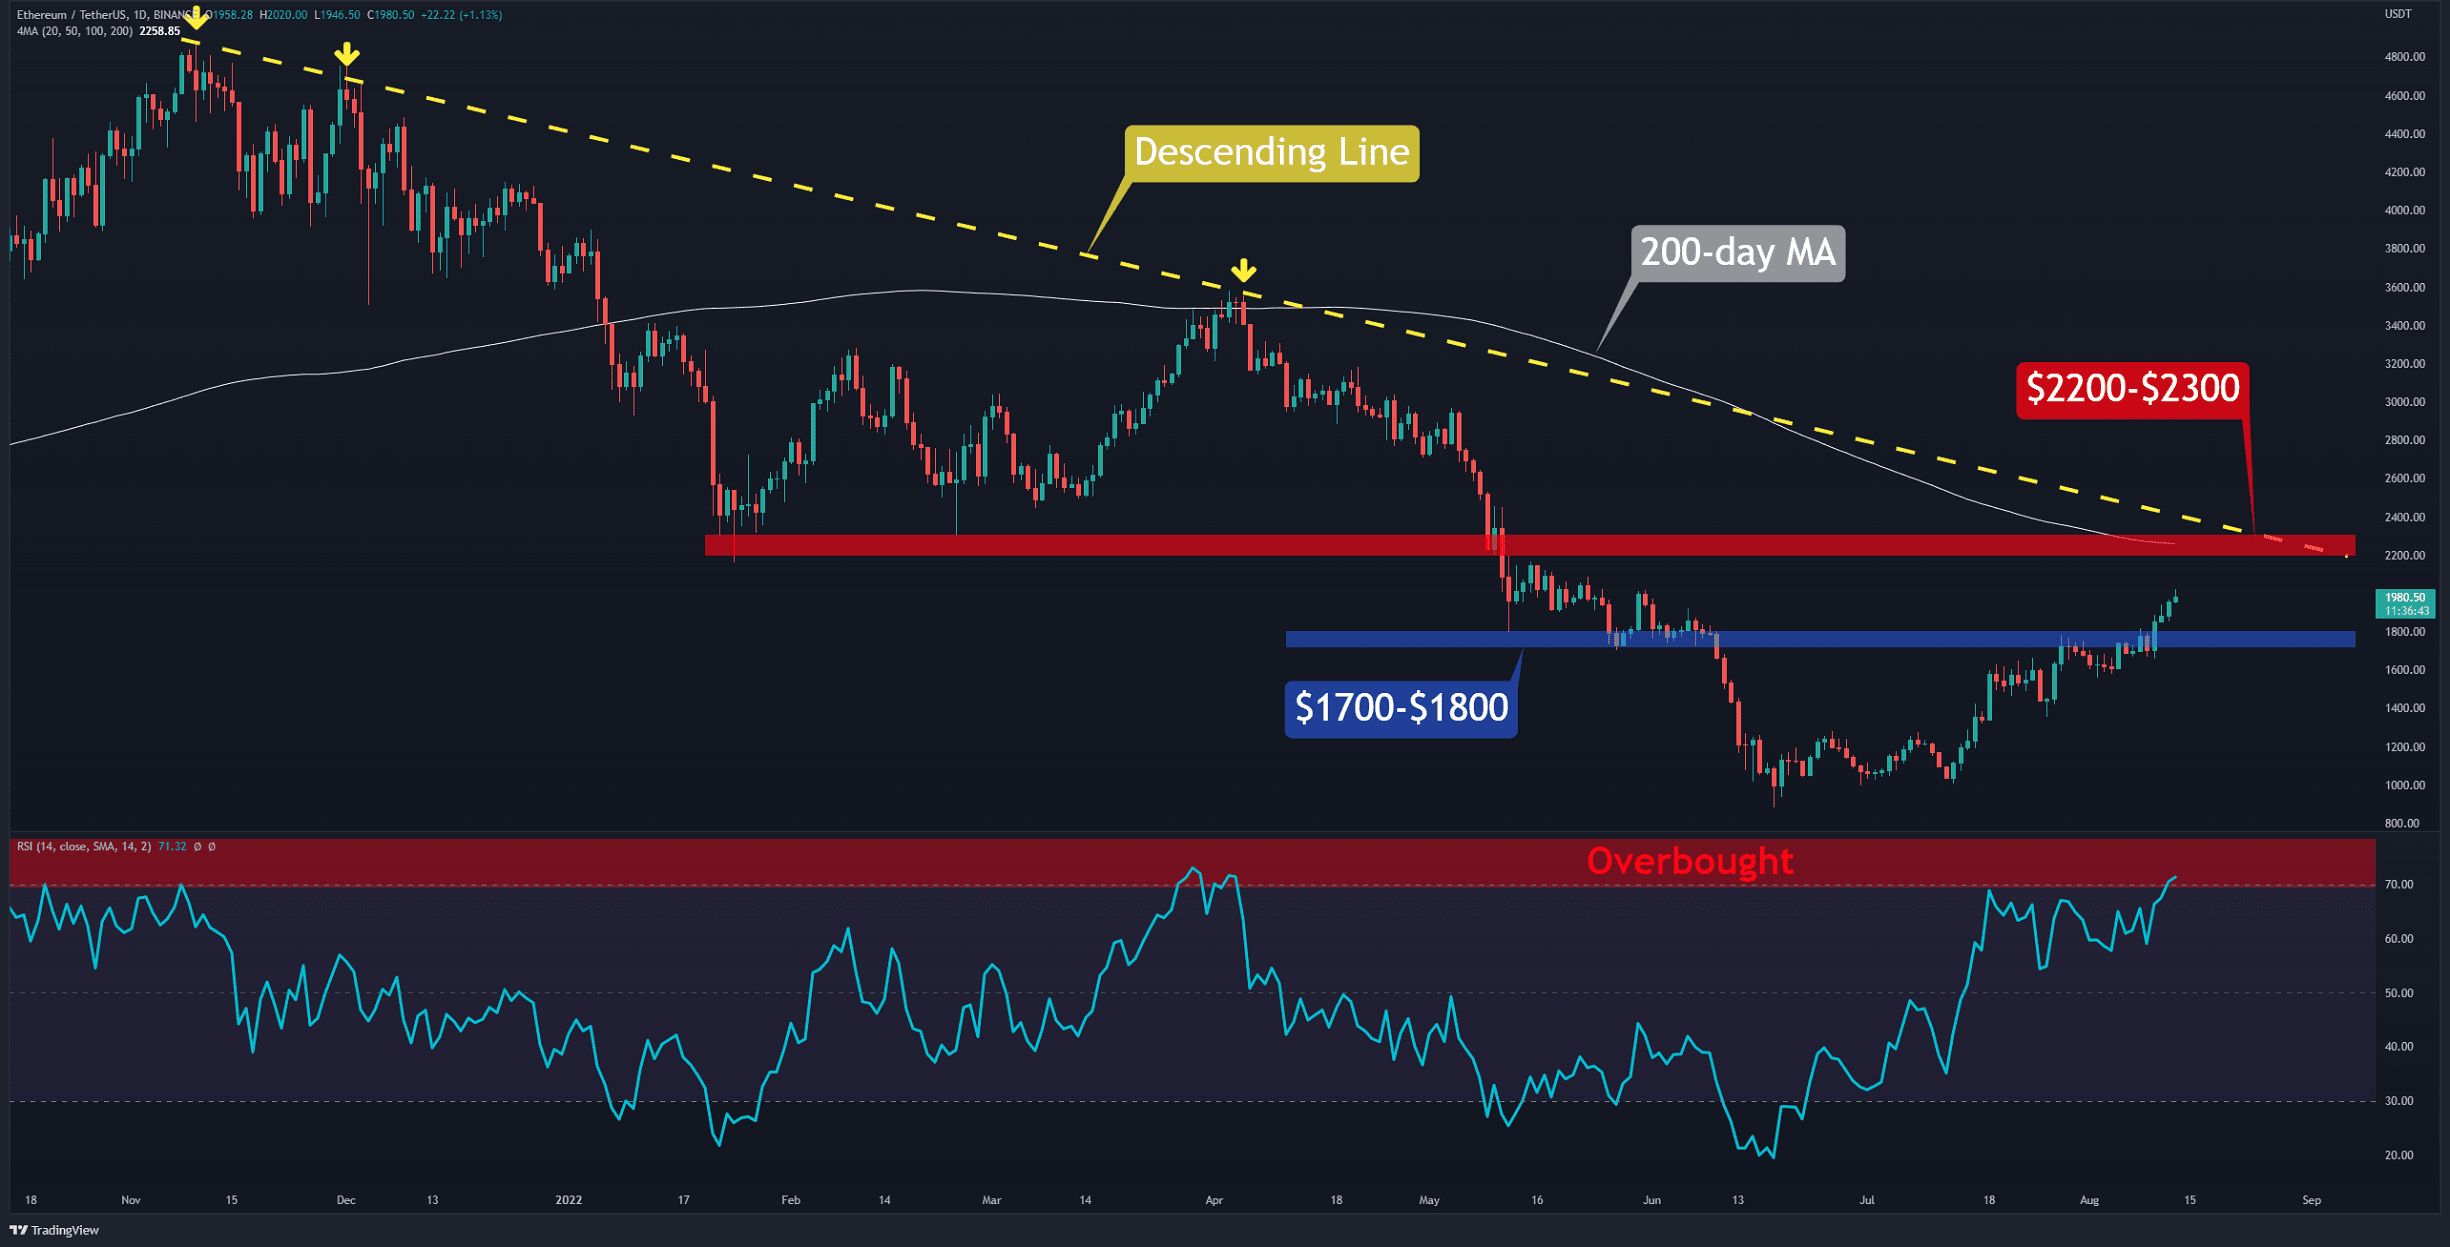
Buyers still dominate the market and push the price up. They were able to return to the $2,000 level after 74 days.
In the meantime, a critical resistance zone is blocking Ethereum. It is formed as a result of meeting the horizontal resistance in the $2200-2300 range (in red), the descending line resistance (in yellow), and the 200-day moving average (in white). A close above this zone can extend the rally to $2,700.
On the other hand, the Relative Strength Index (RSI) has reached above 70, which can be a warning sign. If Ethereum performs similarly to April 2022 and November 2021, it will likely take a break by touching/before touching the resistance zone. In this case, it can be expected that $1700-$1800 will be retested.
Key Support Levels: $1800 & $1500
Key Resistance Levels: $2160 & $2300
Daily Moving Averages:
MA20: $1705
MA50: $1436
MA100: $1600
MA200: $2258
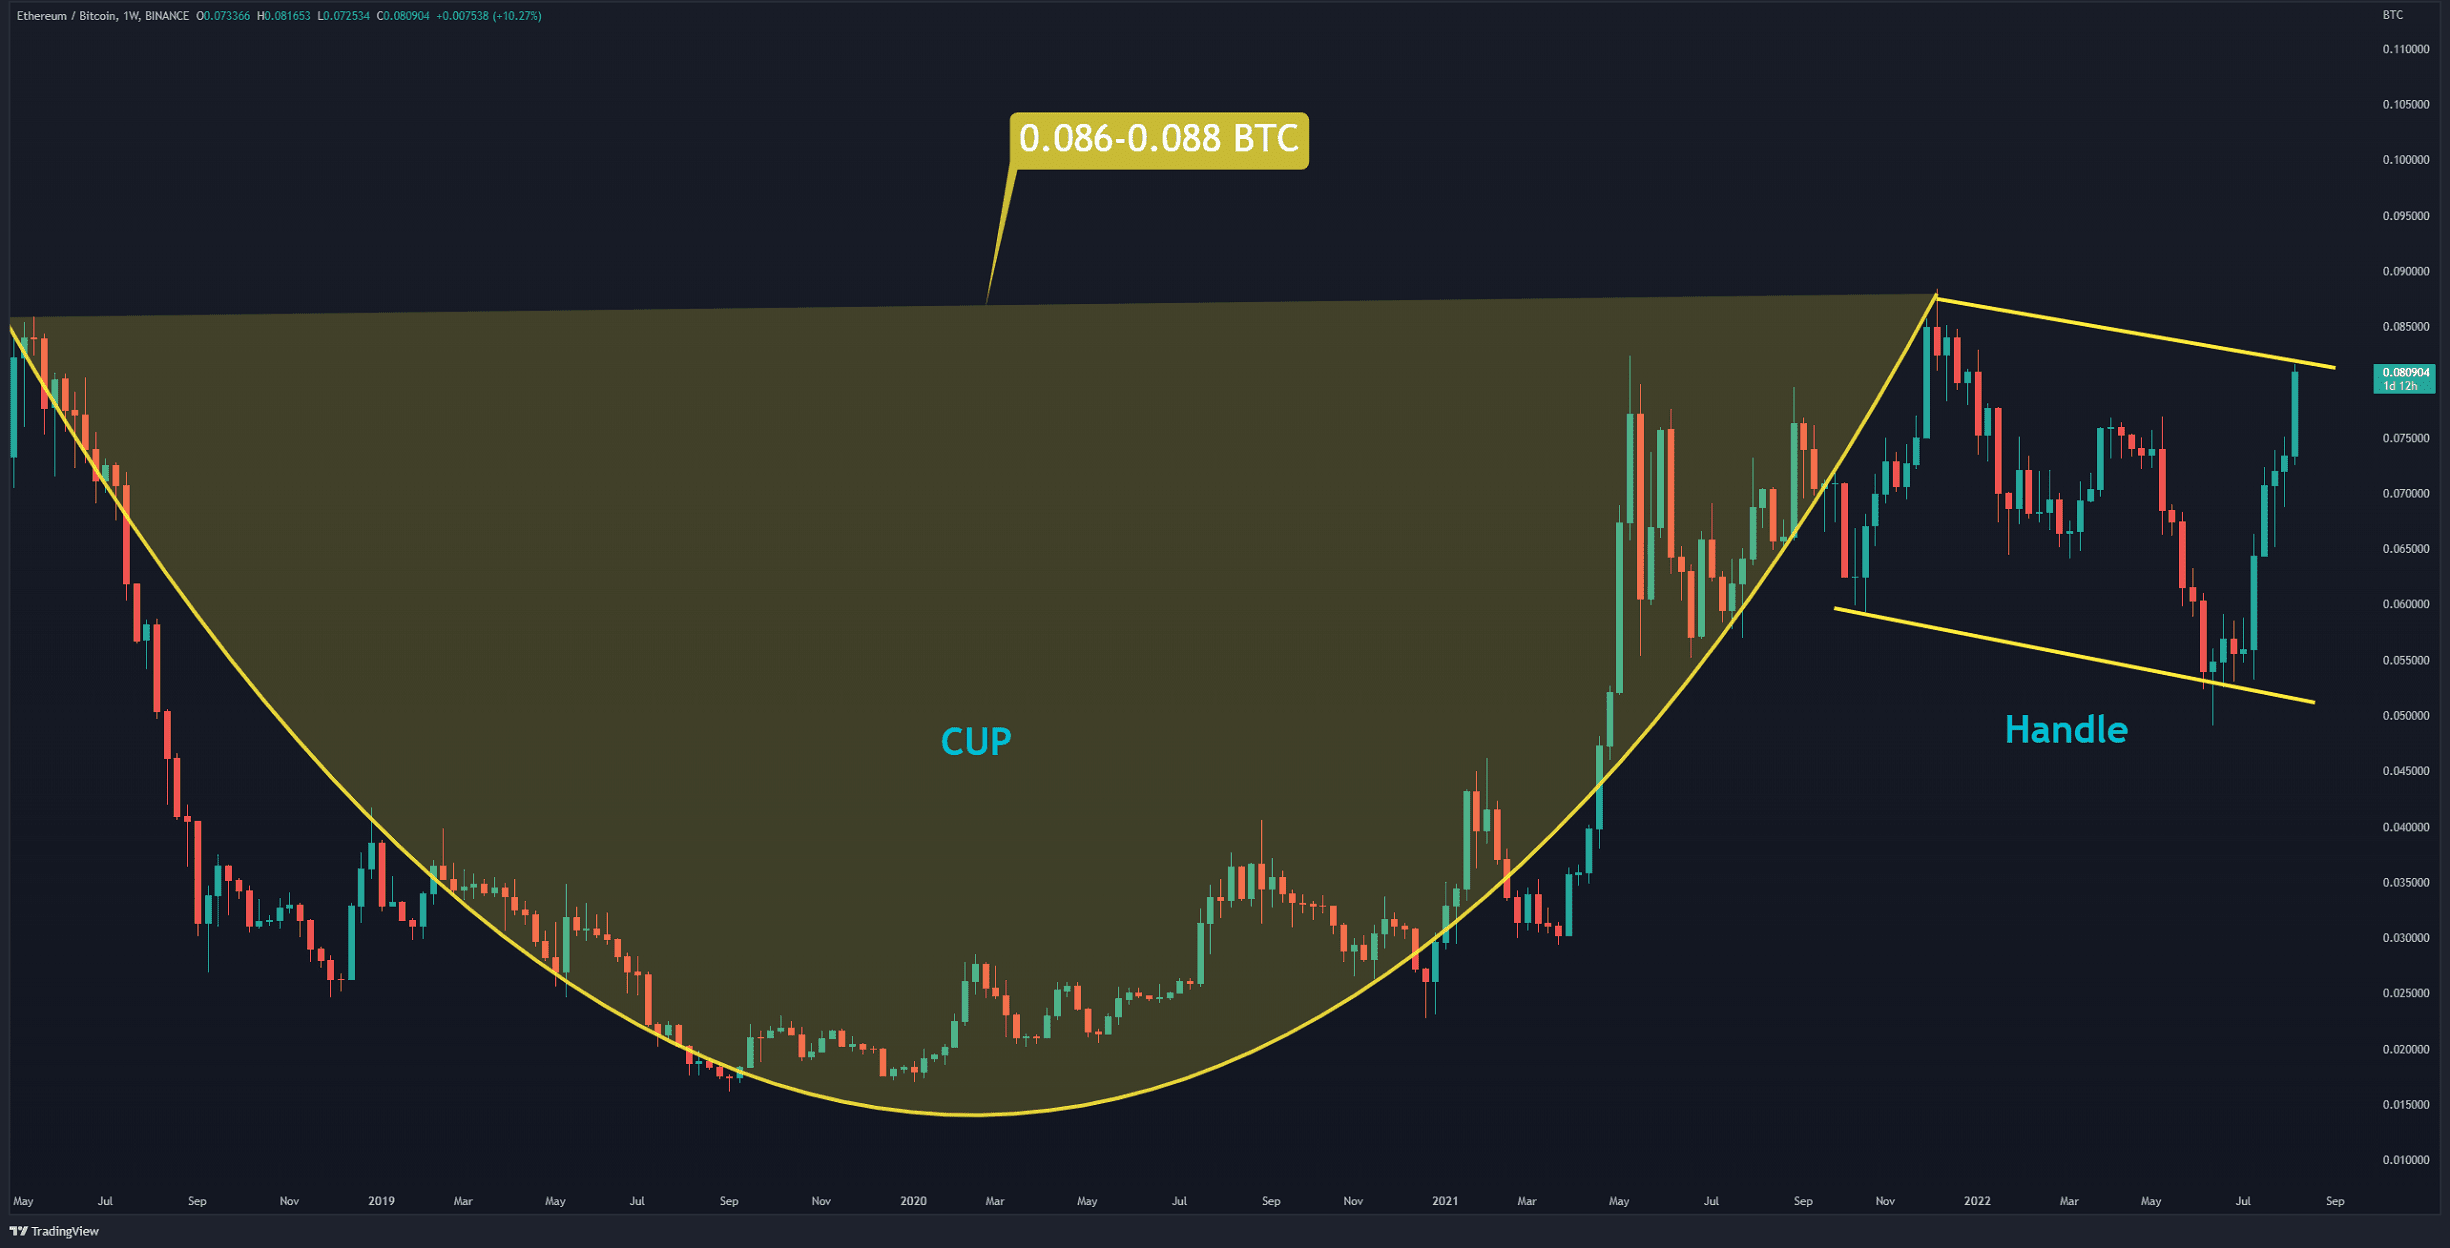
The ETH/BTC Chart
Against Bitcoin, the price is forming a cup and handle pattern (in yellow). The top of this pattern is in the range of 0.086 to 0.088 BTC. If the bulls can flip this level, it signals a bullish rally. Such a move can push ETH up to the target of 0.16 BTC. As long as the Ethereum fluctuates above 0.07 BTC, the bullish structure remains strong.
Key Support Levels: 0.0.75 & 0.07 BTC
Key Resistance Levels: 0.083 & 0.088 BTC