Ethereum has recently initiated a push and is currently confronting a significant resistance region. The price is consolidating, but a few other resistance levels could affect the short-term market outcome. Technical Analysis By Shayan The Daily Chart The 100-day and 50-day moving averages, standing at 60 and 20, prevent Ethereum’s price from going forward as it is currently consolidating below these levels with low volatility. A static resistance level at 00 has been pushing the price down over recent months. The price has also formed a descending price channel and is currently attempting to break the middle trendline. In light of these considerations, the 00-00 price region is currently the most vital resistance area, and a valid breakout should return the
Topics:
CryptoVizArt considers the following as important: ETH Analysis, ETHBTC, Ethereum (ETH) Price, ethusd
This could be interesting, too:
CryptoVizArt writes Will Weak Momentum Drive ETH to .5K? (Ethereum Price Analysis)
Jordan Lyanchev writes Bybit Hack Fallout: Arthur Hayes, Samson Mow Push for Ethereum Rollback
Mandy Williams writes Ethereum Key Metrics Point to Persistent Bullish Outlook for ETH: CryptoQuant
CryptoVizArt writes Ethereum Price Analysis: Following a 15% Weekly Crash, What’s Next for ETH?
Ethereum has recently initiated a push and is currently confronting a significant resistance region. The price is consolidating, but a few other resistance levels could affect the short-term market outcome.
Technical Analysis
By Shayan
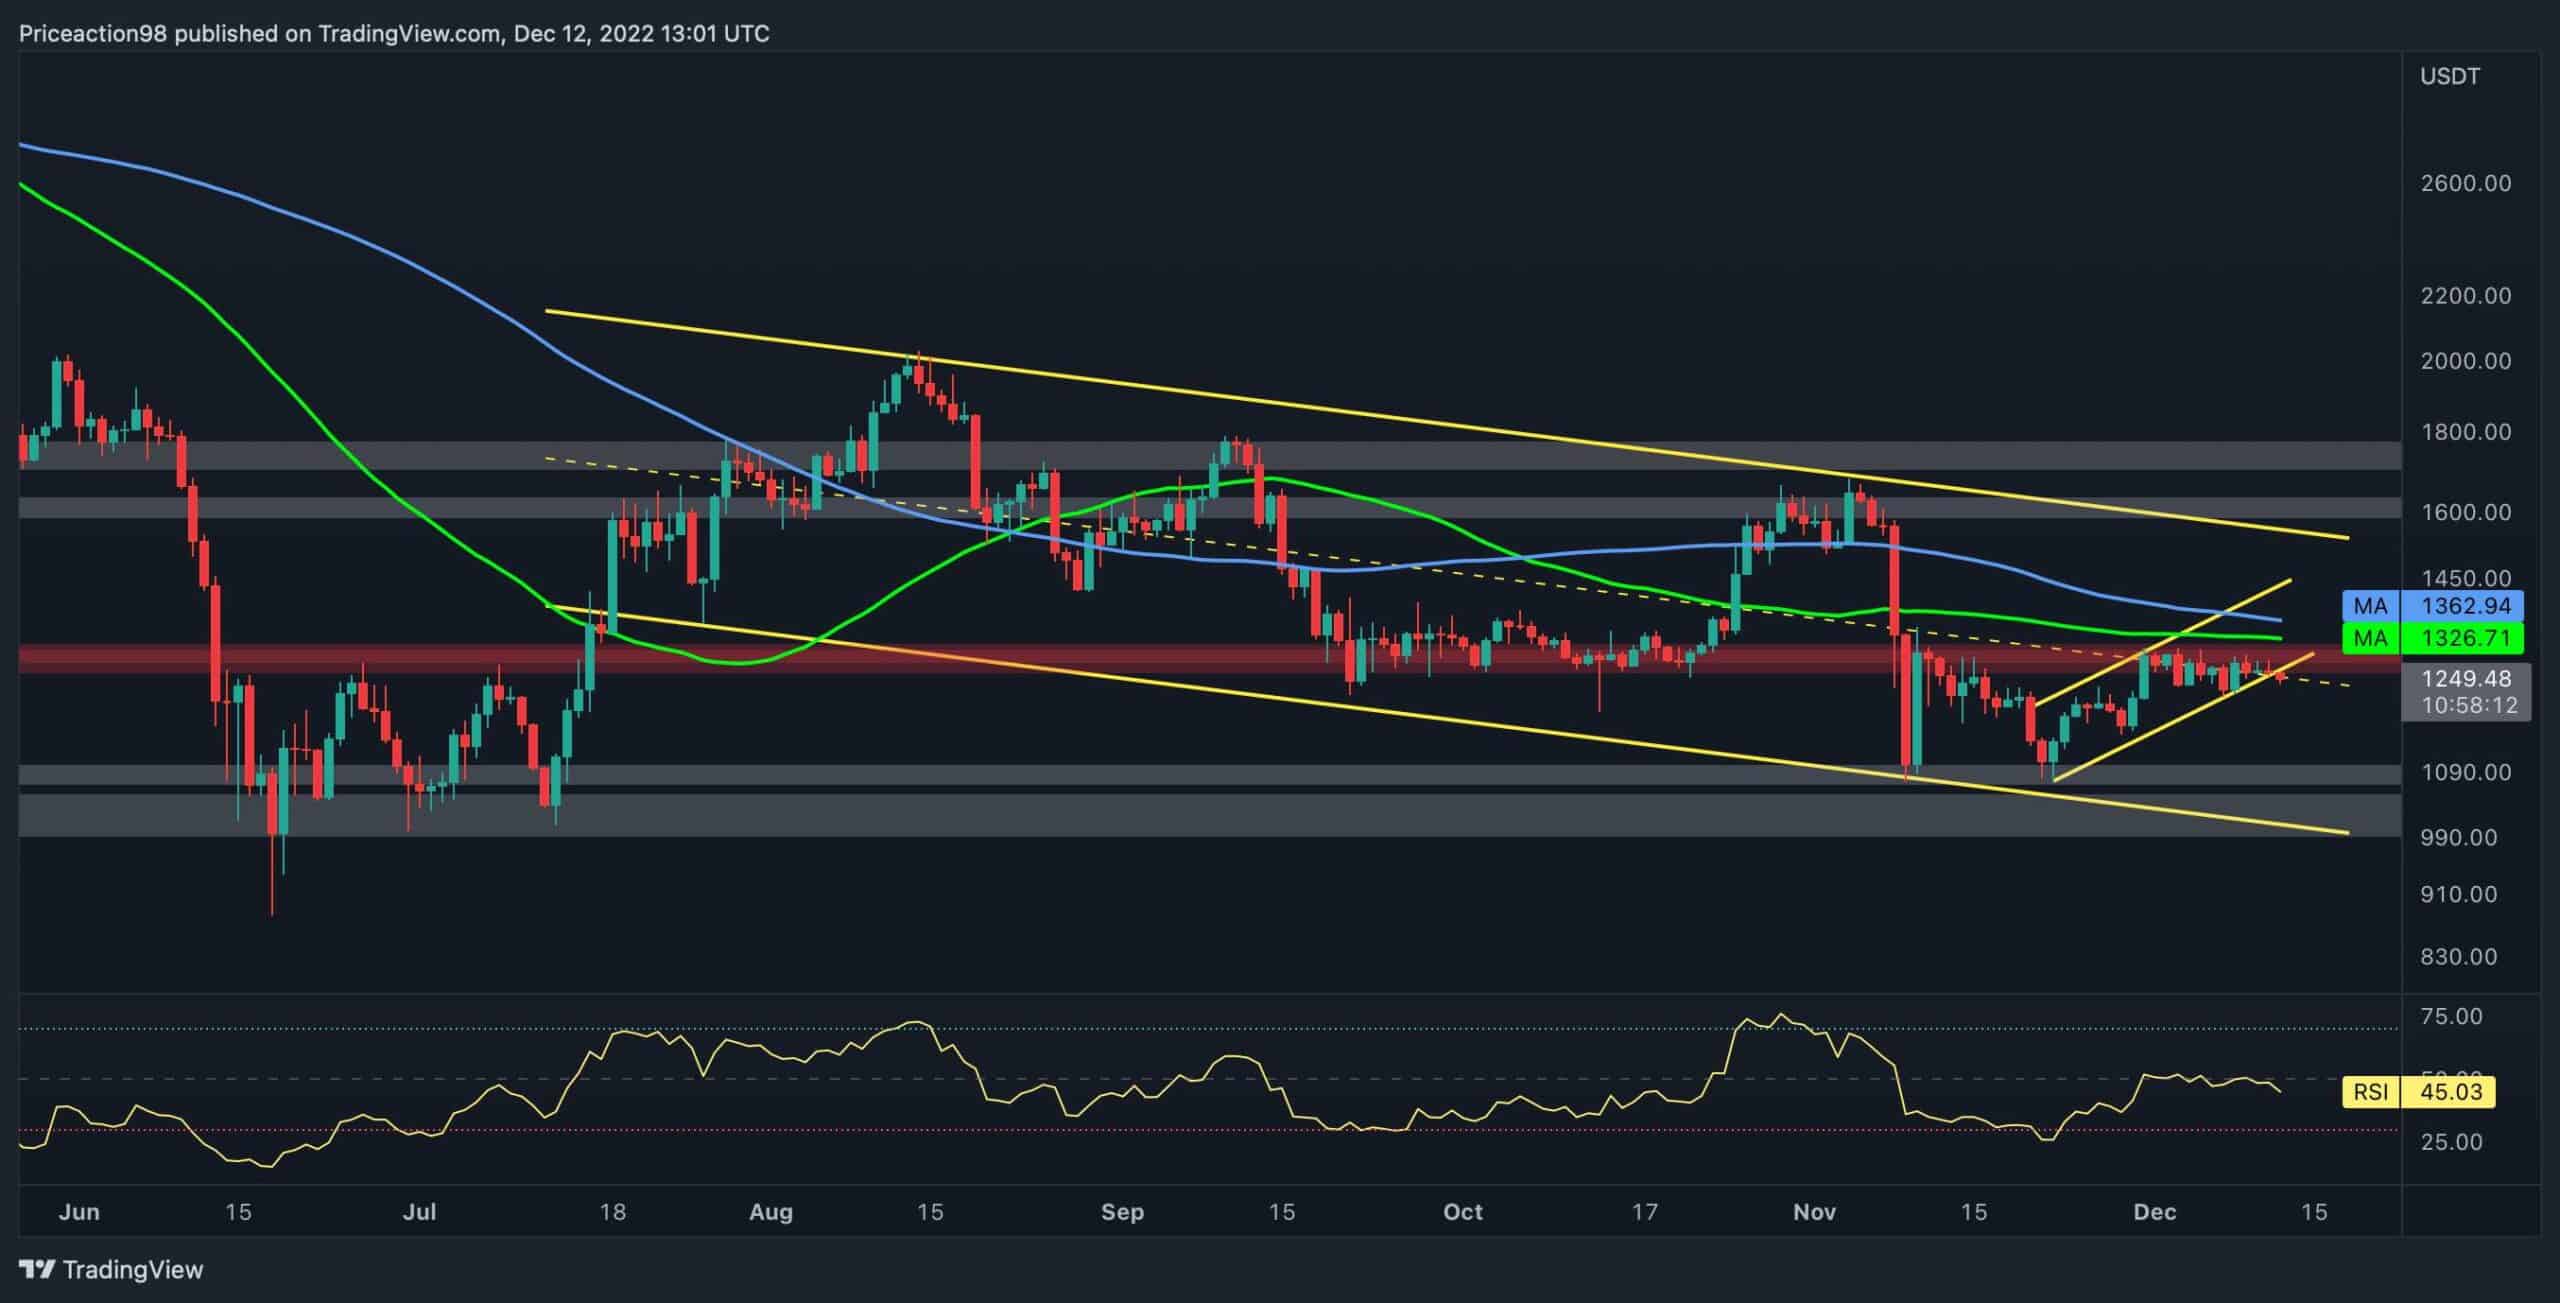
The Daily Chart
The 100-day and 50-day moving averages, standing at $1360 and $1320, prevent Ethereum’s price from going forward as it is currently consolidating below these levels with low volatility.
A static resistance level at $1300 has been pushing the price down over recent months. The price has also formed a descending price channel and is currently attempting to break the middle trendline.
In light of these considerations, the $1300-$1400 price region is currently the most vital resistance area, and a valid breakout should return the bullish sentiment and result in a fresh price spike.
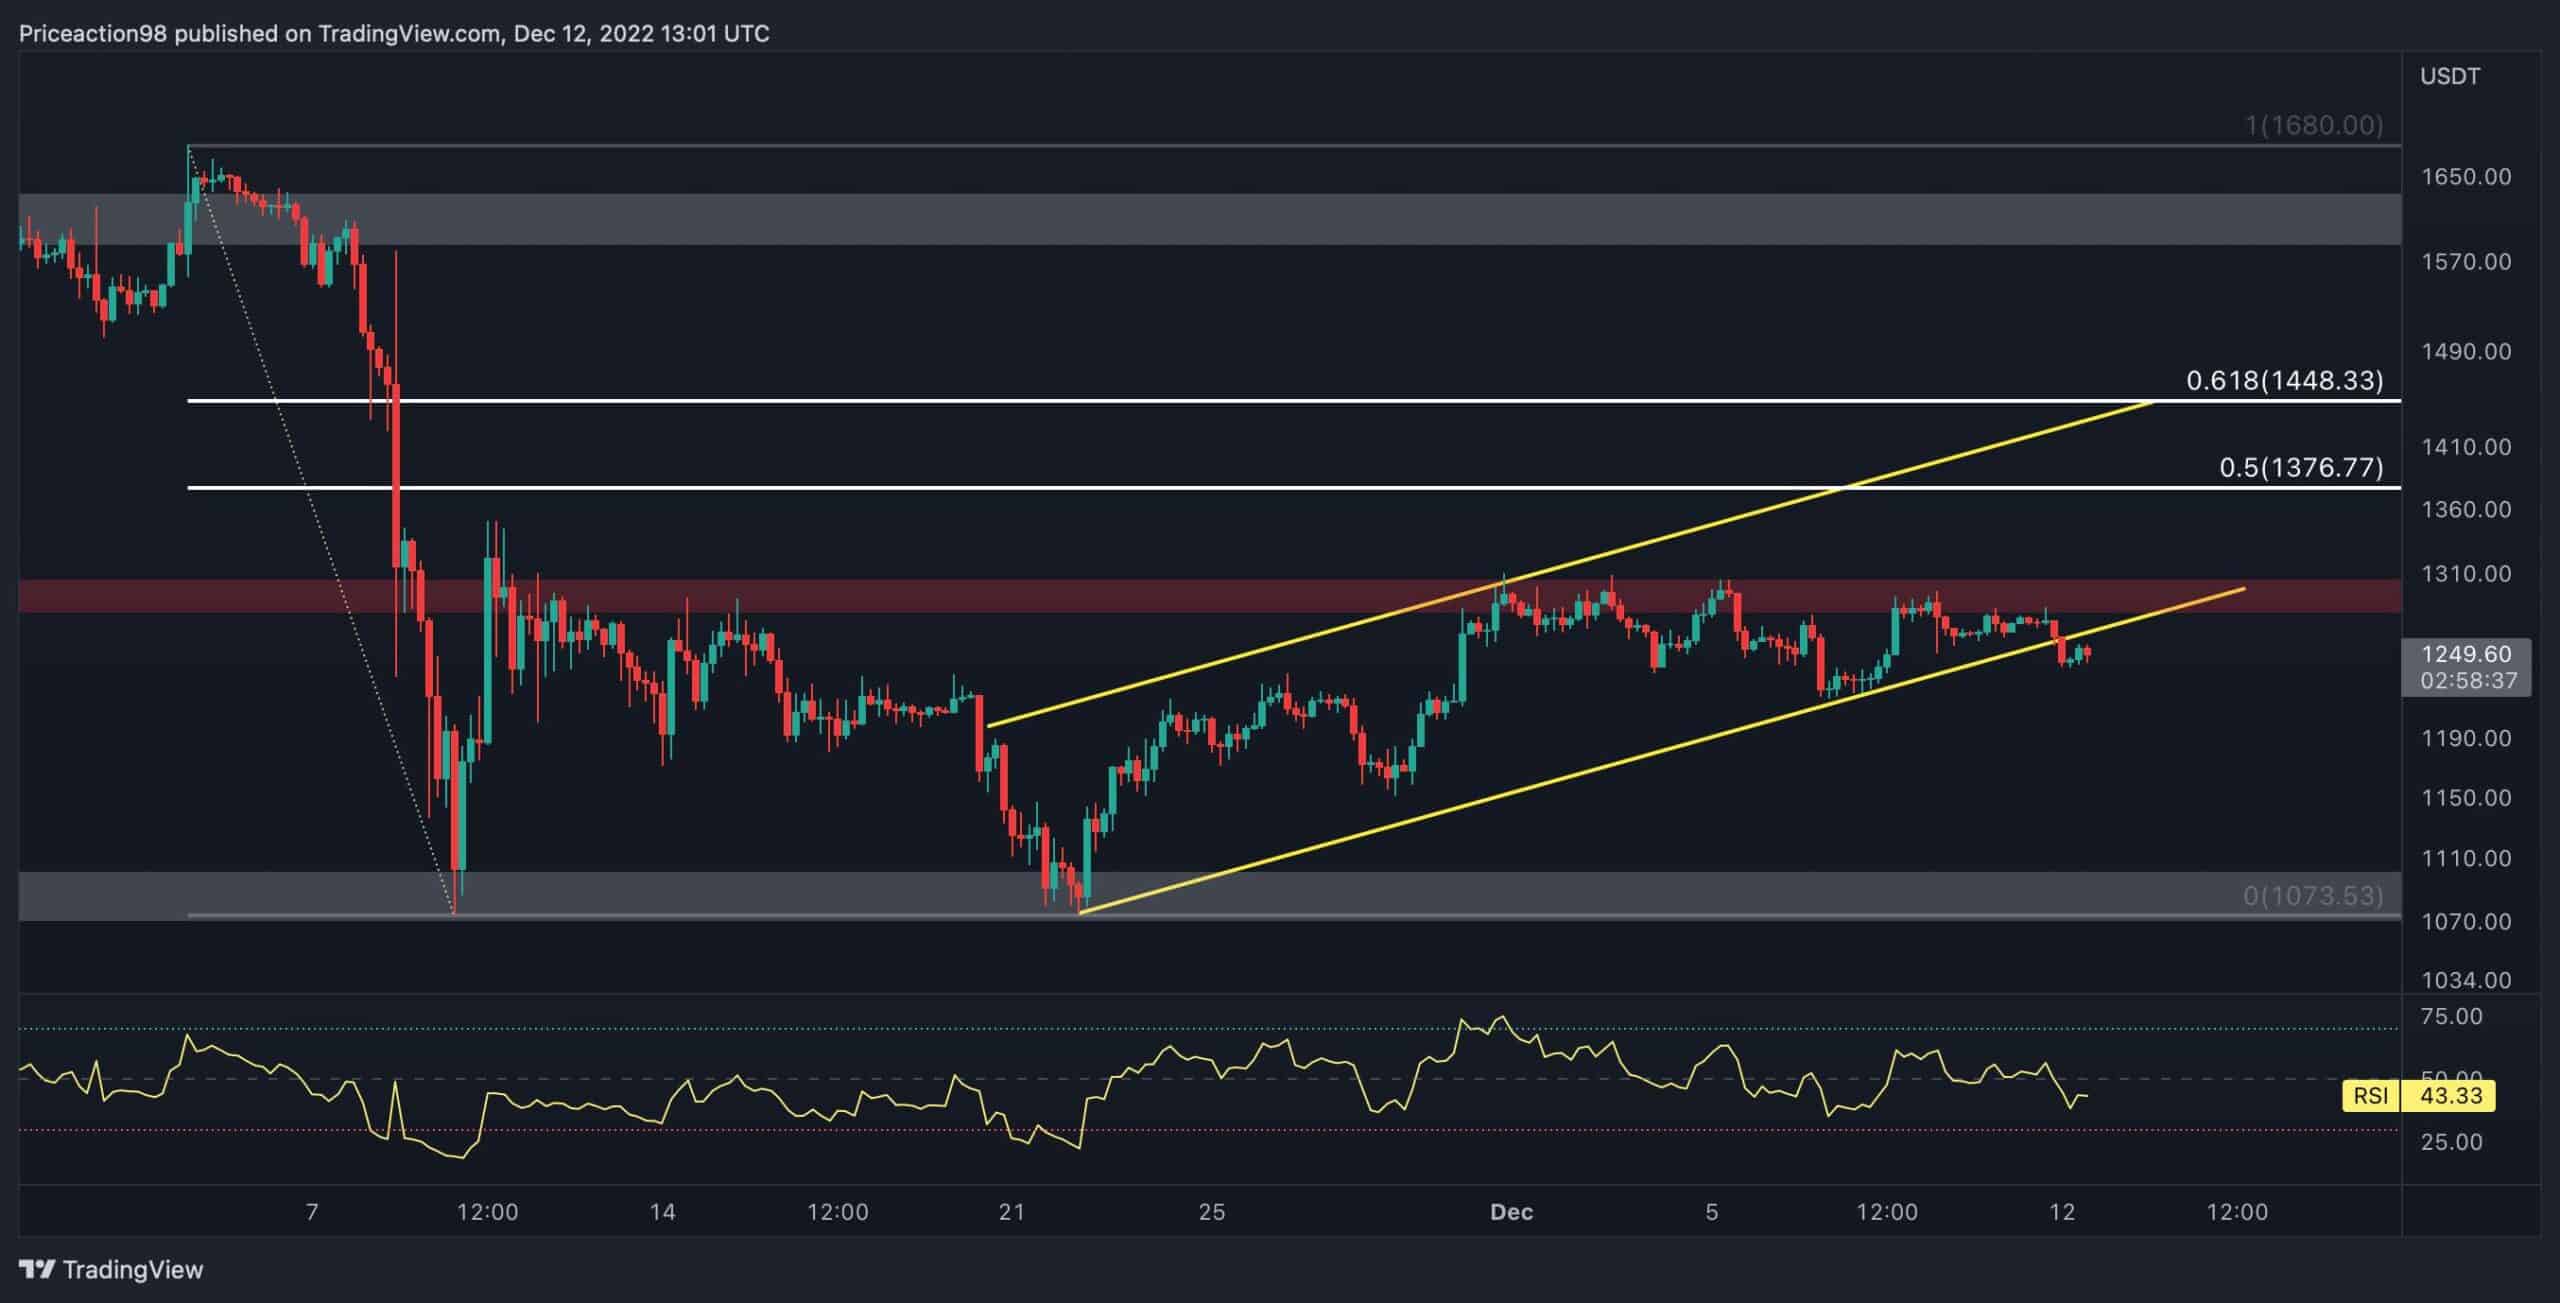
The 4-Hour Chart
On the 4-hour chart, the price has broken below the ascending channel that has been forming recently. The ascending channel is a well-known bearish reversal pattern and could result in a decline if the price fails to break back inside it in the coming days.
On the other hand, the price is facing a static resistance level of around $1300. If it breaks that level, the 0.5 and 0.618 Fib would be the next in line. These usually serve as powerful resistance in bearish trends and have the potential to halt the rally.
Overall, the market is facing a concerning lack of demand, which increases the chances of a bearish reversal at the current level and a plunge toward the $1K level.