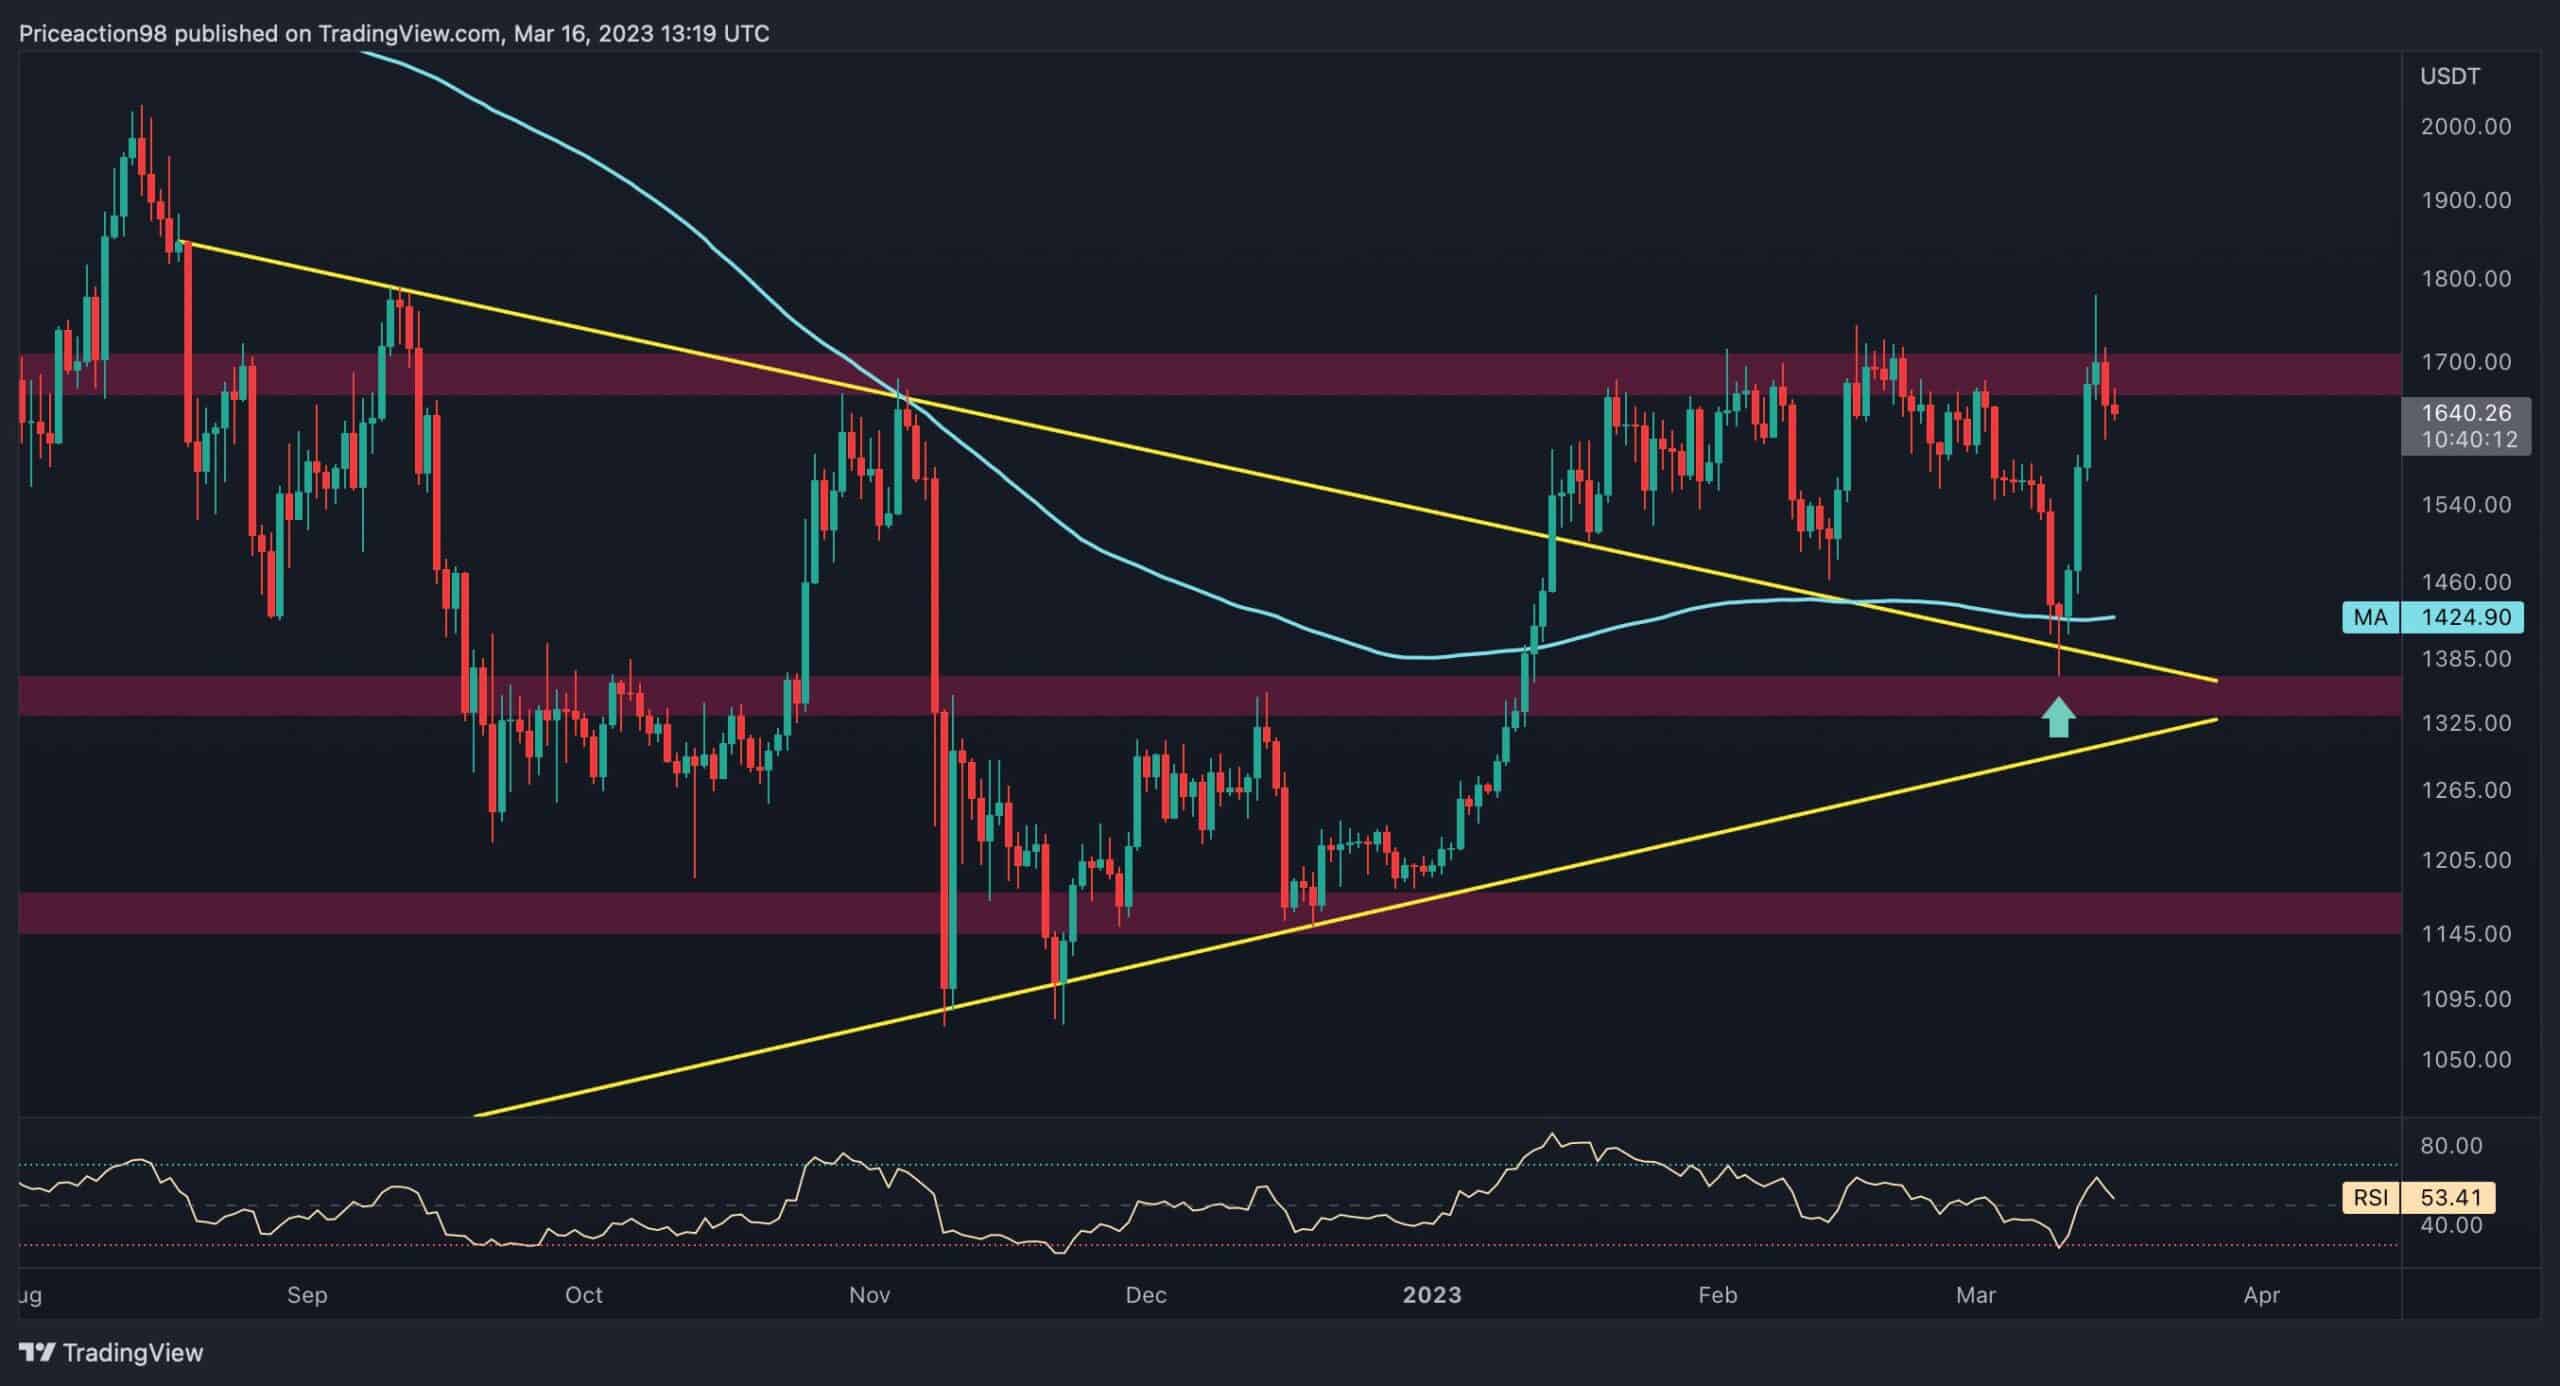
The cryptocurrency market experienced another bullish rally after a short-term price decline. Ethereum was no exception as the price surged, forming a new swing high and currently facing a significant resistance region. Technical Analysis By Shayan The Daily Chart After a short-term decline toward the broken triangle pattern and the 200-day moving average, Ethereum found support and initiated a bullish rally, completing the pullback to the broken level. After printing three consecutive powerful bullish daily candles, the price reached .7K crucial resistance region and formed a higher high pattern at 80. This indicates that the trend is bullish. Nevertheless, the .7K region acts as a significant resistance and has rejected the price several times. If ETH surpasses
Topics:
CryptoVizArt considers the following as important: ETH Analysis, ETHBTC, Ethereum (ETH) Price, ethusd
This could be interesting, too:
CryptoVizArt writes Will Weak Momentum Drive ETH to .5K? (Ethereum Price Analysis)
Jordan Lyanchev writes Bybit Hack Fallout: Arthur Hayes, Samson Mow Push for Ethereum Rollback
Mandy Williams writes Ethereum Key Metrics Point to Persistent Bullish Outlook for ETH: CryptoQuant
CryptoVizArt writes Ethereum Price Analysis: Following a 15% Weekly Crash, What’s Next for ETH?
The cryptocurrency market experienced another bullish rally after a short-term price decline. Ethereum was no exception as the price surged, forming a new swing high and currently facing a significant resistance region.
Technical Analysis
By Shayan
The Daily Chart
After a short-term decline toward the broken triangle pattern and the 200-day moving average, Ethereum found support and initiated a bullish rally, completing the pullback to the broken level.
After printing three consecutive powerful bullish daily candles, the price reached $1.7K crucial resistance region and formed a higher high pattern at $1780. This indicates that the trend is bullish.
Nevertheless, the $1.7K region acts as a significant resistance and has rejected the price several times. If ETH surpasses the mentioned level, an impulsive rally will be imminent.
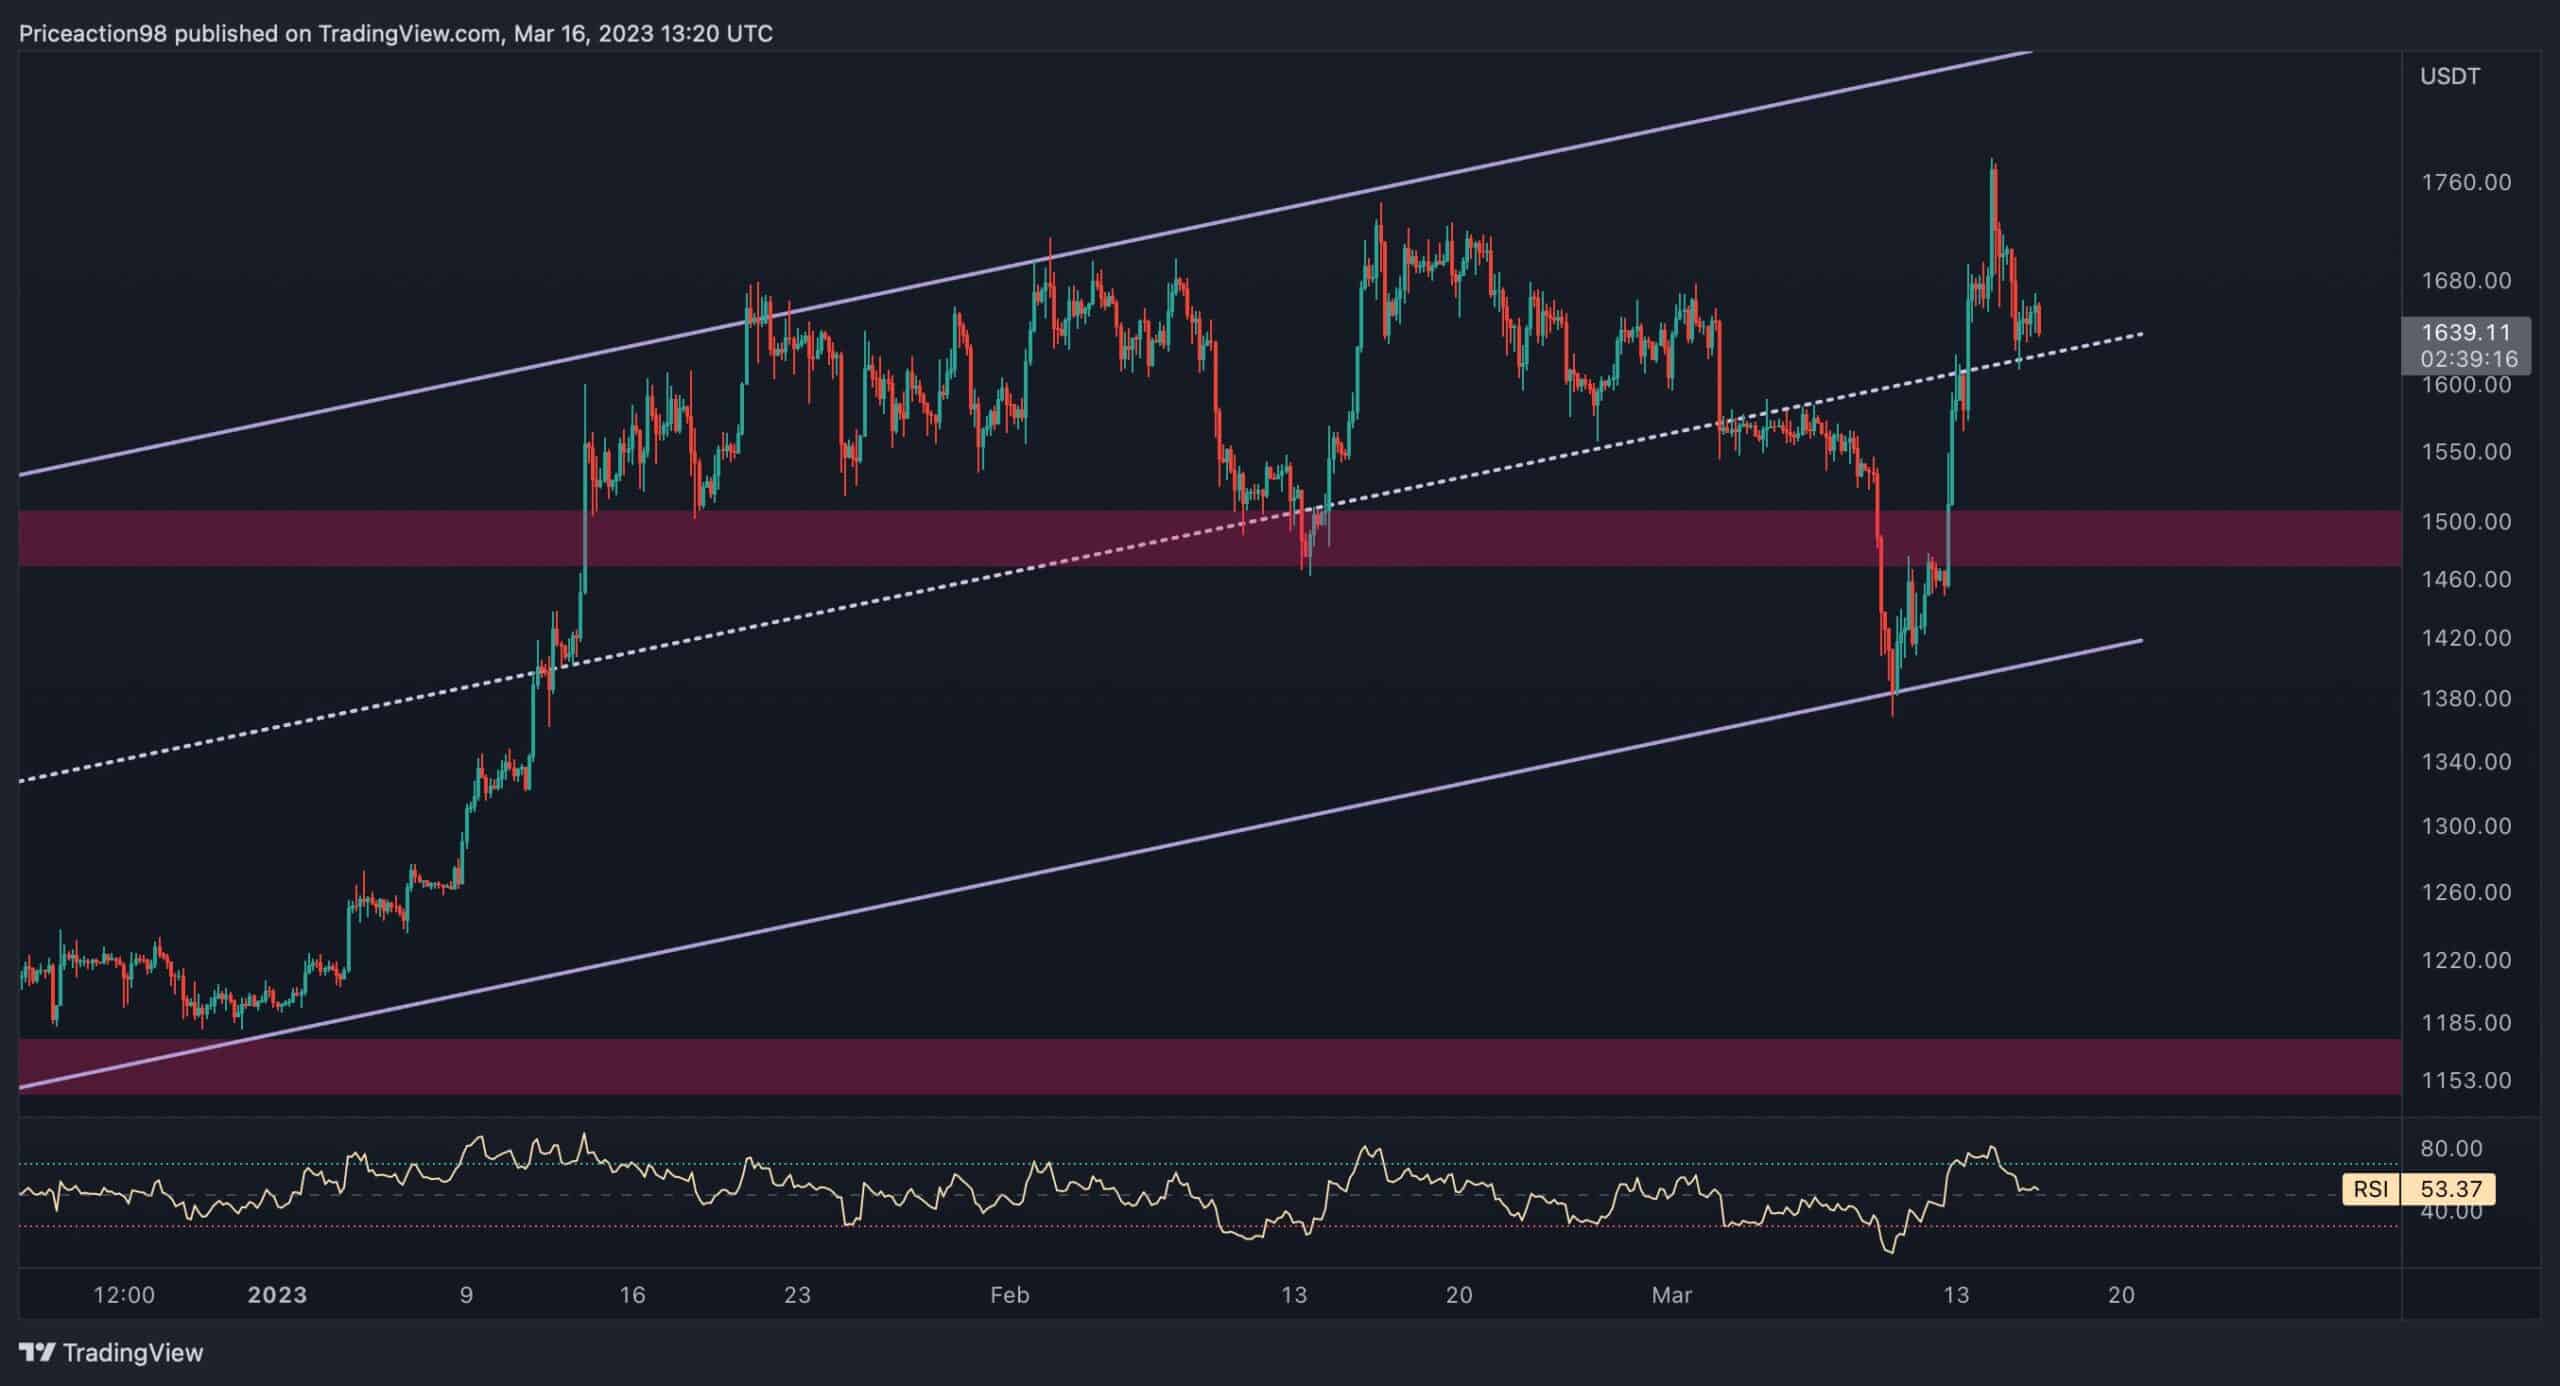
The 4-Hour Chart
The price reversal is more evident on the 4-hour timeframe chart. Ethereum’s decline was halted after reaching the ascending channel’s lower trendline at $1350, resulting in a massive price surge.
However, the price is currently struggling with the channel’s middle boundary, roughly $1640. In case it drops below the trendline, ETH might face a stage of consolidation with a slight decline in price.
On the other hand, if the price finds support at this level, it will likely start a rally to claim the $1.7K level.
On-chain Analysis
By Edris
Ethereum Taker Buy Sell Ratio (SMA 100)
The Taker Buy Sell Ratio measures whether the bulls or the bears are currently executing their trades more aggressively. Values above one indicate dominant buying pressure, while values below 1 are associated with negative sentiment.
This metric has been on the decline over the last few weeks and has dropped below 1 recently.
This behavior indicates that the bears are currently more aggressive, and futures market sentiment has turned bearish, which could result in a decline in the short term.
In case the Taker Buy Sell ratio drops further, the market could enter another bearish phase, and the bear market could be further elongated.
