Despite the ongoing bearish sentiment among market participants following the recent turmoil of SVB bank and its effect on USDC, Ethereum’s price has found substantial support amid the 50 price range. The upcoming days will be crucial to see whether ETH can hold the critical level or continue its negative sentiment. Technical Analysis By Shayan The Daily Chart After breaking above the upper trend-line of the symmetrical triangle and consolidating for an extended period, the price of Ethereum has declined and is currently retesting the previous breakout level at 50. If ETH sustains this level, traders can expect another bullish leg toward the crucial resistance level of 00K. However, if the price drops below the trend line, a plunge toward the .2K support level
Topics:
CryptoVizArt considers the following as important: ETH Analysis, ETHBTC, Ethereum (ETH) Price, ethusd
This could be interesting, too:
Mandy Williams writes Ethereum Derivatives Metrics Signal Modest Downside Tail Risk Ahead: Nansen
Jordan Lyanchev writes Weekly Bitcoin, Ethereum ETF Recap: Light at the End of the Tunnel for BTC
CryptoVizArt writes Will Weak Momentum Drive ETH to .5K? (Ethereum Price Analysis)
Jordan Lyanchev writes Bybit Hack Fallout: Arthur Hayes, Samson Mow Push for Ethereum Rollback
Despite the ongoing bearish sentiment among market participants following the recent turmoil of SVB bank and its effect on USDC, Ethereum’s price has found substantial support amid the $1450 price range.
The upcoming days will be crucial to see whether ETH can hold the critical level or continue its negative sentiment.
Technical Analysis
By Shayan
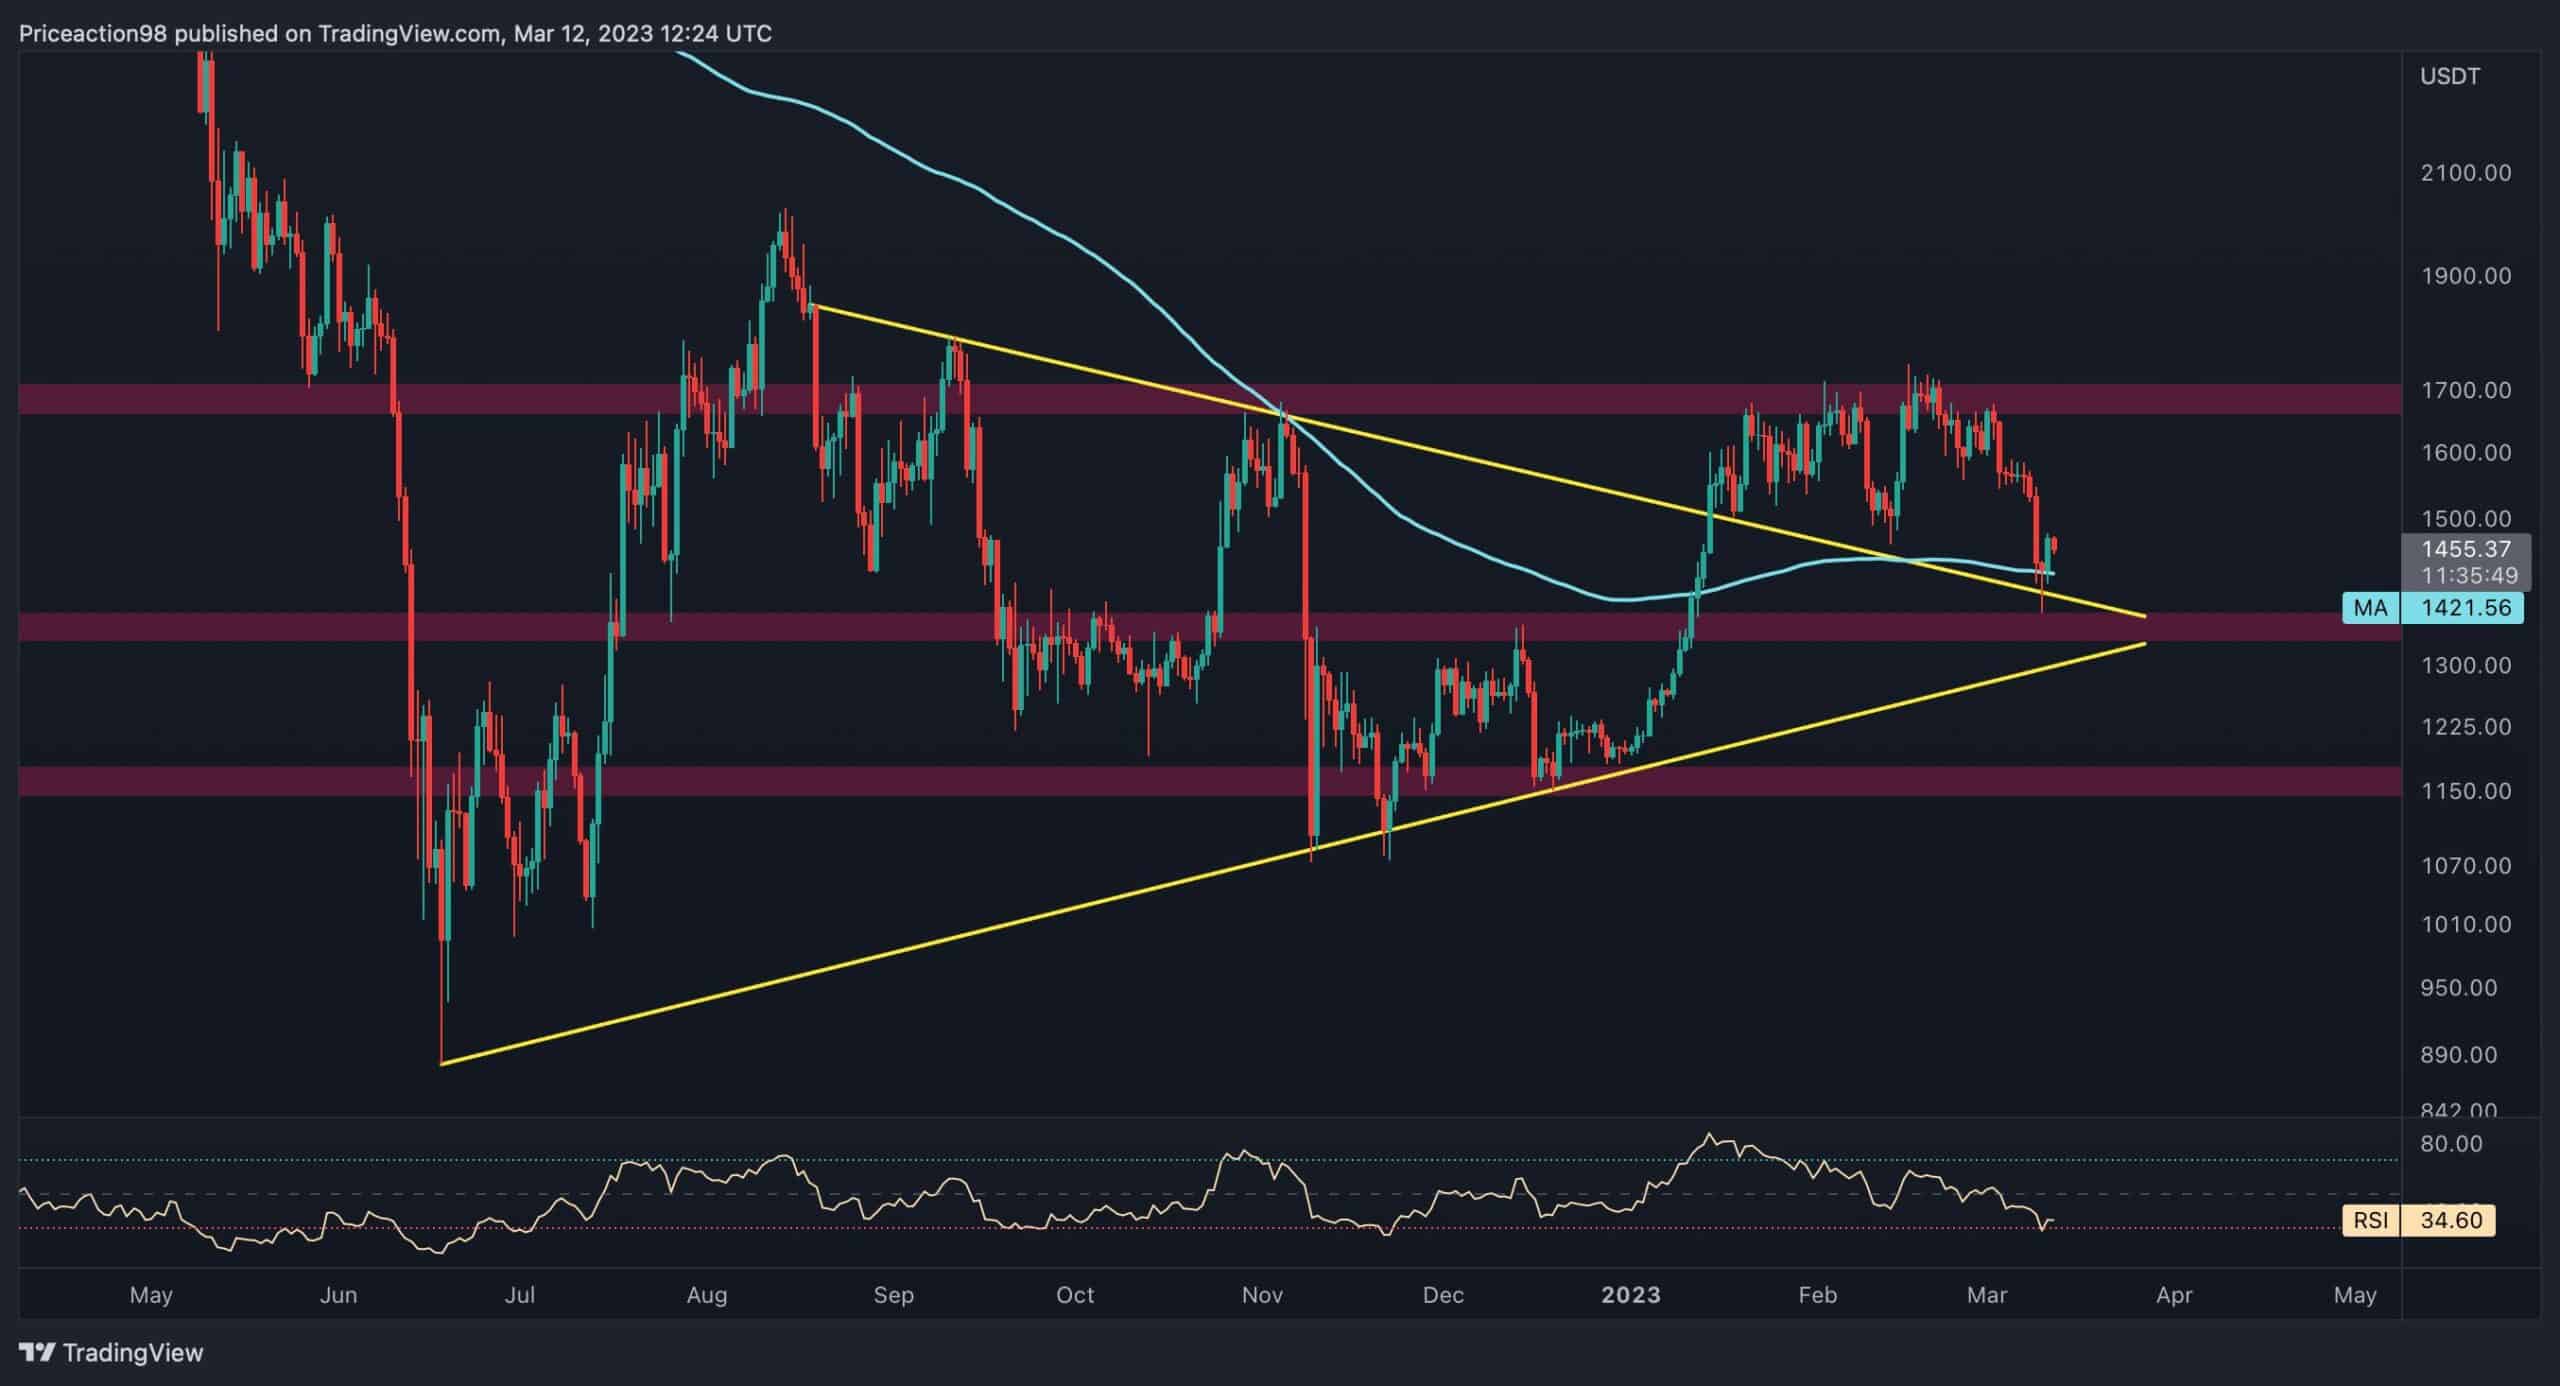
The Daily Chart
After breaking above the upper trend-line of the symmetrical triangle and consolidating for an extended period, the price of Ethereum has declined and is currently retesting the previous breakout level at $1450.
If ETH sustains this level, traders can expect another bullish leg toward the crucial resistance level of $1700K.
However, if the price drops below the trend line, a plunge toward the $1.2K support level may be imminent. Nevertheless, the upper trend-line of the triangle aligns with the 200-day moving average at $1450, providing a solid support level.
The 4-Hour Chart
The price of ETH has been following an ascending price channel (as shown below). However, it recently dropped below the middle equilibrium line, resulting in a cascade. Nevertheless, the price has now reached the channel’s lower boundary, temporarily finding support.
The price is ‘stuck’ in a tight range between the lower threshold at roughly $1410 and the static resistance region at $1500. ETH is likely to break out of this range in the coming days, and the direction of the breakout will determine the direction of the next short-term for ETH.

By Shayan
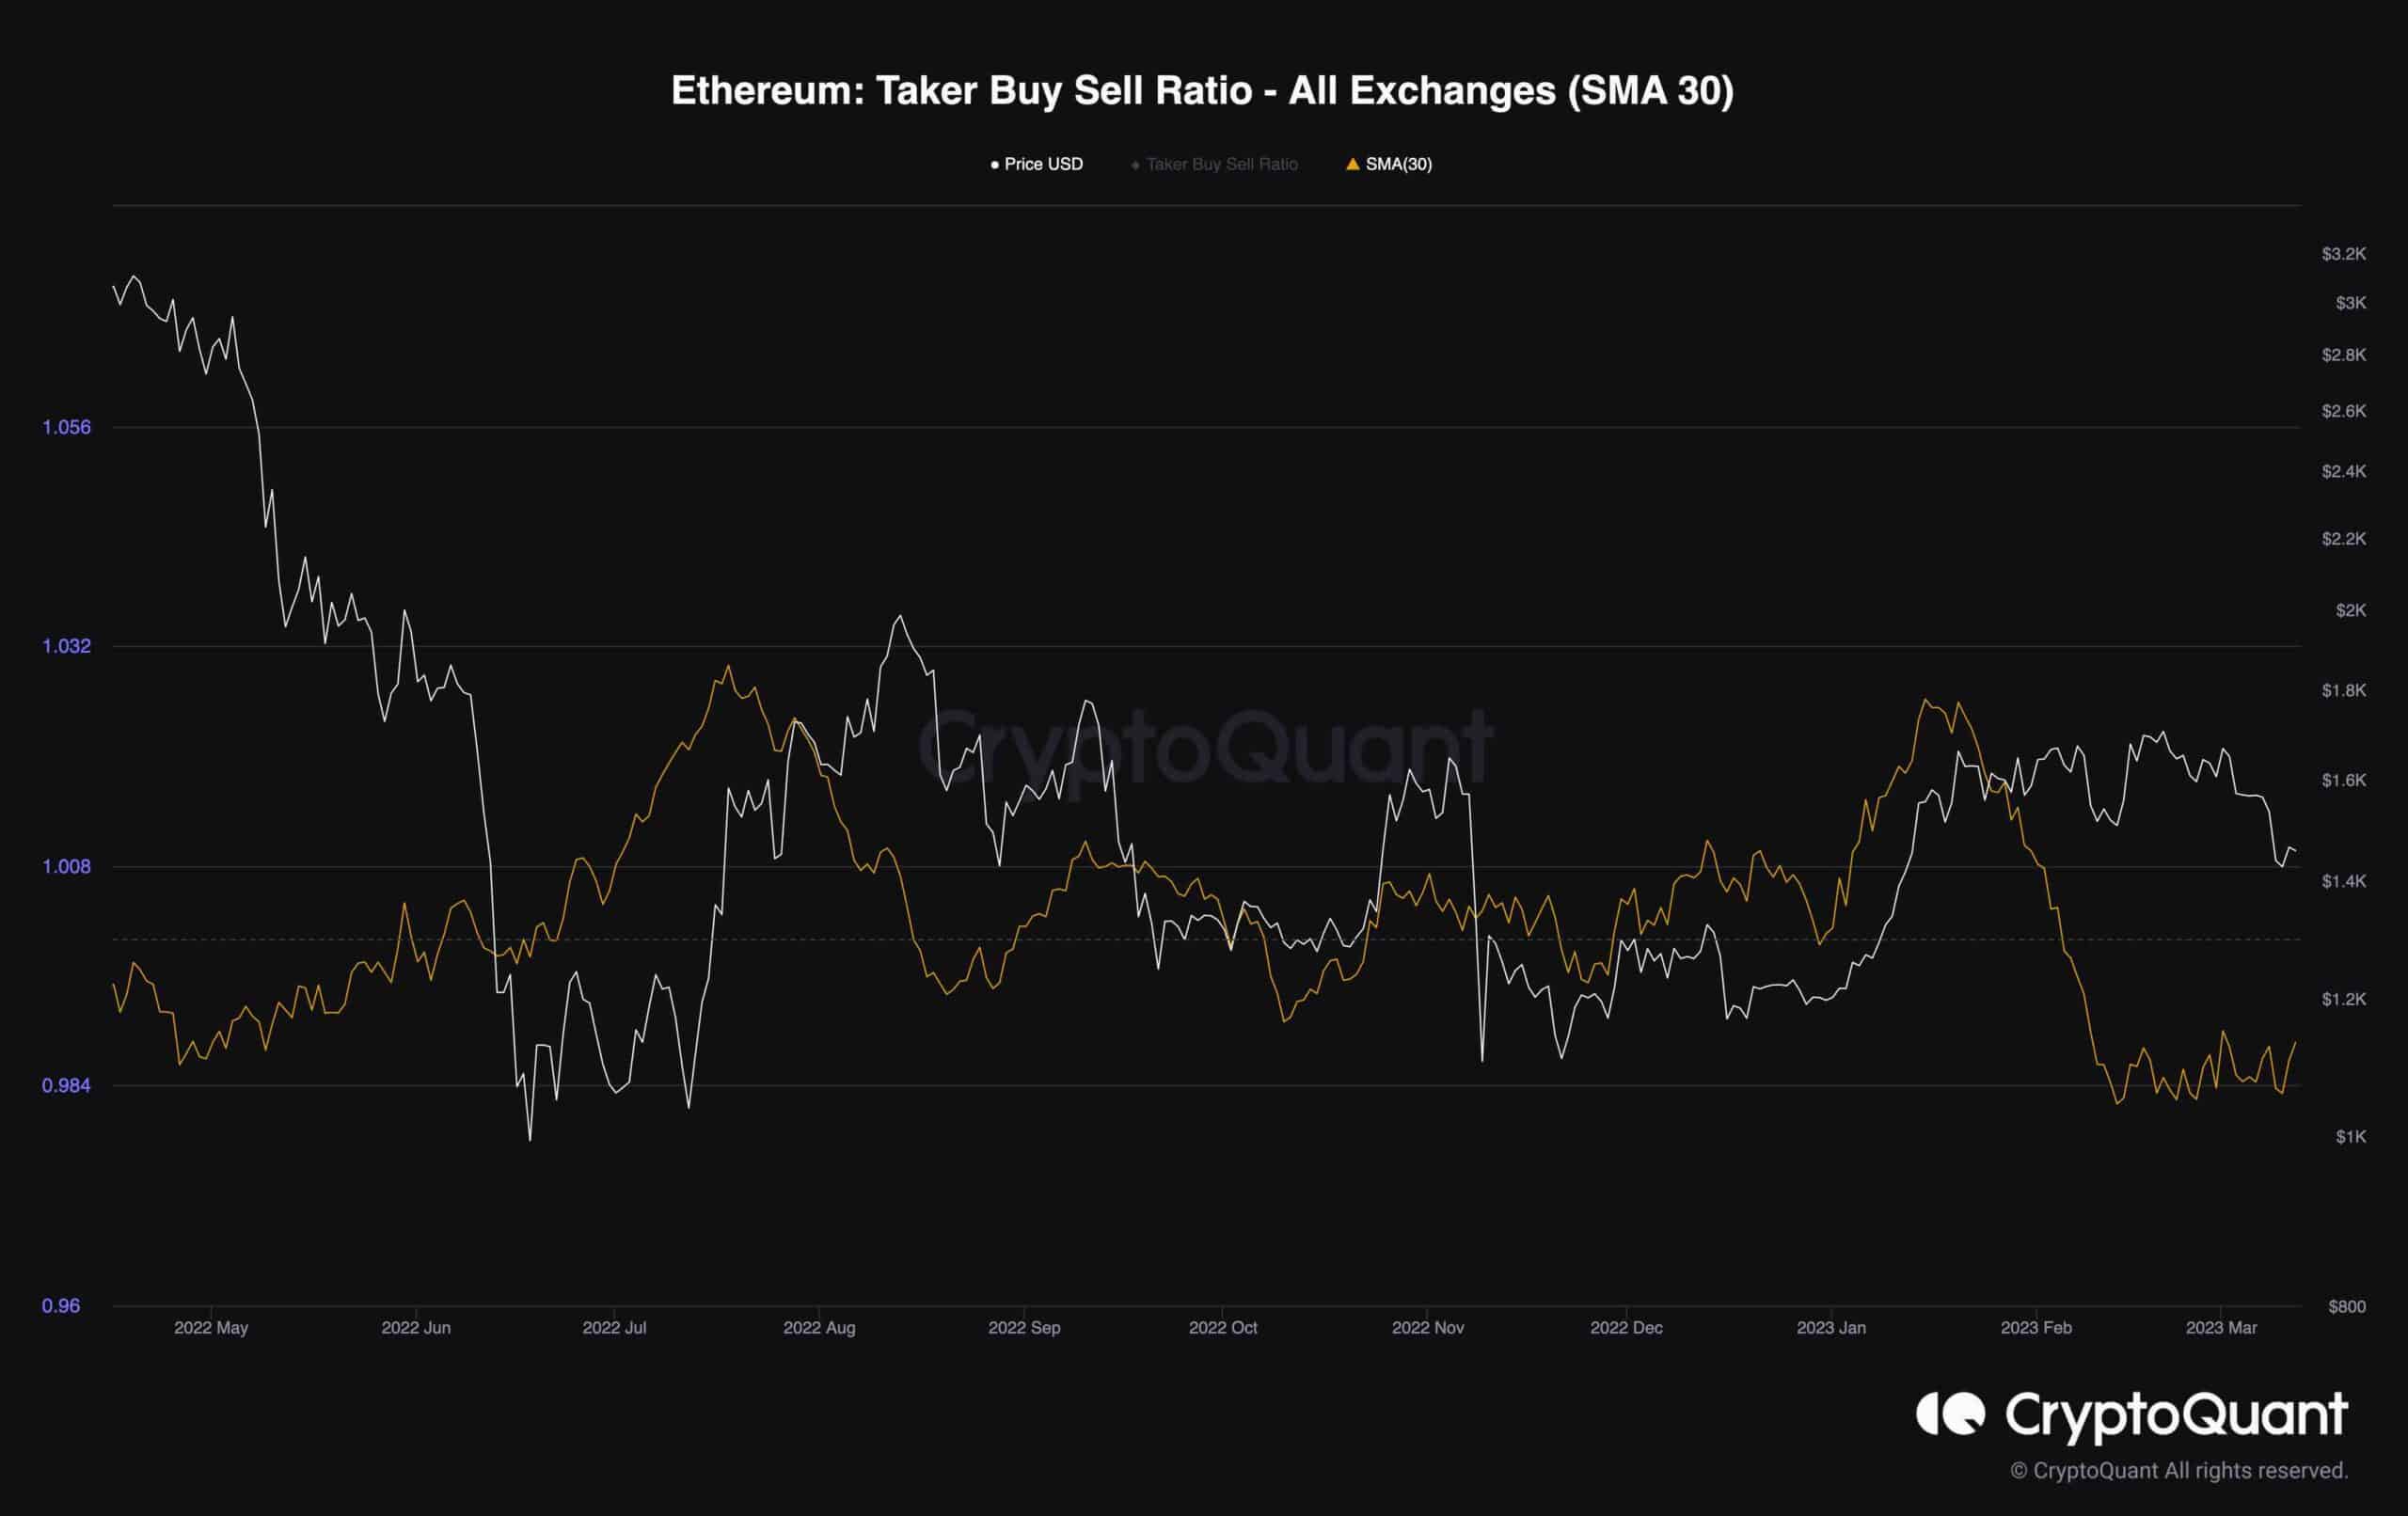
The Taker Buy/Sell Ratio is an indicator that helps understand market sentiment by indicating whether there is more buying or selling activity.
During ETH’s recent bullish leg, we observed a spike in this metric, confirming a positive market sentiment. However, when the price entered a consolidation phase and declined significantly after that, the metric dropped below one, indicating a change to a strong bearish sentiment.
Consequently, the metric plummeted to a new multi-month low, suggesting that the market is unlikely to enter a bullish stage unless the metric reclaims a value above one.