After facing rejection from the formidable resistance zone at .6K, Ethereum underwent a substantial downturn, breaking through multiple critical support levels. However, it has now landed at a substantial and decisive range, suggesting the possibility of a bullish reversal. By Shayan Ethereum Price Analysis: The Daily Chart A detailed analysis of Ethereum’s daily chart reveals a notable rejection after attempting to surpass the .6K resistance, resulting in a 20% decline. Concurrently, the price breached two vital support zones, the upper boundary of the multi-month ascending wedge and the lower boundary of the short-term expanding wedge, signaling prevalent selling pressure in the market. This negative sentiment is further underscored by a significant bearish
Topics:
CryptoVizArt considers the following as important: ETH Analysis, ETHBTC, Ethereum (ETH) Price, ethusd
This could be interesting, too:
CryptoVizArt writes Will Weak Momentum Drive ETH to .5K? (Ethereum Price Analysis)
Jordan Lyanchev writes Bybit Hack Fallout: Arthur Hayes, Samson Mow Push for Ethereum Rollback
Mandy Williams writes Ethereum Key Metrics Point to Persistent Bullish Outlook for ETH: CryptoQuant
CryptoVizArt writes Ethereum Price Analysis: Following a 15% Weekly Crash, What’s Next for ETH?
After facing rejection from the formidable resistance zone at $2.6K, Ethereum underwent a substantial downturn, breaking through multiple critical support levels.
However, it has now landed at a substantial and decisive range, suggesting the possibility of a bullish reversal.
By Shayan
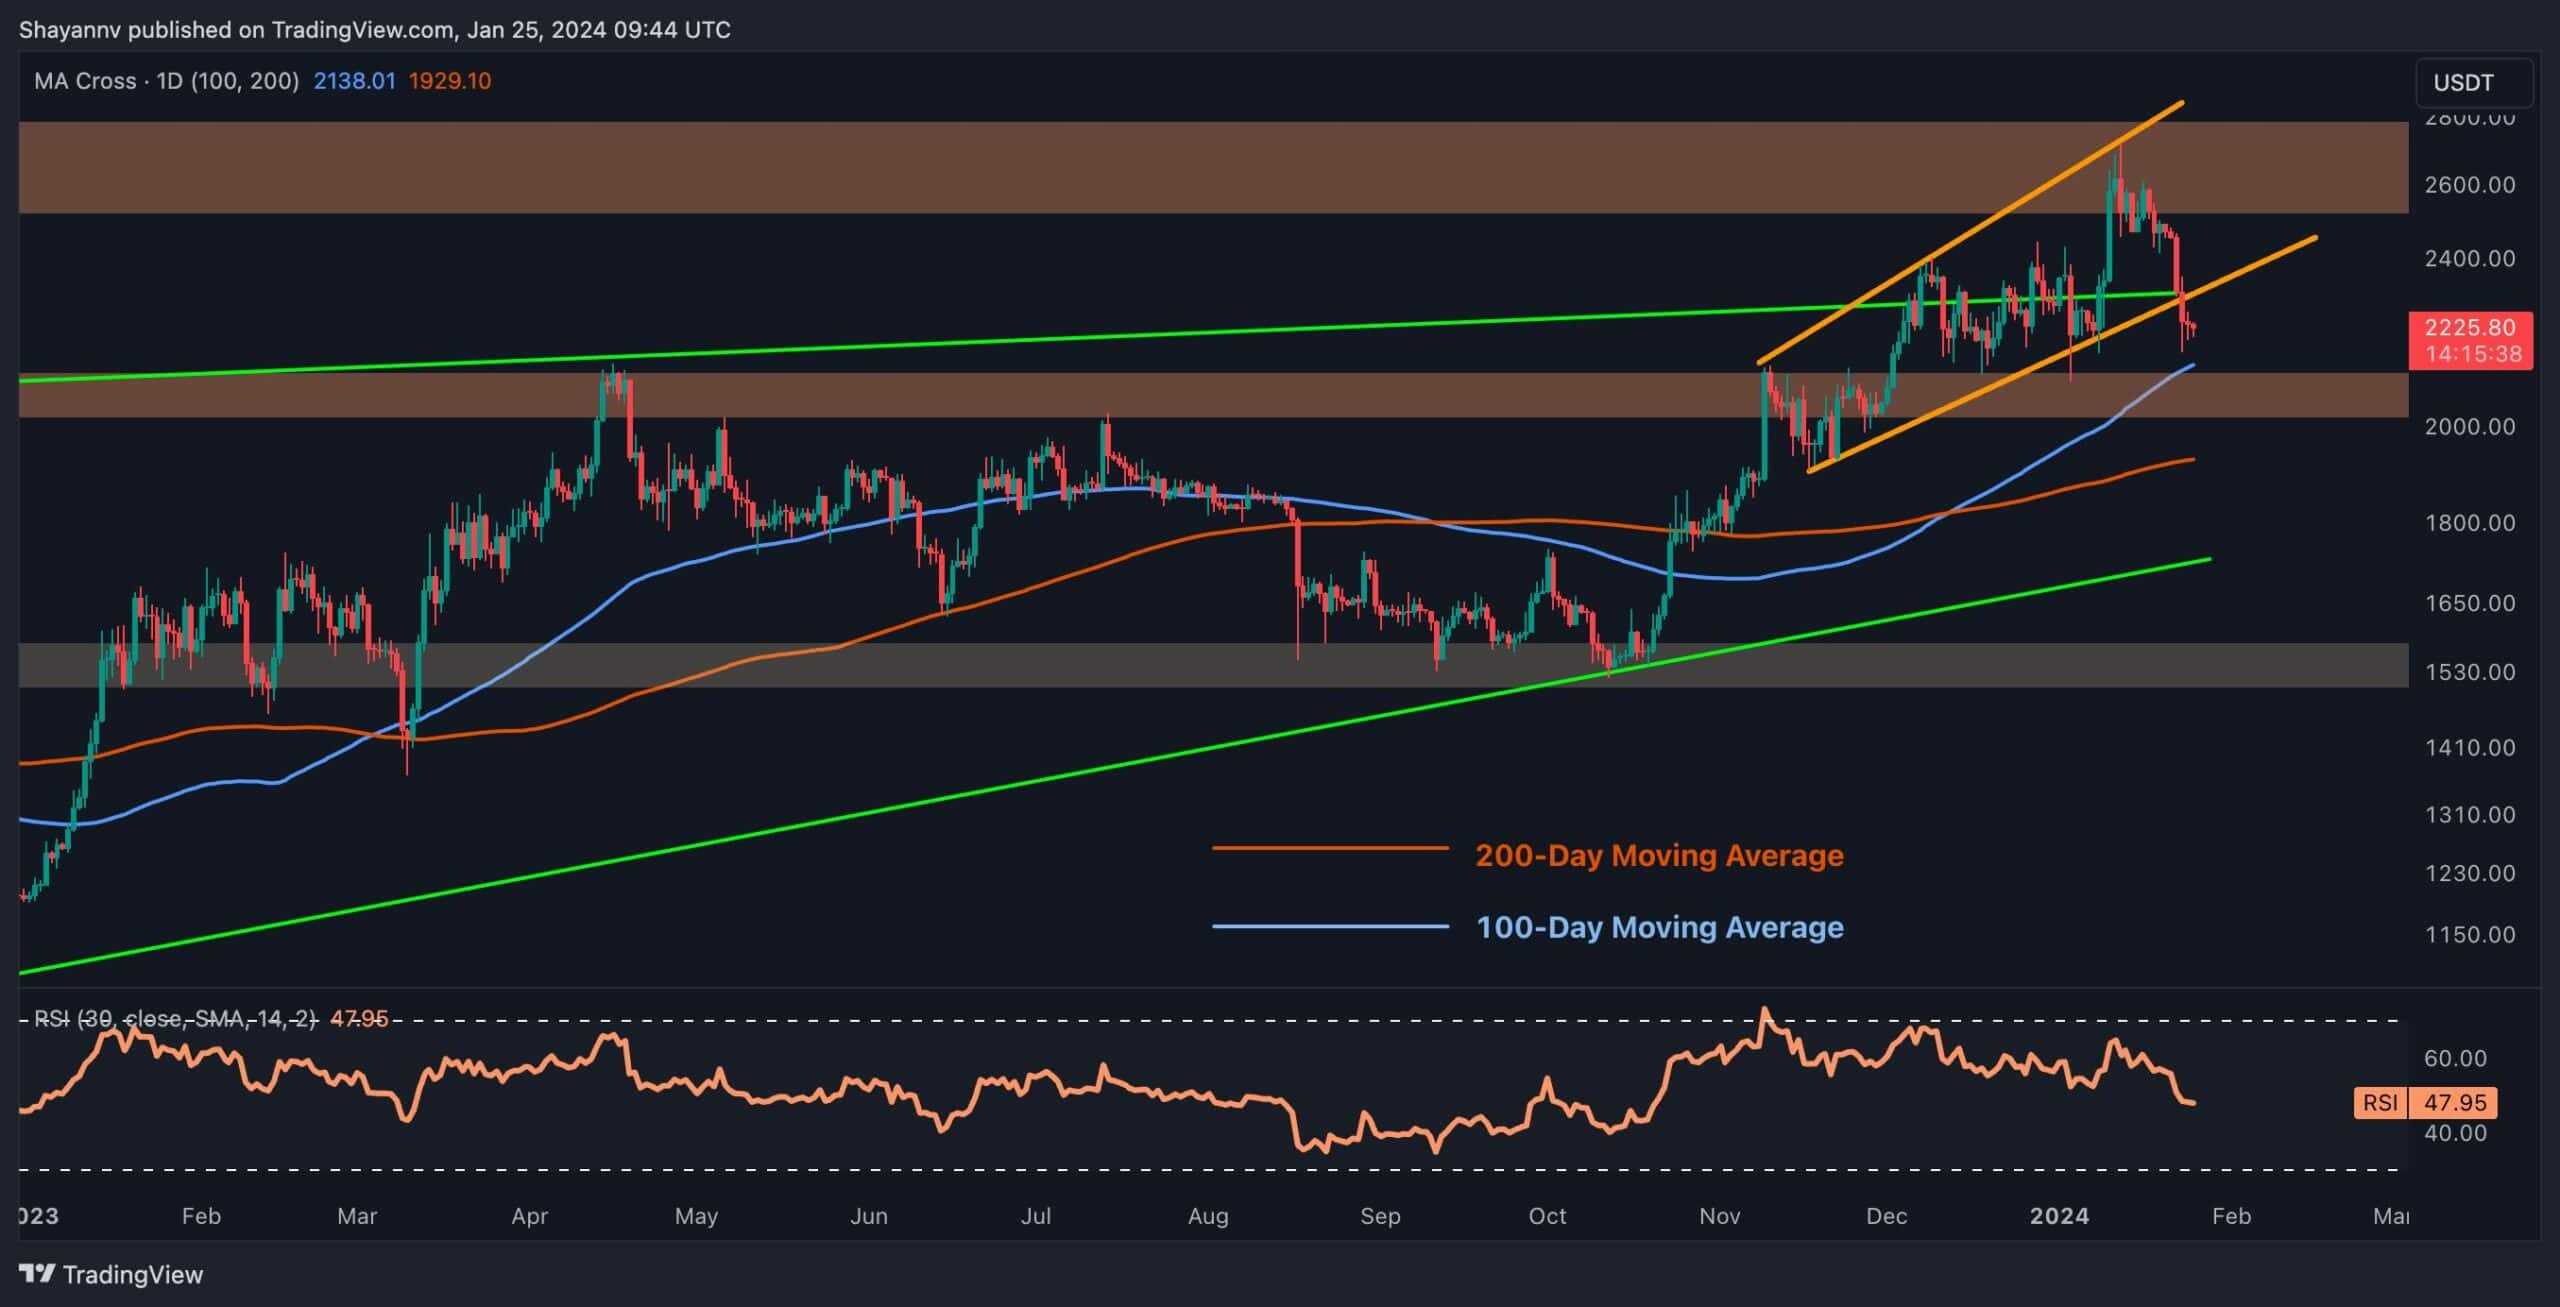
Ethereum Price Analysis: The Daily Chart
A detailed analysis of Ethereum’s daily chart reveals a notable rejection after attempting to surpass the $2.6K resistance, resulting in a 20% decline. Concurrently, the price breached two vital support zones, the upper boundary of the multi-month ascending wedge and the lower boundary of the short-term expanding wedge, signaling prevalent selling pressure in the market.
This negative sentiment is further underscored by a significant bearish divergence between the price and the RSI indicator on the daily chart, acting as a catalyst for the downward momentum.
Nevertheless, Ethereum is currently approaching a substantial support zone, encompassing the 200-day moving average and aligning closely with the pivotal static support at $2.1K. Consequently, a potential reversal leading to a consolidation phase appears to be the most likely mid-term outcome.
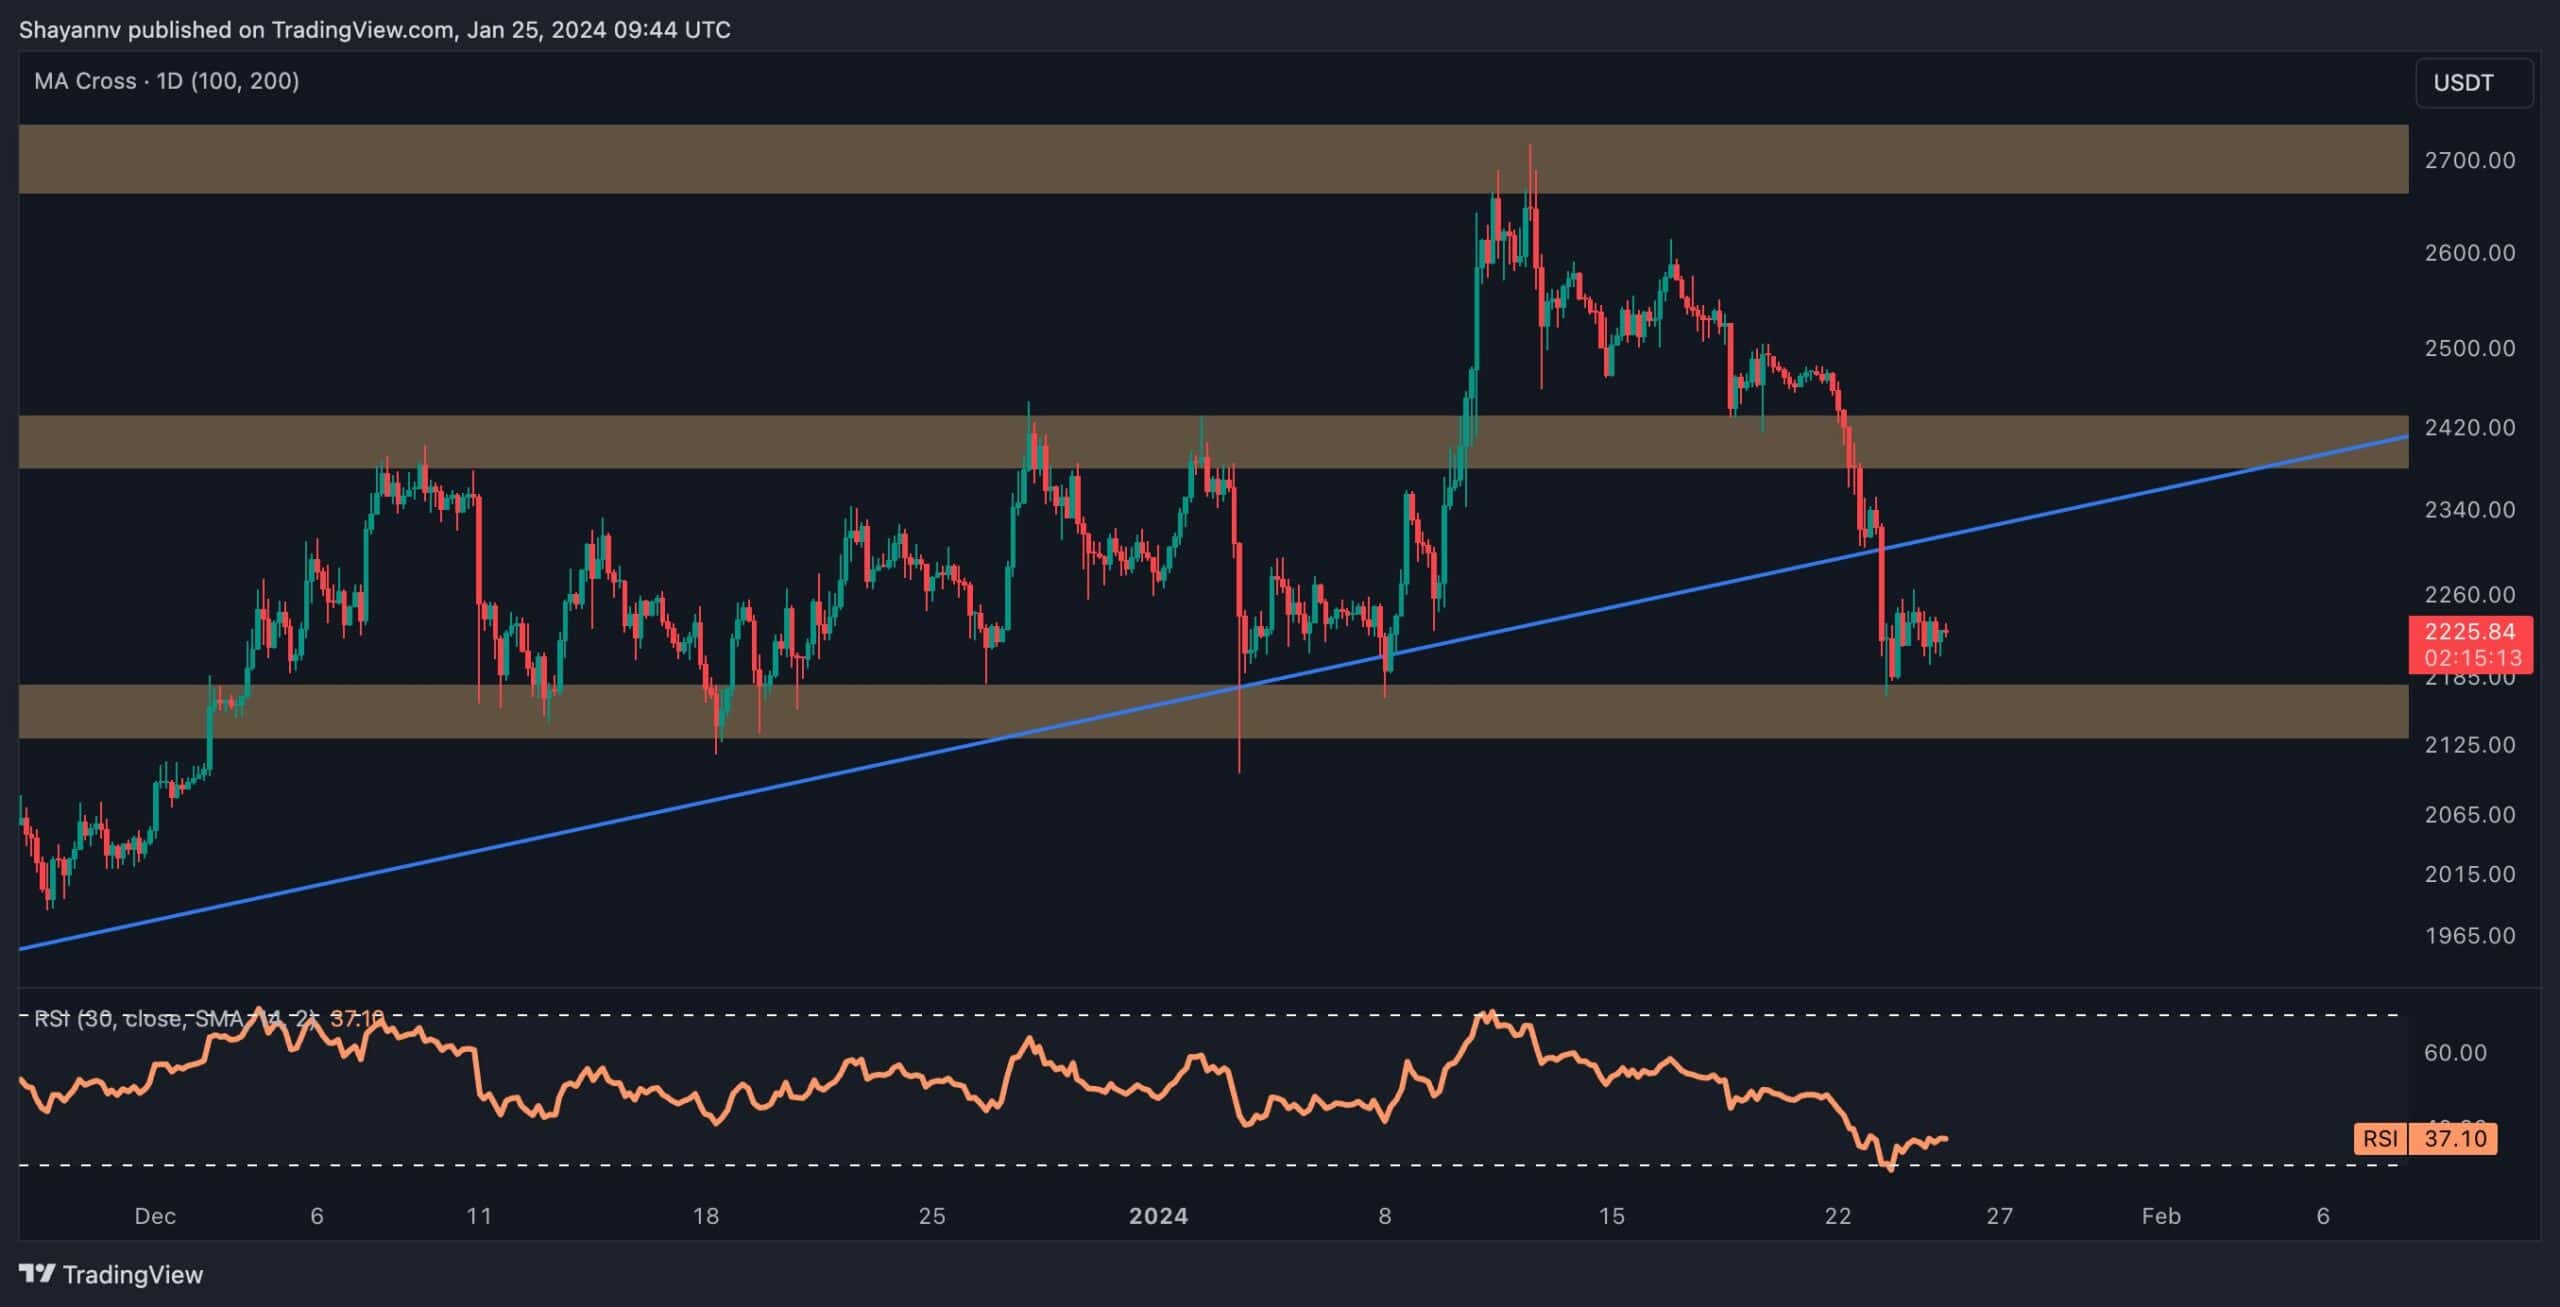
The 4-Hour Chart
Analyzing the 4-hour chart – following an impulsive surge, Ethereum encountered considerable selling pressure, initiating a correction phase. This heightened selling activity led to an aggressive and sharp decline, resulting in a successful break below the multi-month ascending trendline, highlighting the dominance of sellers in the current market conditions.
At present, the ETH price has reached a significant support region, defined by the decisive static zone at $2.1K. This crucial level has effectively halted numerous downward attempts in recent months, establishing itself as a robust barrier against sellers.
The expectation is that the price will find support around the $2.1K zone, directing in a mid-term consolidation stage bounded by the $2.1K significant support and the $2.5K noteworthy resistance. Meanwhile, should a bullish retracement materialize, leading to a pullback to the broken trendline, the potential for a continuation of the bearish leg becomes imminent.
By Shayan
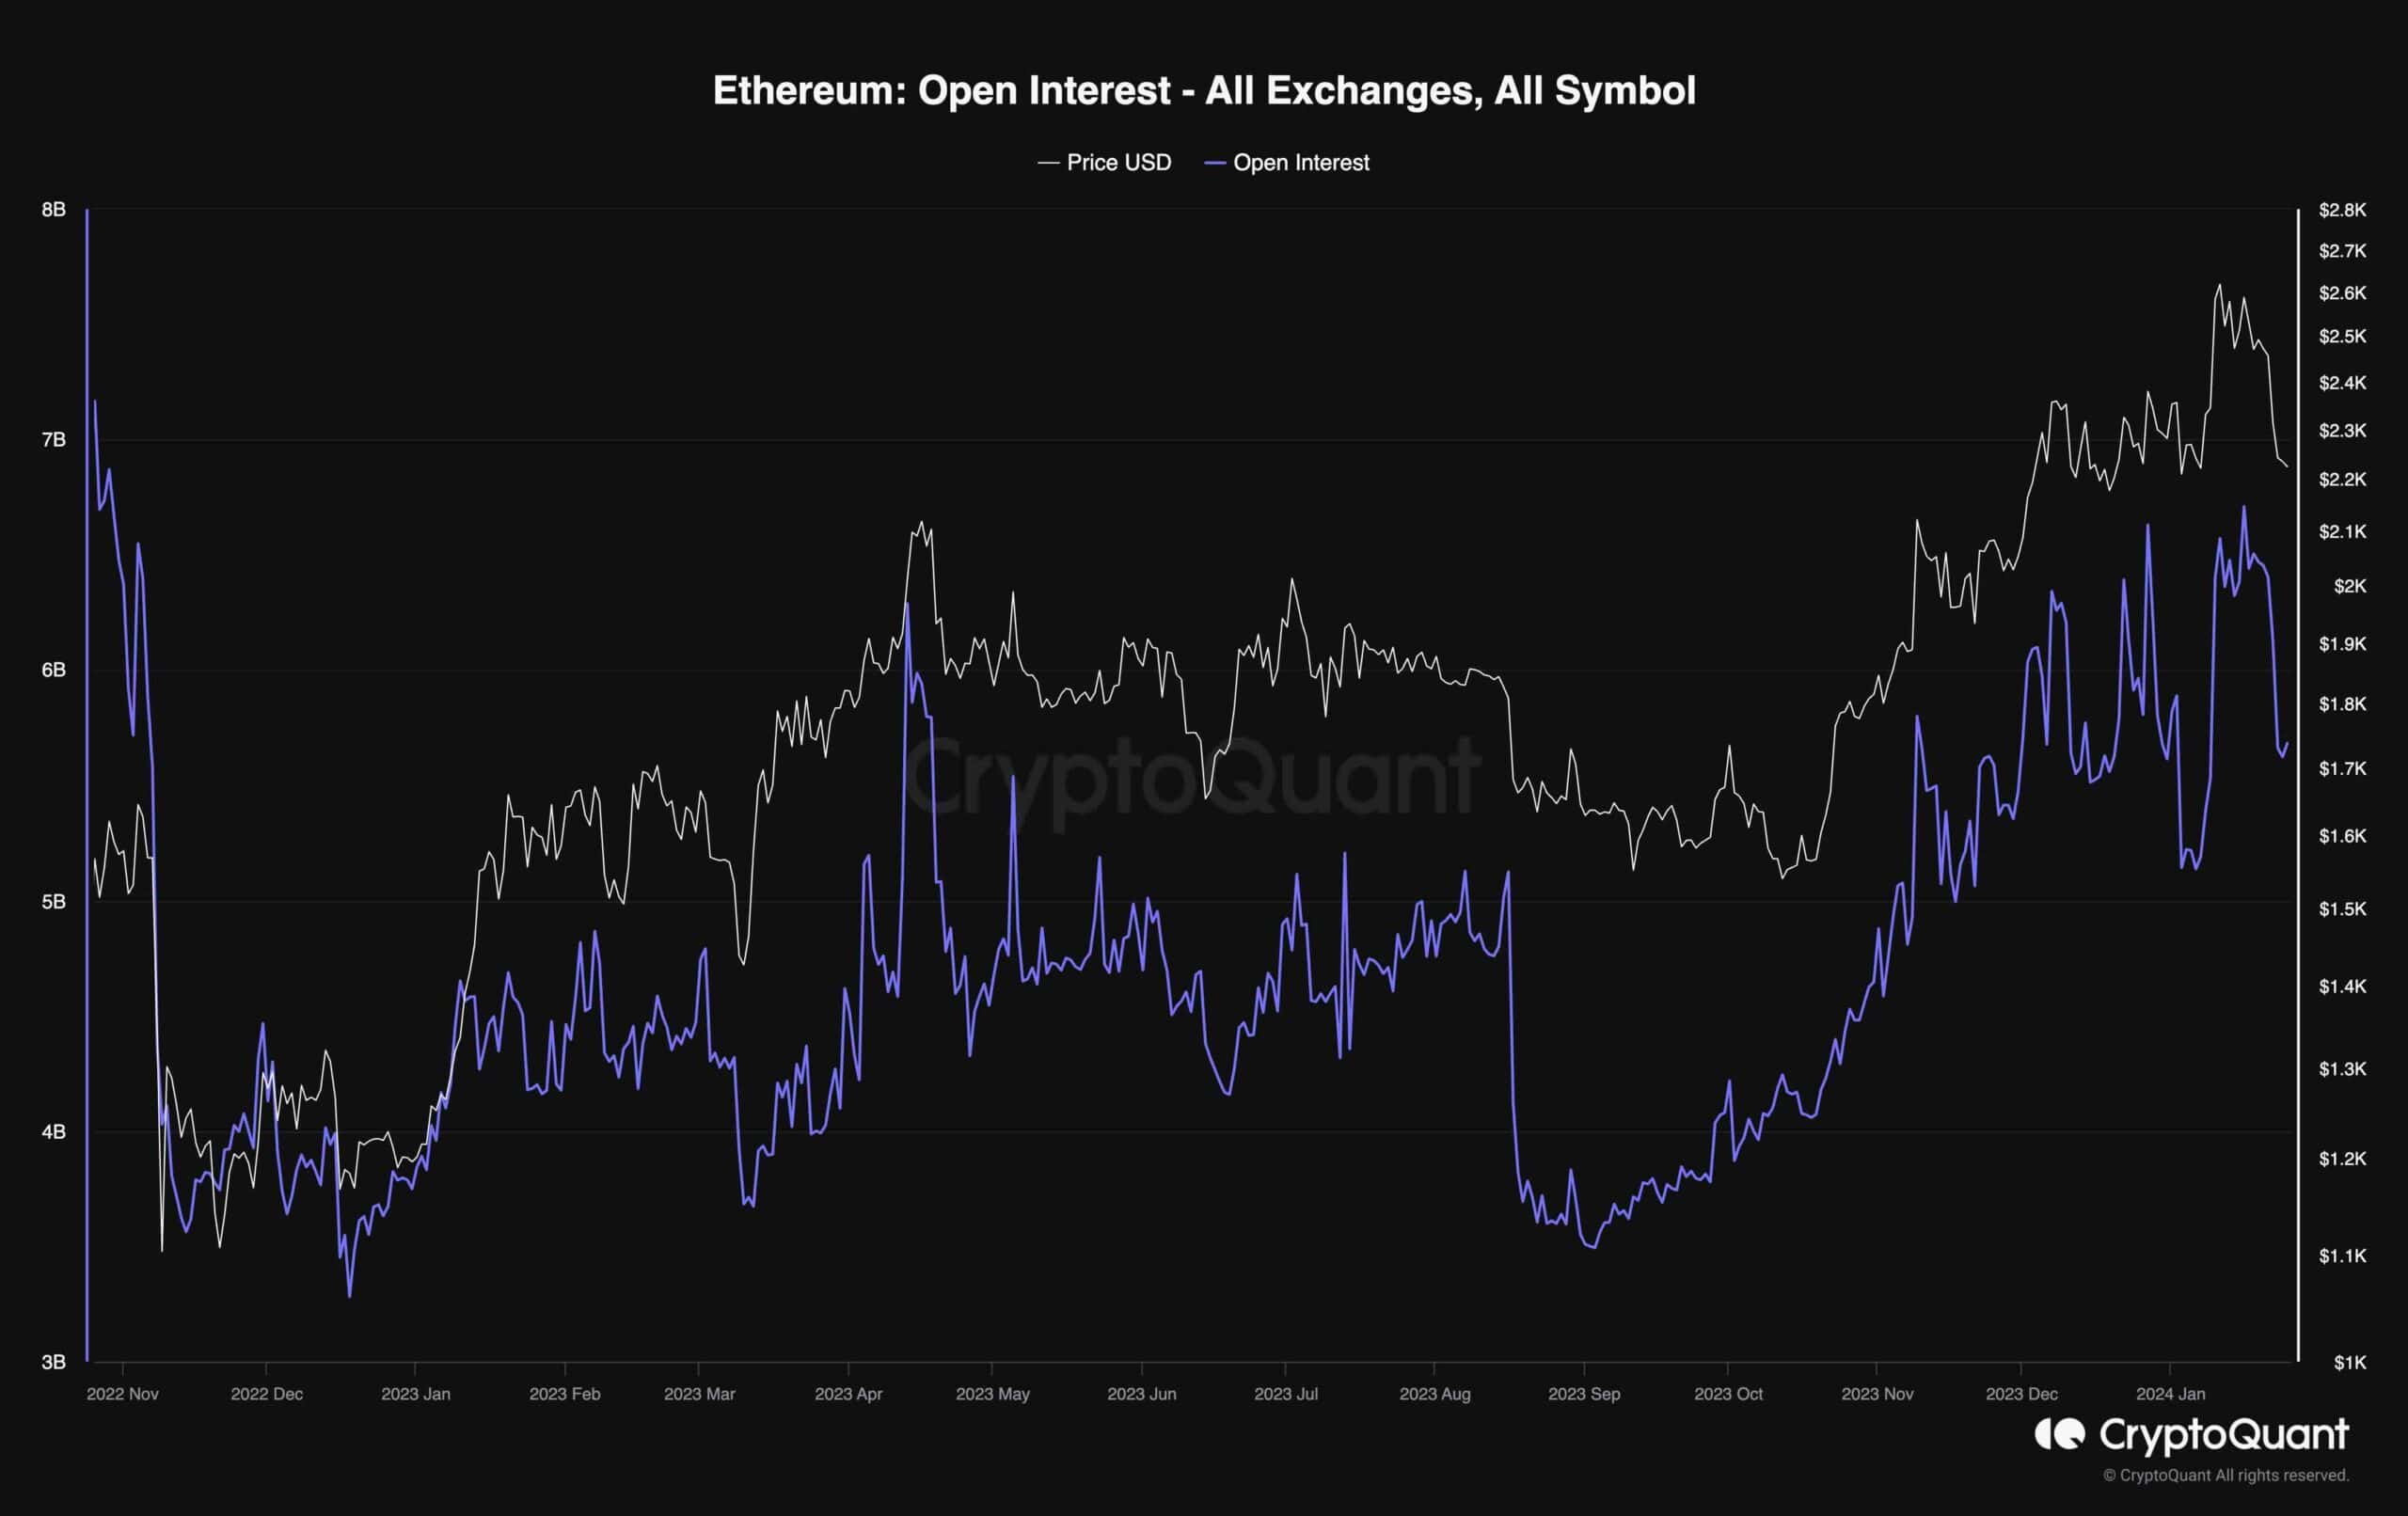
While Ethereum’s value has experienced a decline, an intriguing signal emerges from the underlying dynamics of the futures market.
The provided chart illustrates open interest, a pivotal metric for assessing sentiment in the futures market. Open interest gauges the number of active futures positions, with higher values typically correlating with increased volatility and vice versa.
Amidst the recent correction, a significant decline in the open interest metric is a noteworthy development. This, accompanied by positive funding rate readings, indicates that the prevailing sentiment remains bullish, simultaneously suggesting a cooling-off in the perpetual markets from their previously overheated state.
Consequently, there is potential for the price to resume its upward trajectory once the ongoing correction phase concludes.