BitcoinThis week the trend is clearly bearish. Bitcoin price lost support at ,500 and it corrected to the area around ,000. If support here fails, the price could continue going down to ,450. The attempts to break up from the downward trend should also be considered. The resistance is at ,200. Previously, the support line that we marked in October was broken and it was quite sharp. The targets are based on previous breakouts of this trend.EthereumAgainst the USD, ETH lost support at 0 and is pulling down to 0. It’s hard to tell if that’s the support compared to the dip that we saw in October when the price dropped all the way down to 3. These levels must be taken into account. The resistance is at 0 around the 50MA.Against Bitcoin, the price behaves differently and the
Topics:
Jonathan Berger considers the following as important: Price Analysis
This could be interesting, too:
CryptoVizArt writes ETH’s Path to K Involves Maintaining This Critical Support (Ethereum Price Analysis)
Duo Nine writes Crypto Price Analysis June-29: ETH, XRP, ADA, DOGE, and DOT
Duo Nine writes Crypto Price Analysis June-15: ETH, XRP, ADA, DOGE, and DOT
Duo Nine writes Why is the Shiba Inu (SHIB) Price Down Today?
Bitcoin
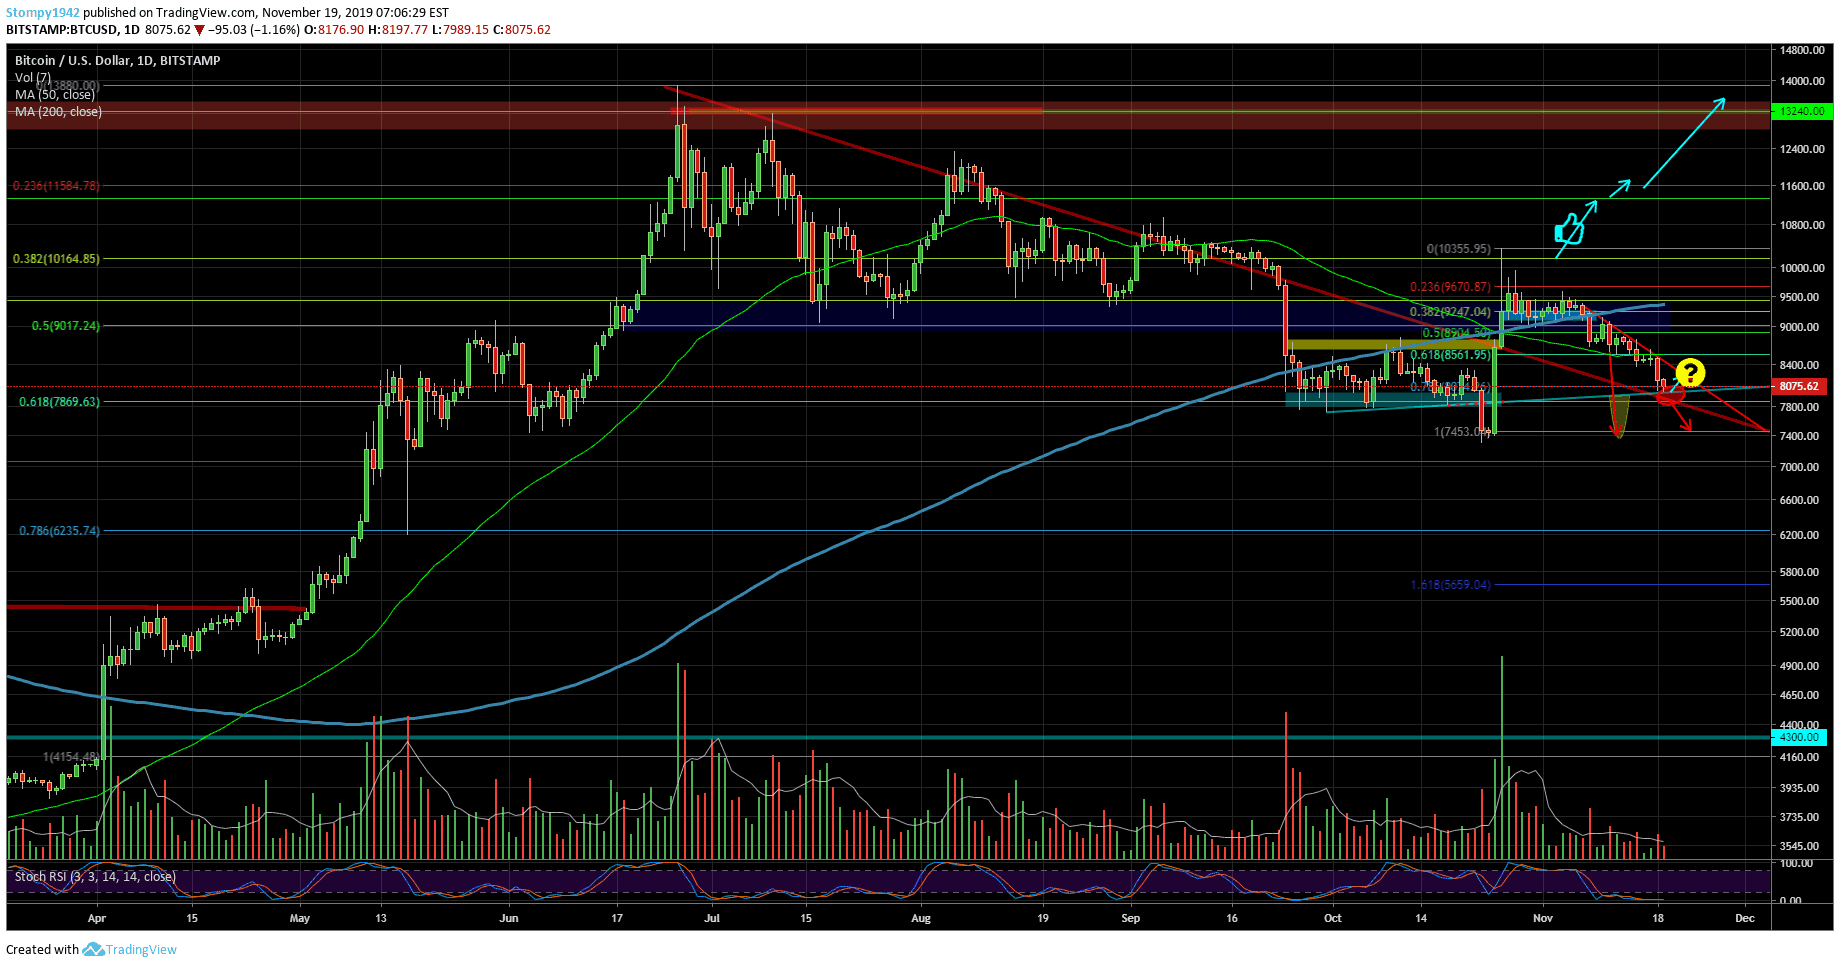
This week the trend is clearly bearish. Bitcoin price lost support at $8,500 and it corrected to the area around $8,000. If support here fails, the price could continue going down to $7,450. The attempts to break up from the downward trend should also be considered. The resistance is at $8,200. Previously, the support line that we marked in October was broken and it was quite sharp. The targets are based on previous breakouts of this trend.
Ethereum
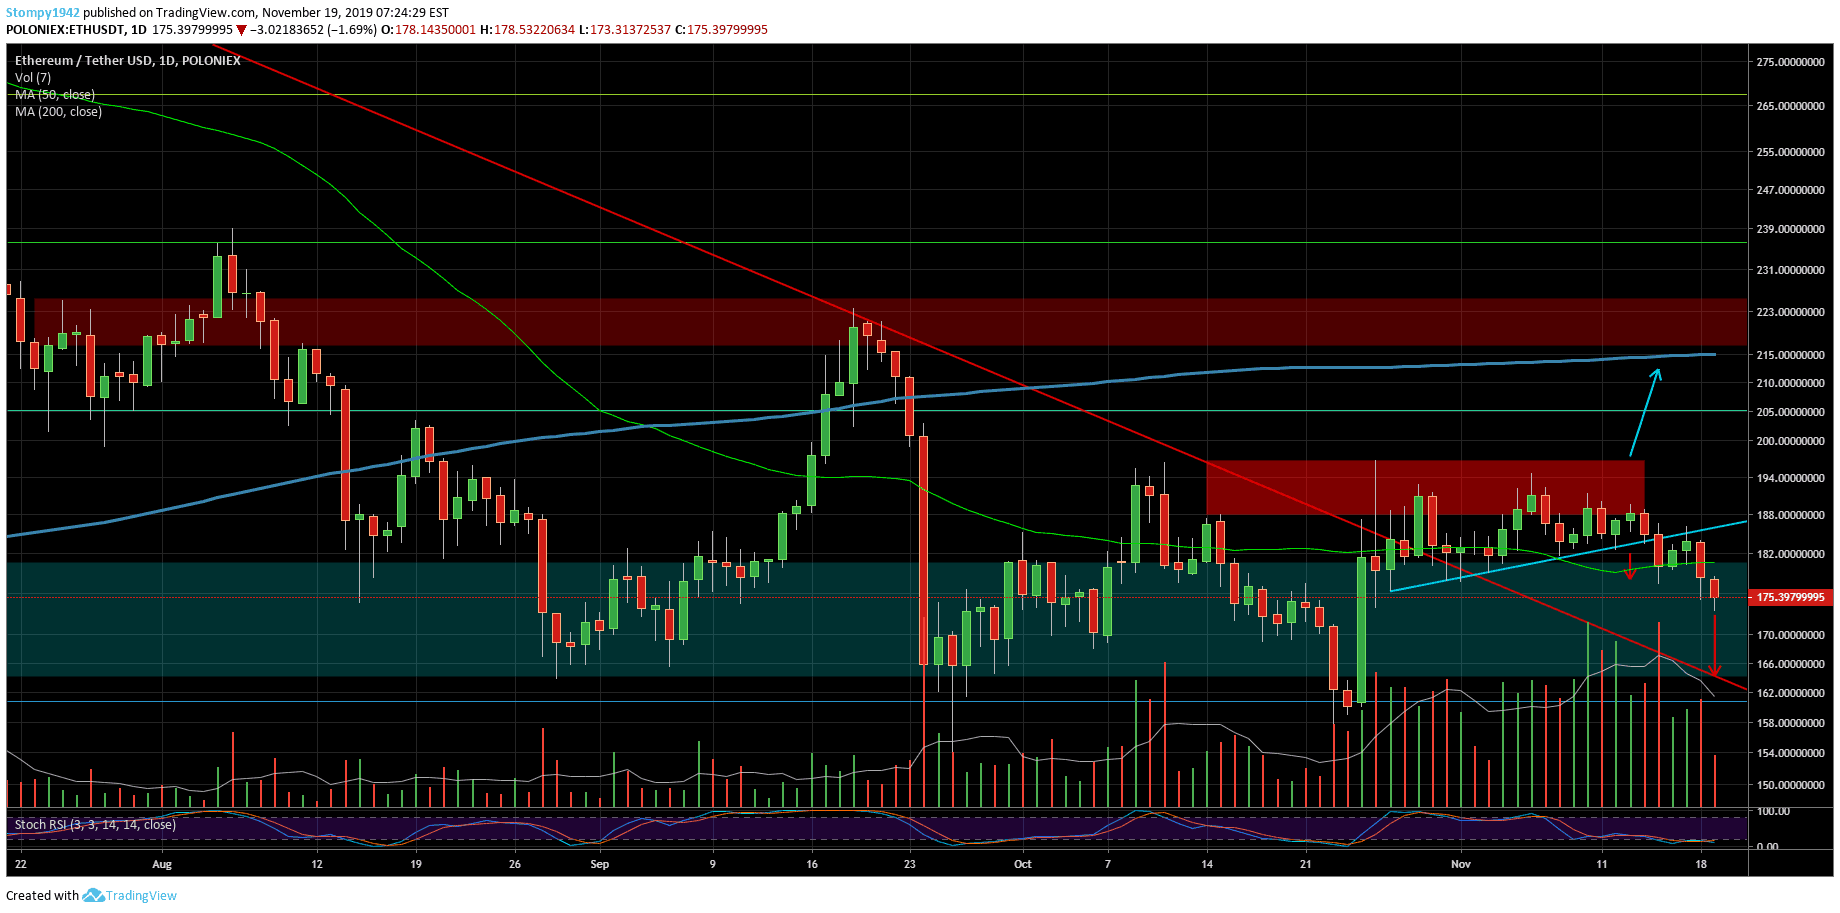
Against the USD, ETH lost support at $180 and is pulling down to $170. It’s hard to tell if that’s the support compared to the dip that we saw in October when the price dropped all the way down to $153. These levels must be taken into account. The resistance is at $180 around the 50MA.
Against Bitcoin, the price behaves differently and the trend is maintained and it climbs steadily. It kept the support above the 50MA levels and has found resistance around 0.022BTC. If it breaks out, it will be interesting to see how the market responds but it is too early to predict and 0.023BTC should break quickly as well.
Ripple
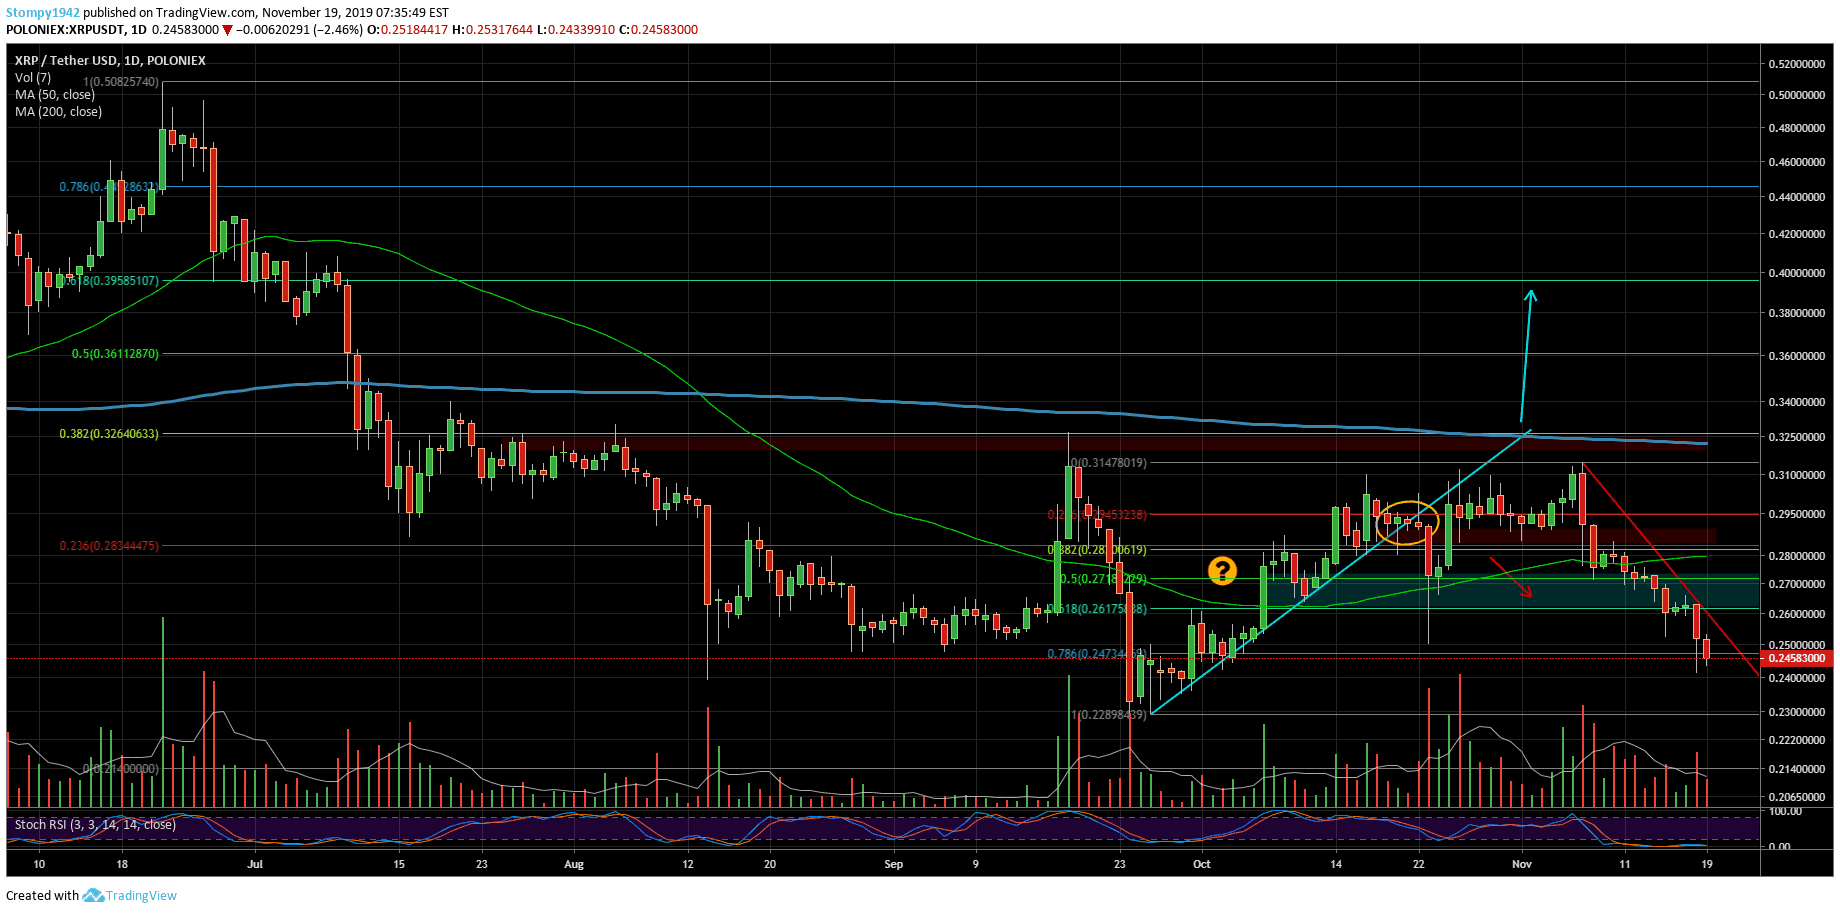
Against the USD, the trend is bearish and all support levels broke down easily. Currently, the support is at 24 cents and resistance is at 25 cents. The trend is downward and we might check the support from September at 22 cents. Usually, the behavior of the market is to reaffirm support and it’s not necessary to go all the way down there but it should be considered. This is how most of the markets behave if resistance levels are not broken.
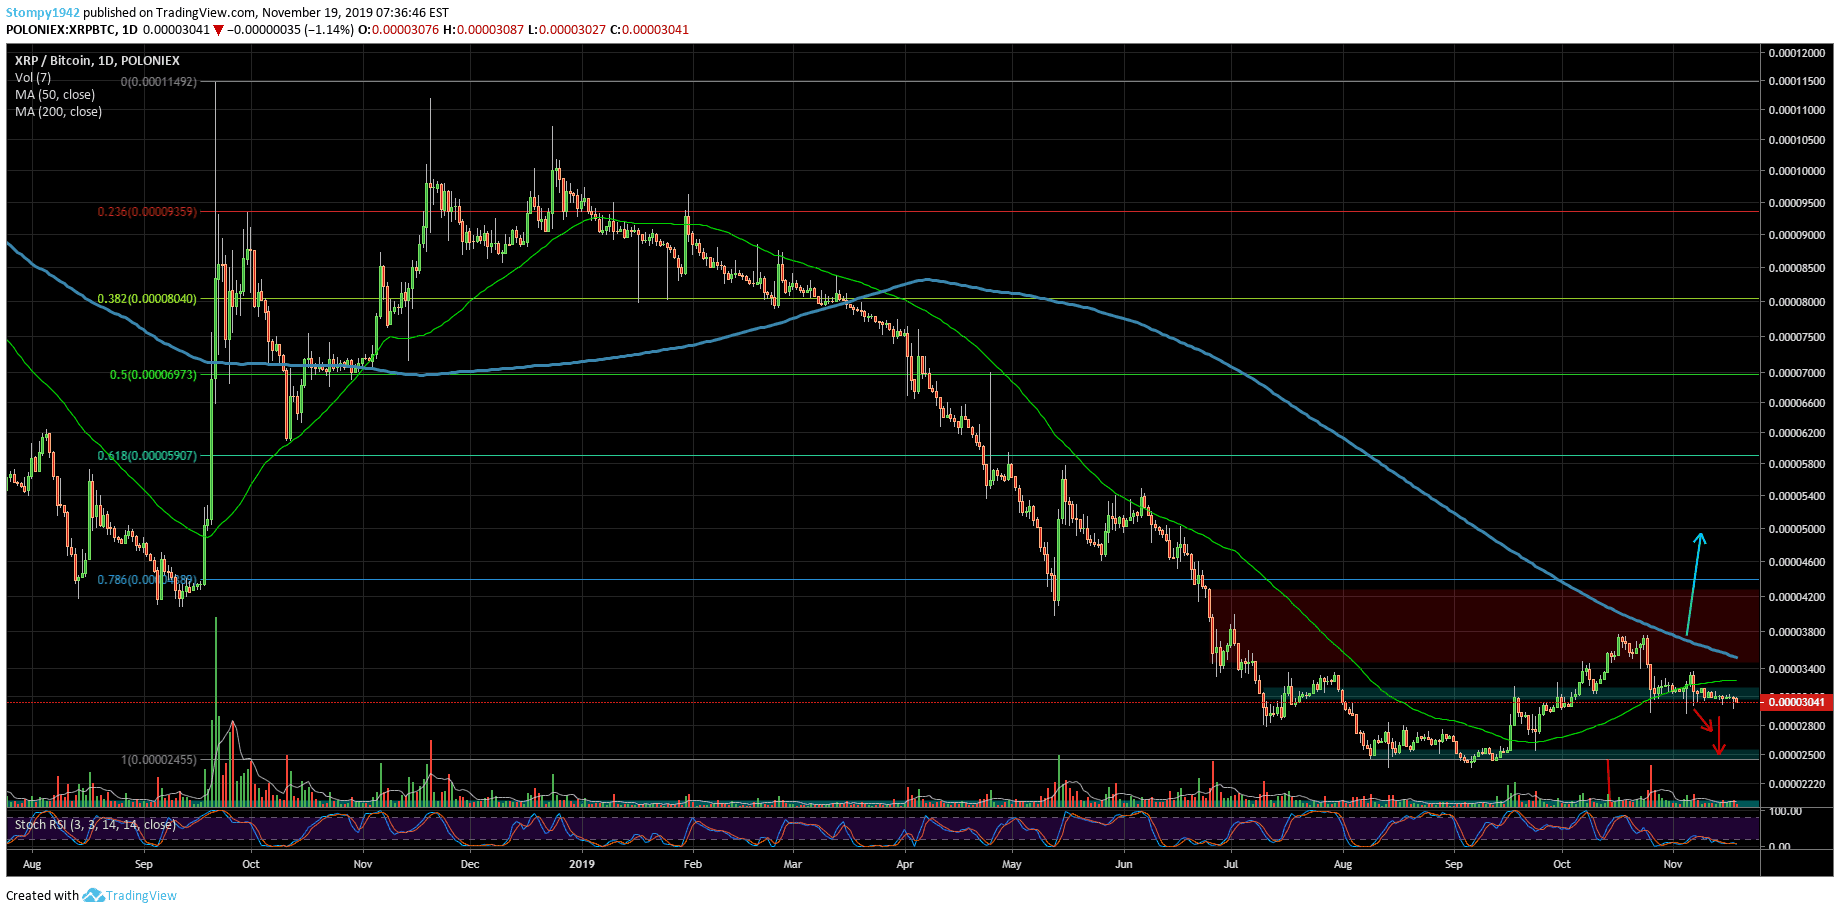
Against BTC, the price during the week hovers around 3000SAT which is the support in this range. Whenever there is an attempt to pump up the returns, it happens within this range. The resistance remains around the 200MA line in the bigger picture. In shorter-terms, the resistance is at 3250SAT around the 50MA.
DogeCoin
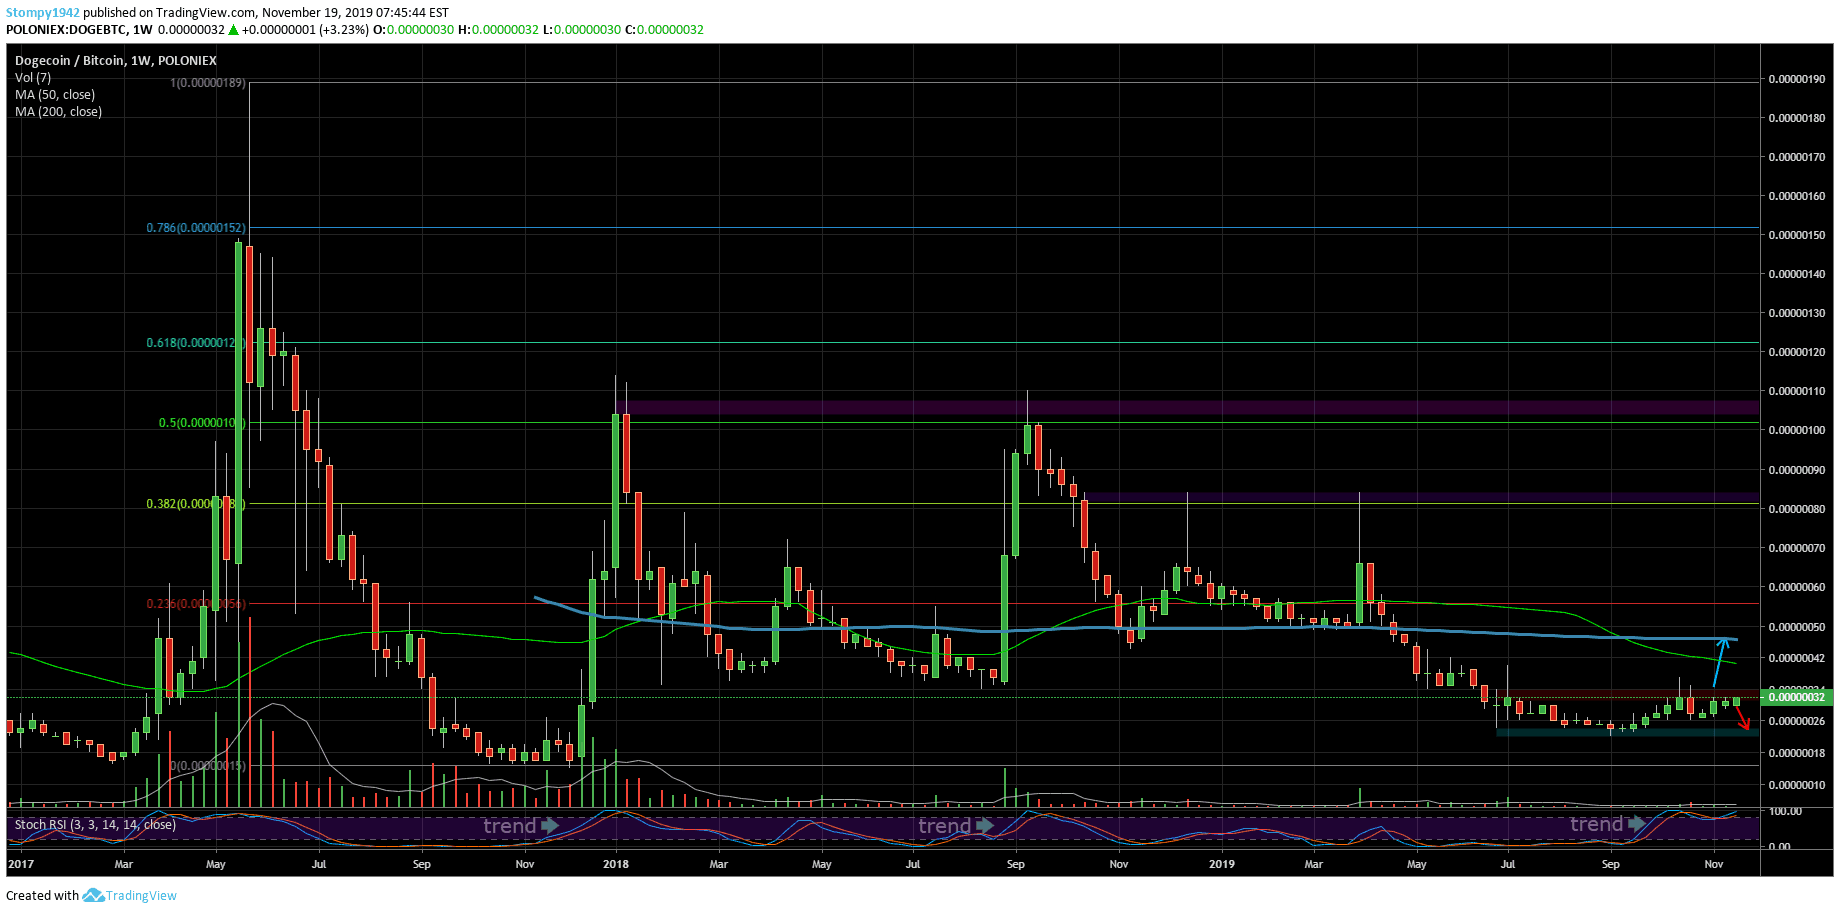
Most of the trading happens against Bitcoin and it’s easier for us to analyze and understand the chart.
Technically, things are looking interesting. The weekly graph sees support at 27SAT from where the price is trying to break up. The RSI continues its positive trend but the price is no longer rushing to break through as we’ve seen it before. If the resistance around 34SAT breaks down, there is no resistance all the way up to 50SAT. If we look at the history on the chart, it appears that the price has lost its momentum quickly.
Fusion
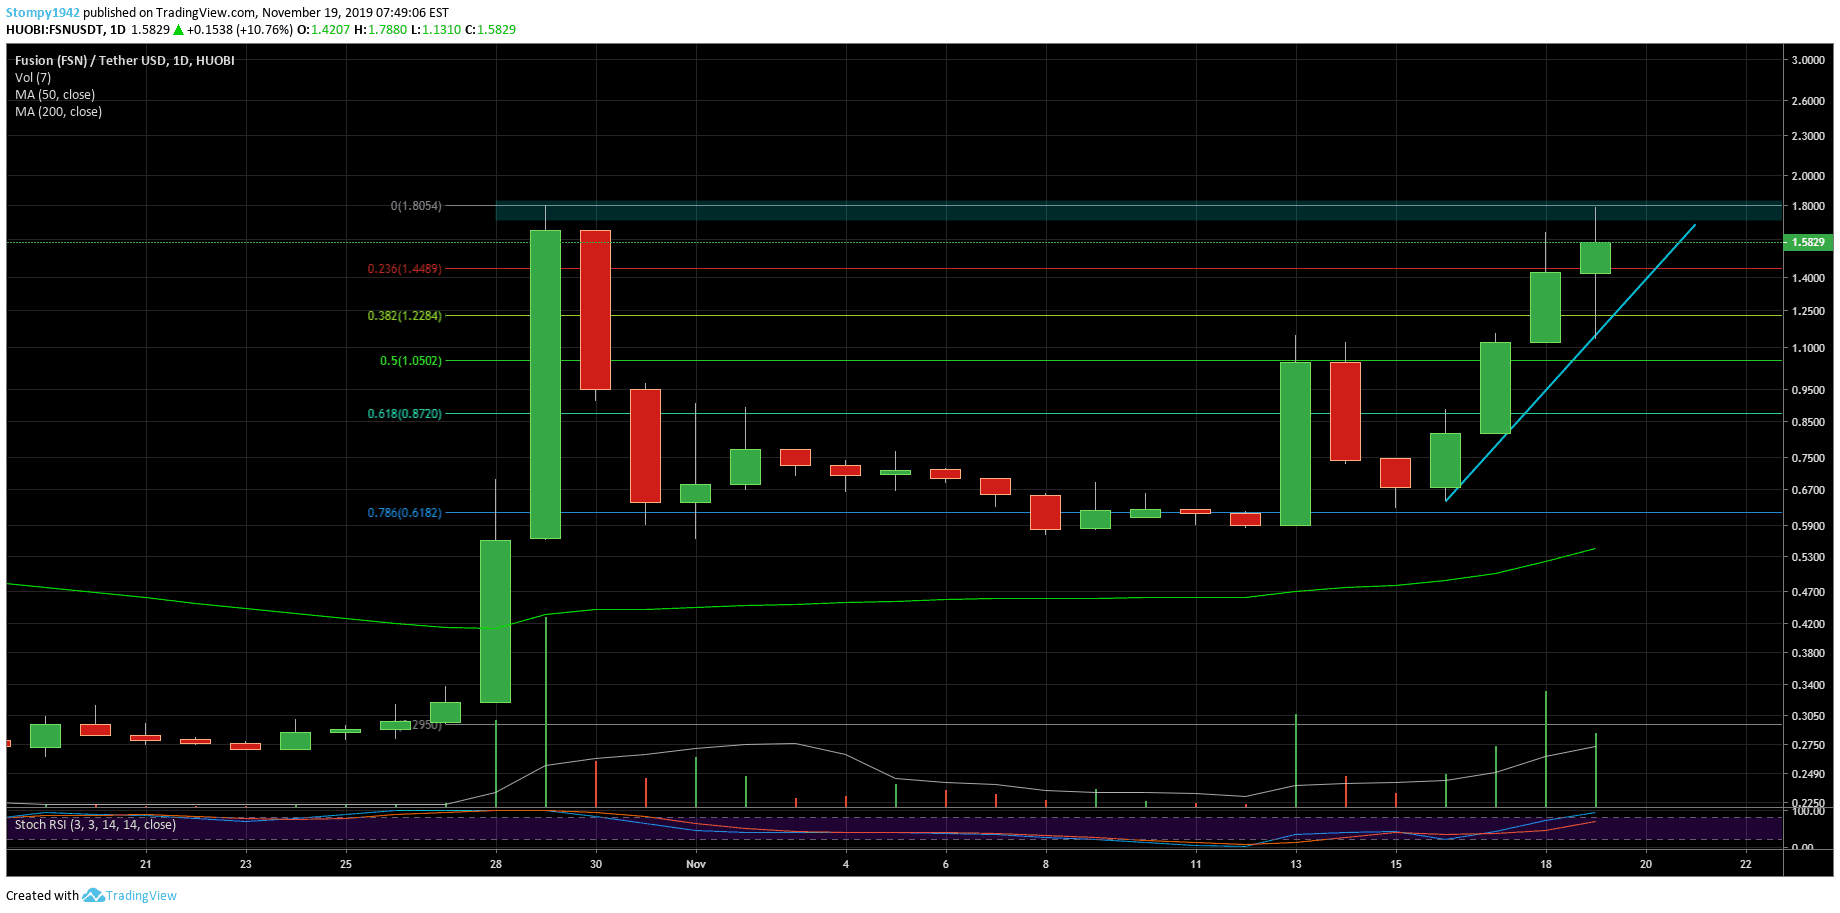
Against the USD, the price has increased by 300%, making it the best performing altcoin since the beginning of October. The resistance is at $1.80. The support maintained the last correction at $1.10 but the trend is too sharp and the further it goes, the more volatility we get.
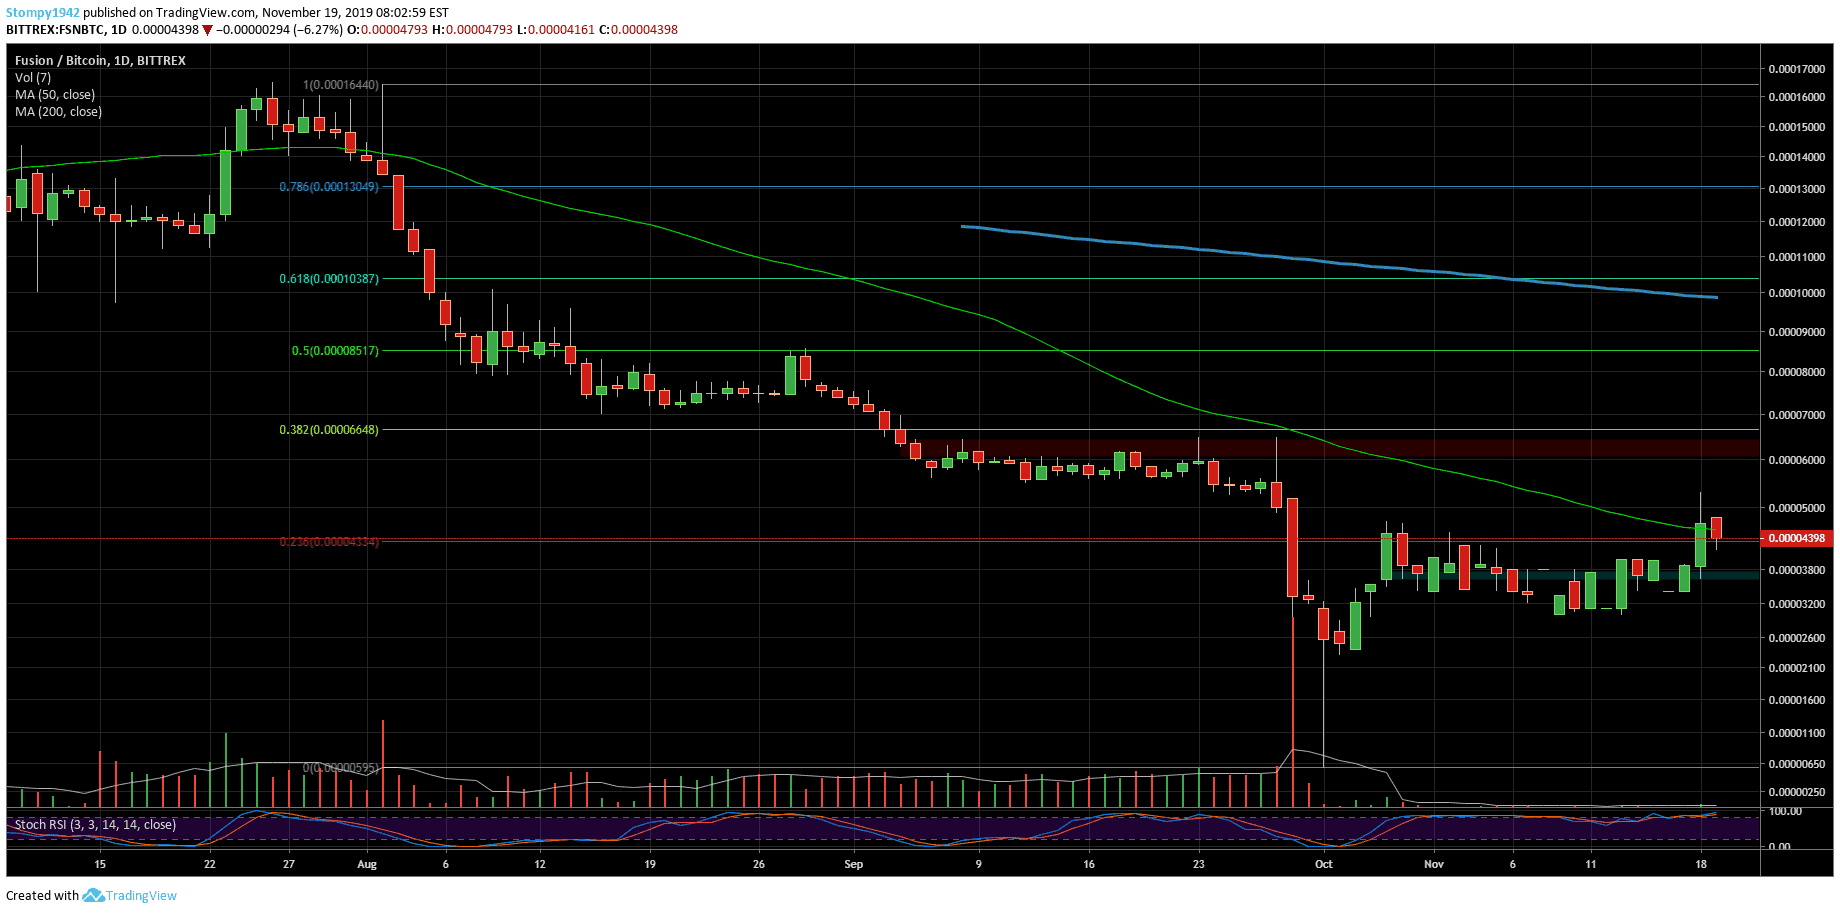
Against BTC, the trend is also quite sharp and the price is climbing. The resistance at 0.00018BTC was breached in the last day and now this area is turning into support in the range. Another thing that should probably be considered is a correction to the 0.618 Fibonacci levels that come at around 0.00010BTC. It might look a bit scary but that’s the technical landscape that’s shaping up after the sharp increase. The short-term resistance is at 0.00022BTC.
Against Ethereum, which is where most of the trading takes place, the price peaked. However, analysis is difficult to find in TradingView. Trading began on decentralized exchanges and that’s why we attached the chart from CoinMarketCap to get a clearer picture of what’s happening with the cryptocurrency.
The orange color line is against Ethereum.


