It’s safe to say that the last several days have been fairly turbulent for Bitcoin’s price. The cryptocurrency surged from around ,150 to about ,800 in a few days and lost all of its gains in a devastating red hourly candle which brought its price back to around ,300. Now, popular analysts are drawing a parallel with Bitcoin’s behavior in 2017 which led to the biggest “altcoin season” to date. Will history repeat itself?Bitcoin’s Price PerformanceToward the end of last week, we saw Bitcoin’s price jump from ,150 to ,800, shattering important resistance levels on the way up. However, the enthusiasm was short-lived, because it turned out to be a fake breakout.Indeed, Bitcoin’s price pulled back from ,800 and dropped to around ,300. This all happened in just one devastating
Topics:
George Georgiev considers the following as important: AA News
This could be interesting, too:
Chayanika Deka writes Yuga Labs Secures Major Win as SEC Closes Investigation Without Charges
Andrew Throuvalas writes Bitcoin Soars Back To ,000 After BlackRock CEO Says “Buy The Dip”
Chayanika Deka writes XRP, SOL, and ADA Inclusion in US Crypto Reserve Pushes Traders on Edge
Chayanika Deka writes Why Arthur Hayes Is Bullish on Bitcoin Under Trump’s Economic Strategy
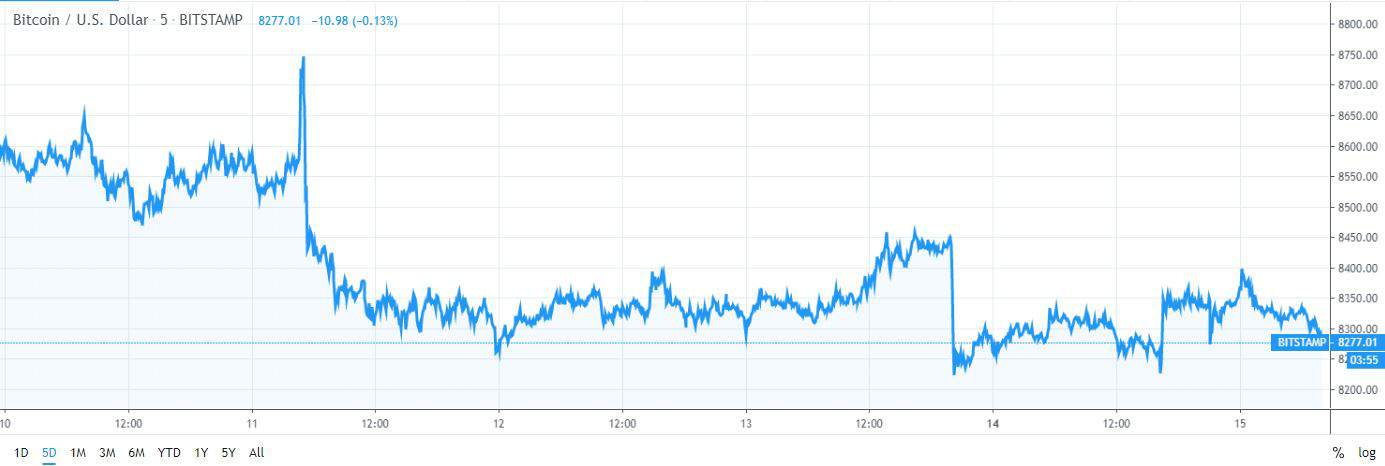
It’s safe to say that the last several days have been fairly turbulent for Bitcoin’s price. The cryptocurrency surged from around $8,150 to about $8,800 in a few days and lost all of its gains in a devastating red hourly candle which brought its price back to around $8,300. Now, popular analysts are drawing a parallel with Bitcoin’s behavior in 2017 which led to the biggest “altcoin season” to date. Will history repeat itself?
Bitcoin’s Price Performance
Toward the end of last week, we saw Bitcoin’s price jump from $8,150 to $8,800, shattering important resistance levels on the way up. However, the enthusiasm was short-lived, because it turned out to be a fake breakout.
Indeed, Bitcoin’s price pulled back from $8,800 and dropped to around $8,300. This all happened in just one devastating hourly candle.
Since then, the action has stagnated, and Bitcoin has been trading in a narrow range.

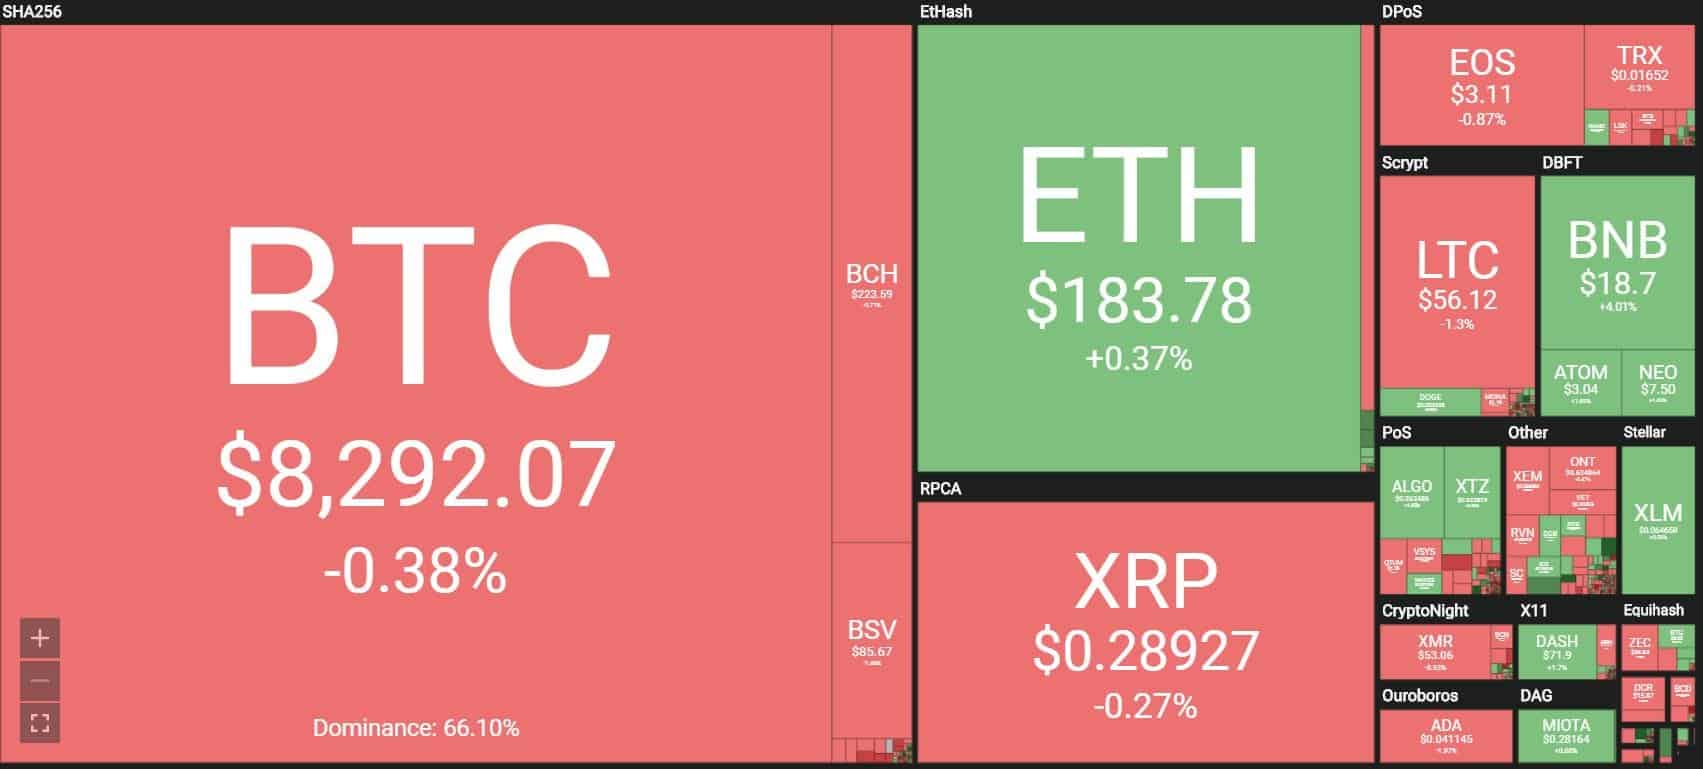
At the time of this writing, Bitcoin is trading at around $8,280 and possesses a market cap of $150 billion. Bitcoin’s dominance index has also declined over the past couple of weeks, and it now stands at 66.4%.
Altcoin Season in Sight?
Past performance shouldn’t be taken as an indicator of future growth. However, it is absolutely imperative to consider historical data when identifying key moments in Bitcoin’s price and in the movements of various altcoins.
A popular cryptocurrency trader has just made a comparison between the performance of Bitcoin and altcoins now and back in 2017.
They noted that the 2017 “altcoin season” began right after Bitcoin dipped from $1,300 to $900.
In 2017 altseason began after the first big dip on btc from $1300 to $900.
The scenario looks pretty similar right now. pic.twitter.com/W3qJ8HSXFJ
— Crypto₿ull (@CryptoBull) October 14, 2019
Indeed, the charts are similar. It’s important to note that 2017’s parabolic run was unparalleled, and it brought the prices of various cryptocurrencies to highs which, for the most part, haven’t been reached since.
Another Twitter user pointed to January 2016, suggesting that a new bull market could be imminent. According to “Crypto Michael”, Bitcoin finding its bottom and starting to grind up slowly is “always the best environment for altcoins.”
Meanwhile, altcoins have put in a mixed showing. Some have marked slight gains, and others are down a bit. For the most part, however, they also appear to be trading in a range, which could suggest that a big move is on the horizon.

