Ethereum slipped by a further 5% this week, bringing the price for the cryptocurrency down to the 0 level.ETH created a fresh 3-month low against BTC today after dropping beneath the 0.0175 BTC support.The cryptocurrency has now lost a steep 30% this past month.Key Support & Resistance LevelsETH/USDSupport: 8, 0, 8.Resistance: 3.50, 5, 2.ETH/BTC:Support: 0.0171 BTC, 0.0169 BTC, 0.0164 BTC.Resistance: 0.0179 BTC, 0.0184 BTC, 0.019 BTC.ETH/USD: ETH Struggles To Break 3.50 Resistance Since our last analysis, ETH managed to find strong support at the lower boundary of the descending price channel. After rebounding, the cryptocurrency started to rise but was unable to overcome the strong resistance at 3.50. This level had provided strong support during November and
Topics:
Yaz Sheikh considers the following as important: ETH Analysis, Ethereum (ETH) Price
This could be interesting, too:
Mandy Williams writes Ethereum Derivatives Metrics Signal Modest Downside Tail Risk Ahead: Nansen
CryptoVizArt writes Will Weak Momentum Drive ETH to .5K? (Ethereum Price Analysis)
Mandy Williams writes Ethereum Key Metrics Point to Persistent Bullish Outlook for ETH: CryptoQuant
CryptoVizArt writes Ethereum Price Analysis: Following a 15% Weekly Crash, What’s Next for ETH?
- Ethereum slipped by a further 5% this week, bringing the price for the cryptocurrency down to the $130 level.
- ETH created a fresh 3-month low against BTC today after dropping beneath the 0.0175 BTC support.
- The cryptocurrency has now lost a steep 30% this past month.
Key Support & Resistance Levels
ETH/USD
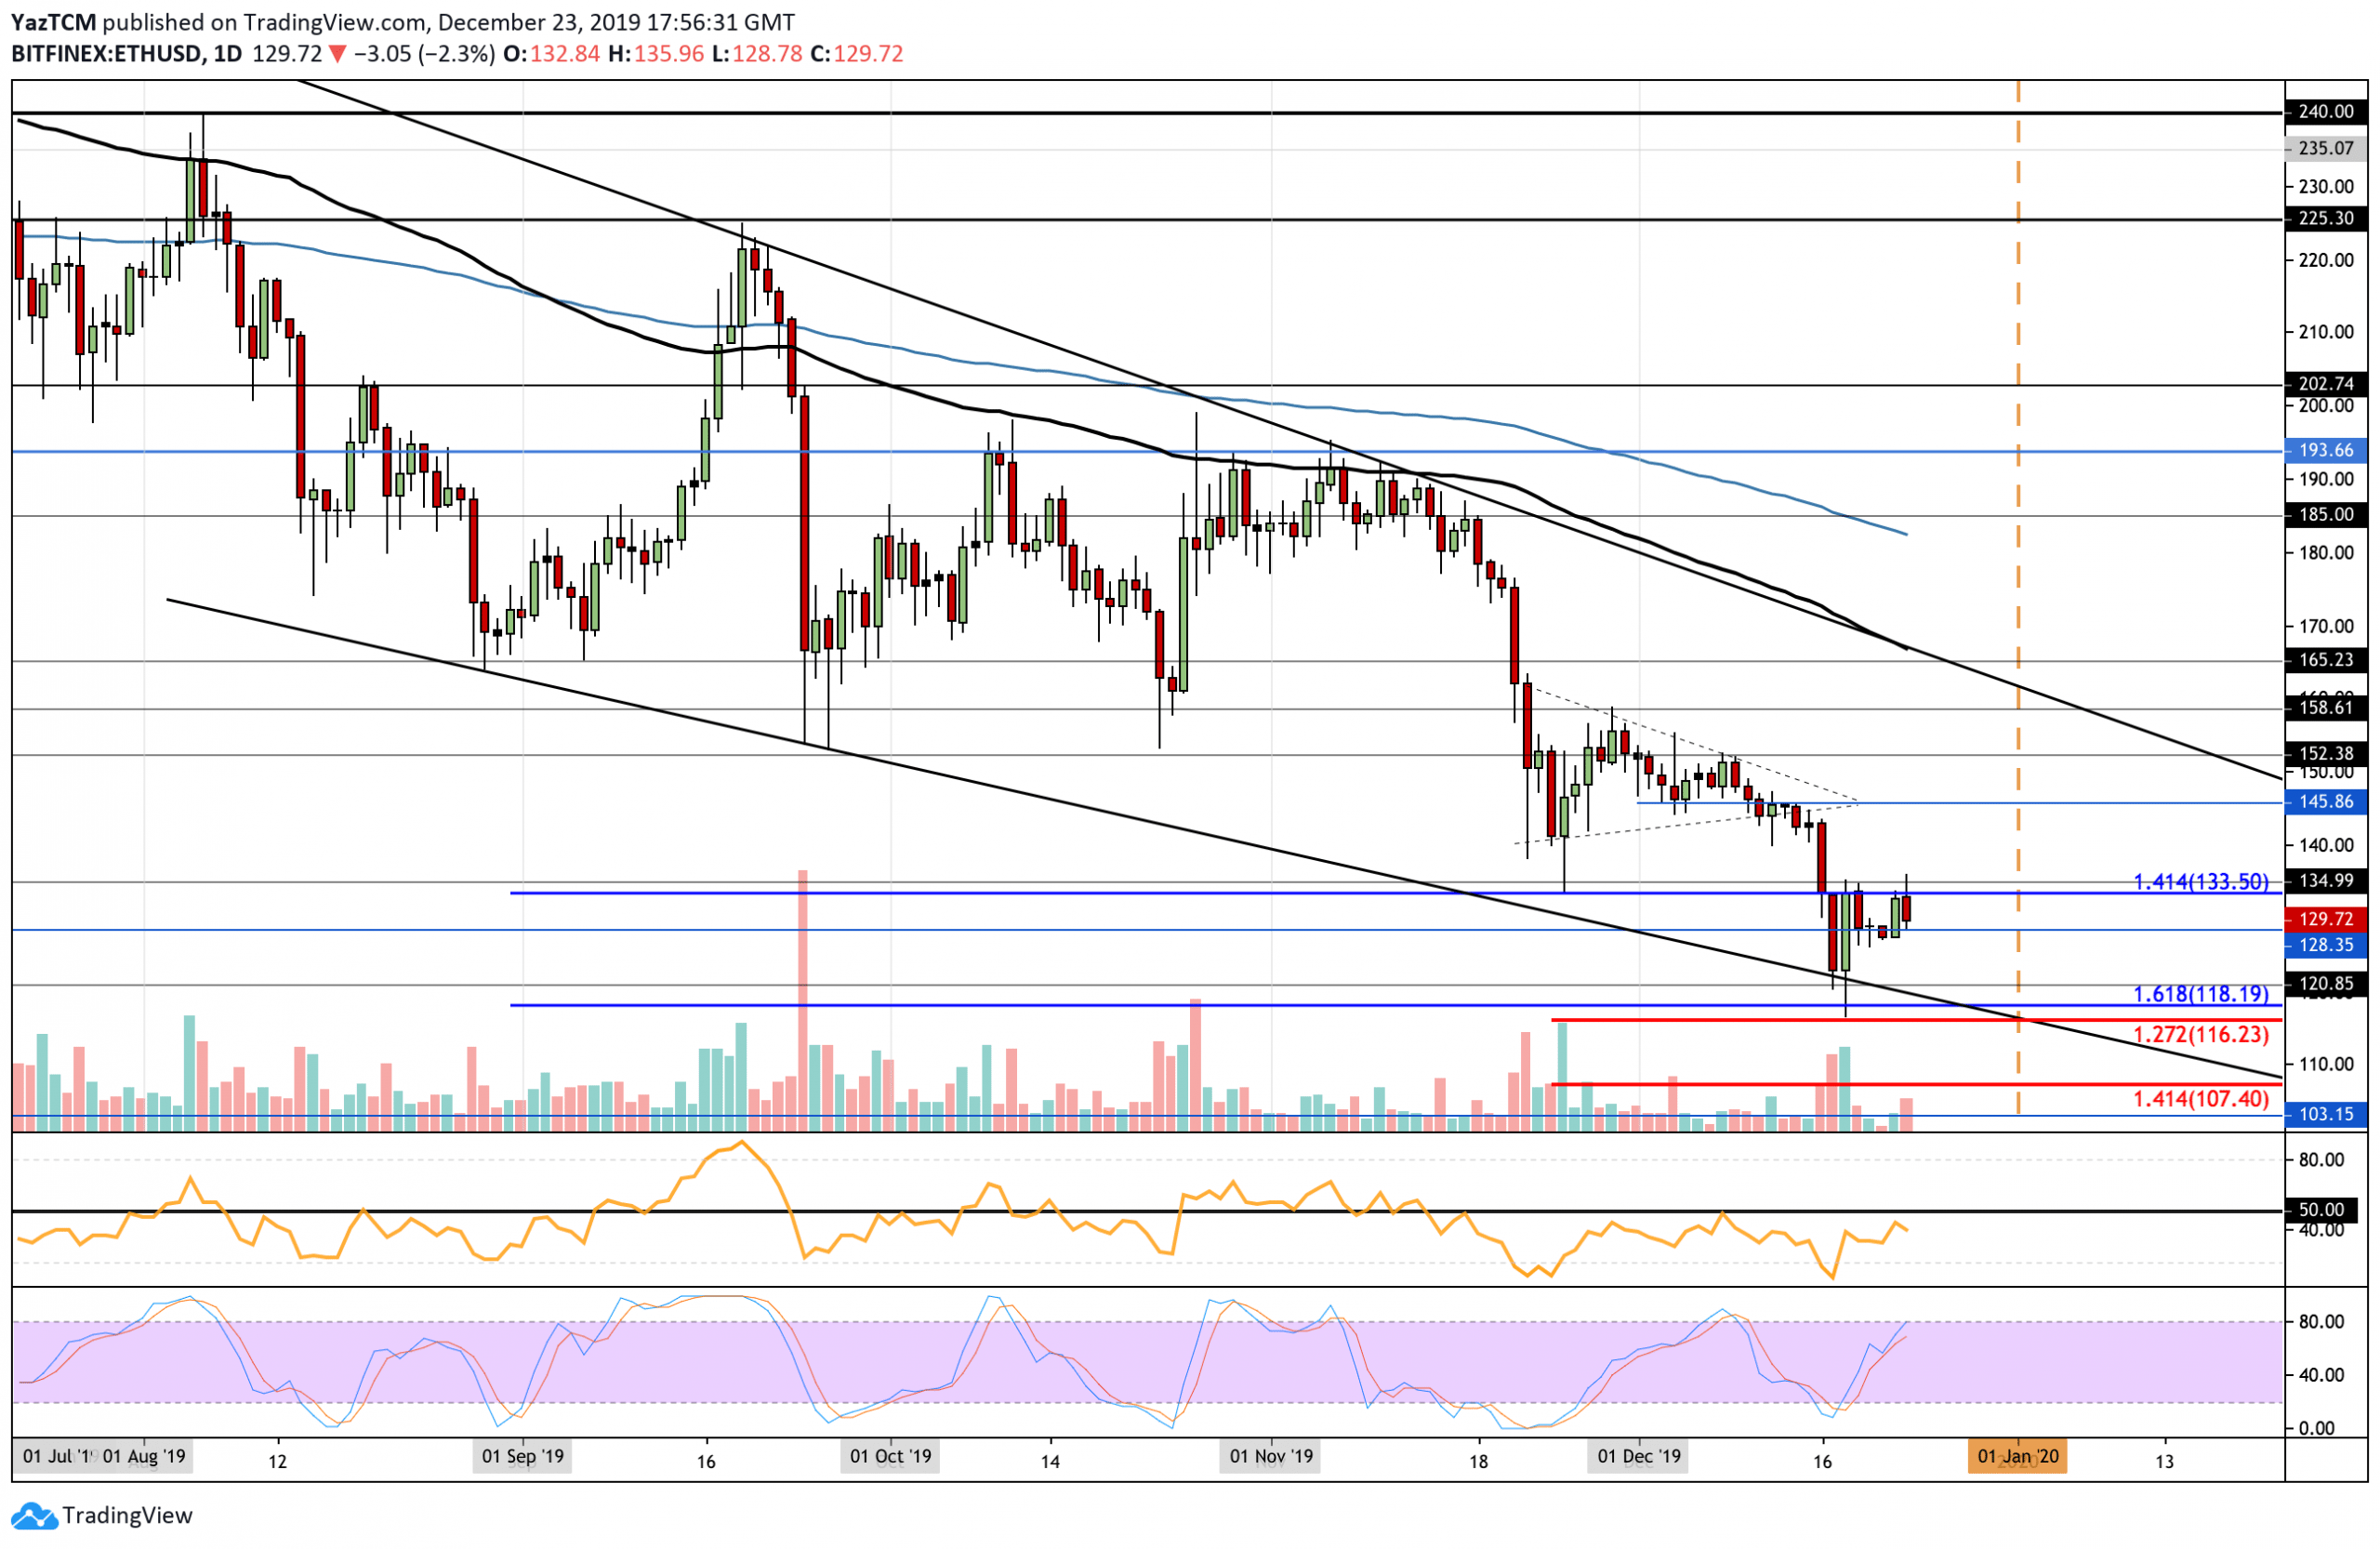
Support: $128, $120, $118.
Resistance: $133.50, $145, $152.
ETH/BTC:
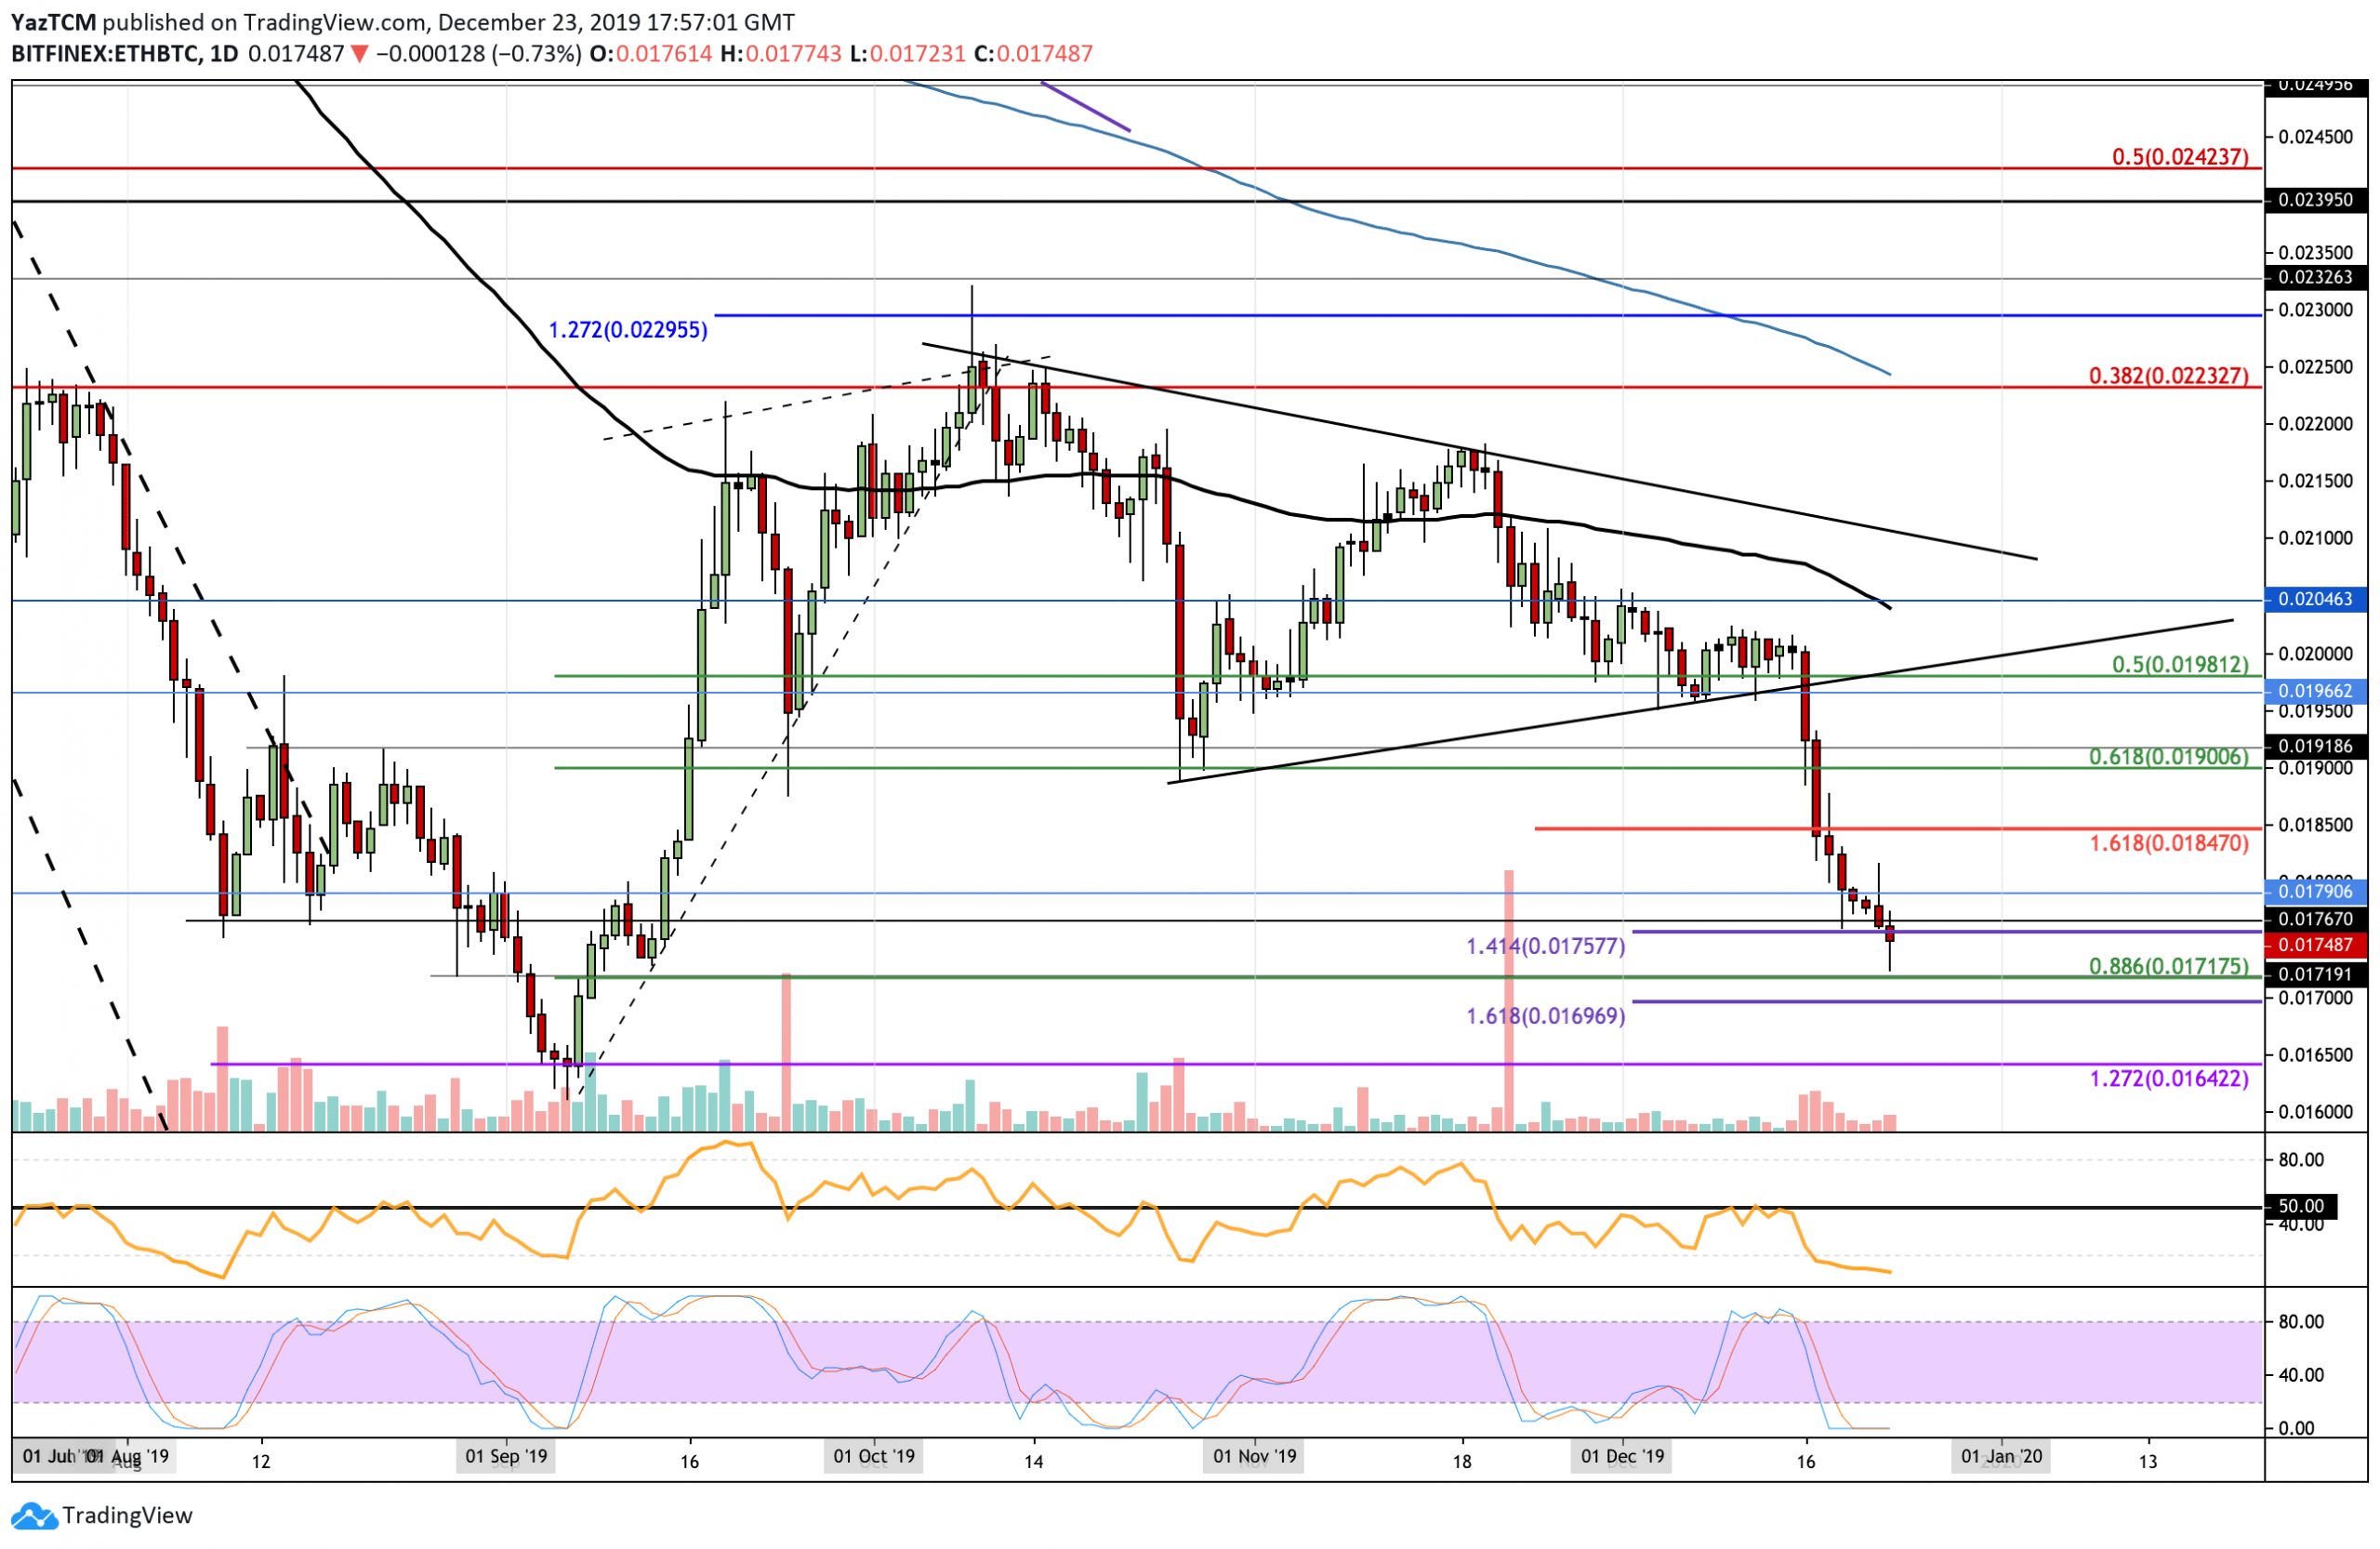
Support: 0.0171 BTC, 0.0169 BTC, 0.0164 BTC.
Resistance: 0.0179 BTC, 0.0184 BTC, 0.019 BTC.
ETH/USD: ETH Struggles To Break $133.50 Resistance
Since our last analysis, ETH managed to find strong support at the lower boundary of the descending price channel. After rebounding, the cryptocurrency started to rise but was unable to overcome the strong resistance at $133.50. This level had provided strong support during November and is expected to provide an equal level of resistance moving forward.
For ETH to be considered as bullish, it must rise above the December high at $152. If ETH were to slip beneath $120, then the market would be considered as bearish.
Ethereum Short Term Price Prediction
If the resistance at $133.50 proves to be too strong, immediate support lies at $128. Beneath this, added support is found at $120, $118.19, and $116.23. Alternatively, if the bulls break above the $133.50 resistance, added resistance is found at $145 and $152. Beyond this, higher resistance is expected at $158, $165, and the upper boundary of the price channel.
The RSI has been rising, which shows that the selling momentum is starting to fade. However, the RSI must break above the 50 level for Ethereum to head toward the $150 price level.
Against Bitcoin, ETH has struggled after sliding beneath the support at 0.019 BTC. The cryptocurrency continued to plummet as it smashed beneath support at 0.0185 BTC, 0.018 BTC, and 0.0175BTC to reach the current trading level of 0.01748 BTC. It traveled as low as 0.0171 BTC (.886 Fib Retracement) before bouncing back higher.
The latest price drop now puts ETH on a strong bearish trajectory. If ETH continues to drop beneath the support at 0.0171 BTC, then it is likely to head much further lower toward 0.016 BTC. Alternatively, to turn bullish, it must break above the 0.02 BTC level.
Ethereum Short Term Price Prediction
If the selling pressure continues to drive ETH lower, immediate support is found at 0.0171 BTC. Beneath this, added support is located at 0.0169 BTC (downside 1.618 Fib Extension) and at 0.0164 BTC (September support). Alternatively, if the bulls regroup and begin to climb higher, an initial resistance is located at 0.0179 BTC. Above this, resistance is found at 0.00185 BTC, 0.019 BTC, and 0.0198 BTC.
The RSI has plummetted to extreme oversold conditions, which shows that the sellers have a very strong grip on the market momentum. Furthermore, the Stochastic RSI is also in extremely oversold conditions as we wait for a bullish crossover signal to send the market higher.


