Summary:
Litecoin saw a sharp price decline of around 12% over the past 24 hours and it currently trades at .34. LTC is now down by a total of 21% over the past week which is largely a result of Bitcoin dropping by 10% in a day. LTC remains the sixth-largest cryptocurrency with a market cap of .96 billion.LTC has plummetted pretty aggressively over the past 24 hours as it dropped below the support at to reach the current support at .41. Litecoin has been on a bearish trend since late June as the cryptocurrency made fresh 9-month lows.From above: The nearest level of resistance lies at . Above this, resistance is located at and . Higher resistance is expected at (100-days EMA) and .80 (200-days EMA).From below: The nearest level of support lies at .31. Beneath this,
Topics:
Yaz Sheikh considers the following as important: Litecoin Price, LTC, Price Analysis
This could be interesting, too:
Bitcoin Schweiz News writes Litecoin jetzt in der Telegram-Wallet verfügbar!
Mayowa Adebajo writes SUI Surpasses LTC in Market Cap, Achieves Major Milestones Including B in TVL
CryptoVizArt writes ETH’s Path to K Involves Maintaining This Critical Support (Ethereum Price Analysis)
Leon Okwatch writes Litecoin Faces Mounting Pressure as Market Value Declines
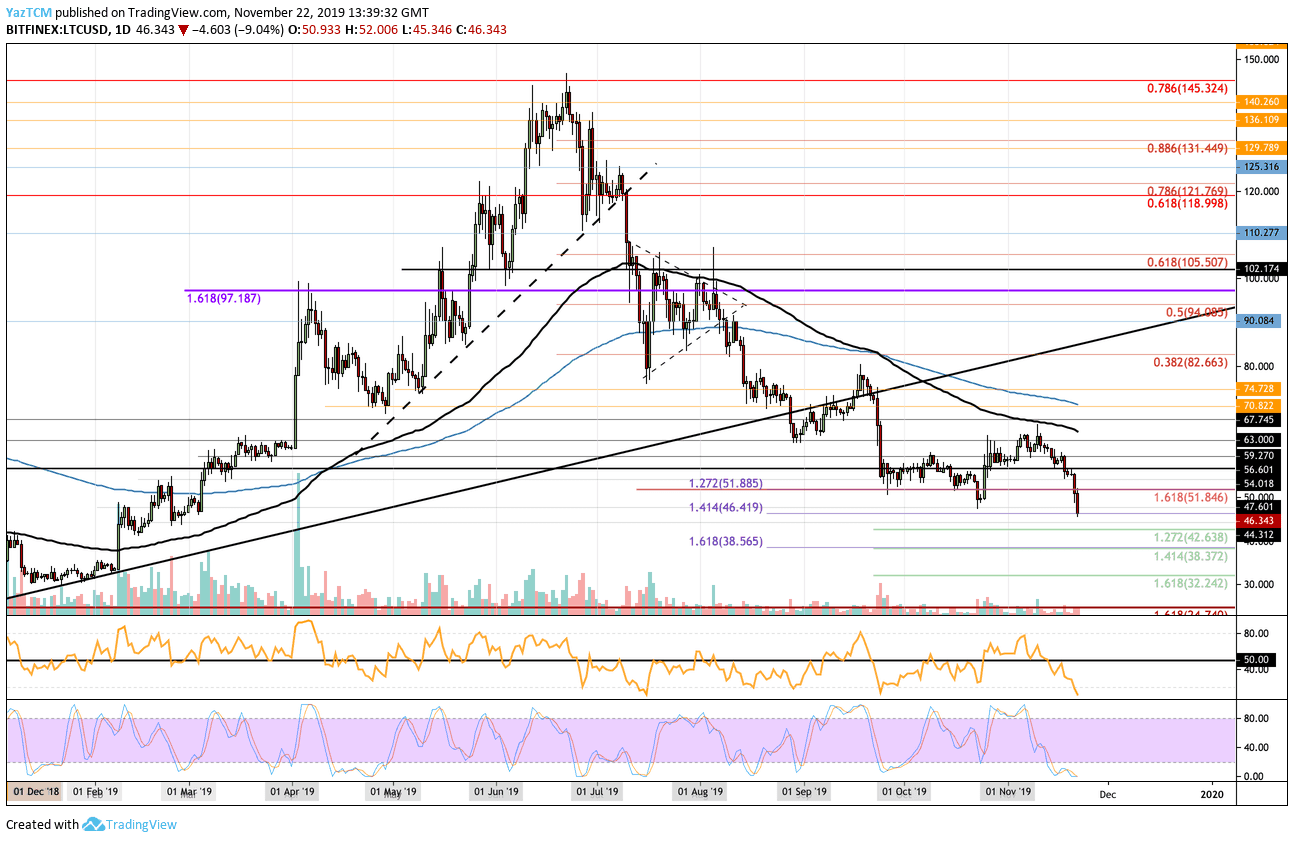
Litecoin saw a sharp price decline of around 12% over the past 24 hours and it currently trades at $46.34. LTC is now down by a total of 21% over the past week which is largely a result of Bitcoin dropping by 10% in a day.
LTC remains the sixth-largest cryptocurrency with a market cap of $2.96 billion.
- LTC has plummetted pretty aggressively over the past 24 hours as it dropped below the support at $50 to reach the current support at $46.41. Litecoin has been on a bearish trend since late June as the cryptocurrency made fresh 9-month lows.
- From above: The nearest level of resistance lies at $50. Above this, resistance is located at $54 and $60. Higher resistance is expected at $64 (100-days EMA) and $70.80 (200-days EMA).
- From below: The nearest level of support lies at $44.31. Beneath this, support is found at $40 and $38.56 (downside 1.618 Fib Extension). The final level of support to highlight is located at $32.24.
- The trading volume remains pretty low, beneath the average for the year.
- The Stochastic RSI is in oversold conditions as we wait for a bullish crossover signal to send the market higher. For a sign that the selling pressure is fading, we will look for the RSI to start to climb higher toward the 50 level.
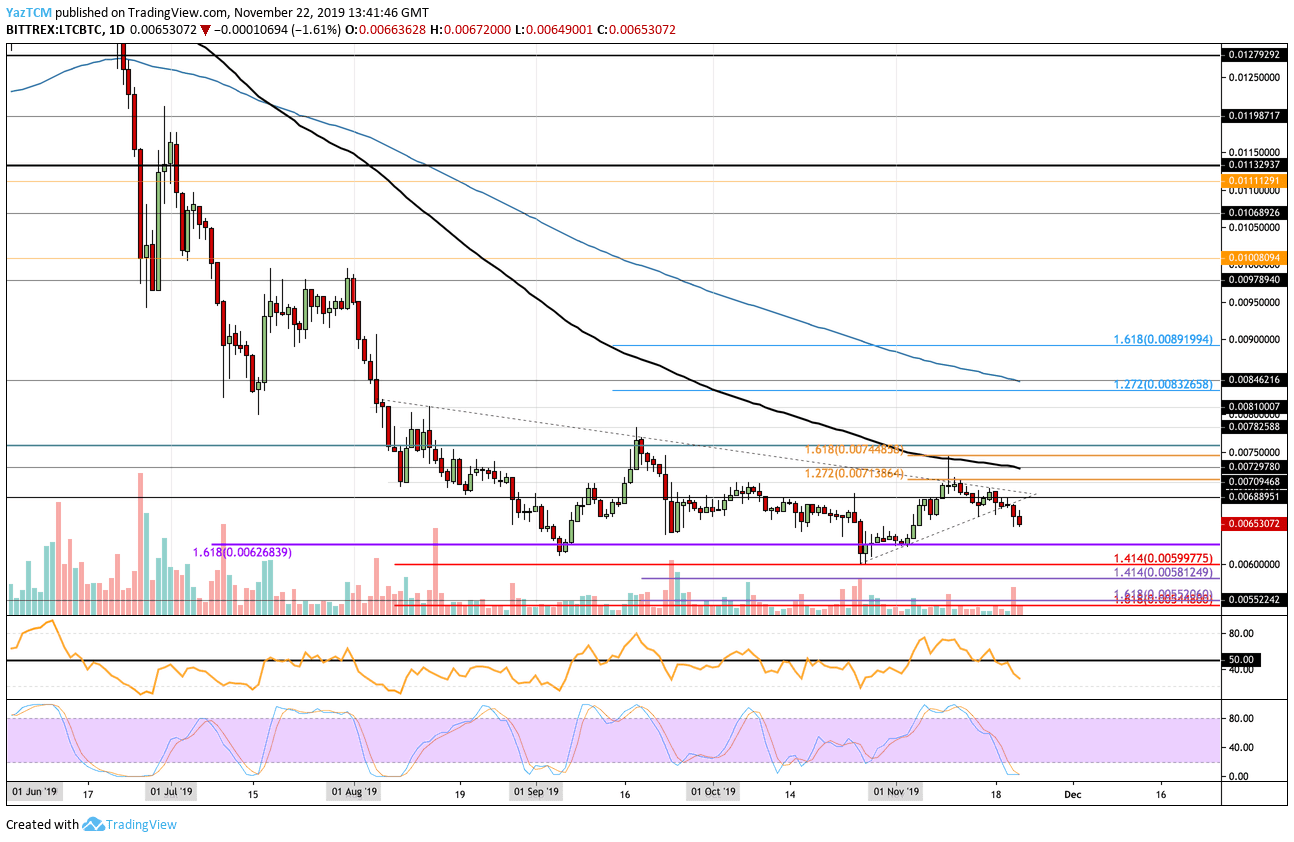
- Against Bitcoin, LTC fell lower as it breaks beneath a short term triangle. Litecoin currently trades at 0.006BTC as the bulls battle to prevent it from heading further lower.
- From above: The nearest level of resistance lies at 0.0068BTC. Higher resistance is expected at 0.0071 BTC, 0.007297 BTC (100-days EMA).
- From below: The nearest level of support lies at 0.0064 BTC. Beneath this, support is located at 0.0062 BTC and then at 0.005812 BTC.
- The trading volume has increased during the latest round of selling.
- The Stochastic RSI is poised for a bullish crossover that could begin the rebound for the cryptocurrency.