XRP fell beneath the strong support at %excerpt%.215 this week after slipping by 5%.Against BTC, it is struggling to hold the 3000 SAT support.XRP remains wedged within a descending channel against BTC and must break this to climb higher.Key Support & Resistance LevelsXRP/USDSupport: %excerpt%.212, %excerpt%.20, %excerpt%.185 Resistance: %excerpt%.2345, %excerpt%.2520, %excerpt%.27XRP/BTC:Support: 3000 SAT, 2900 SAT, 2855 SATResistance: 3200 SAT, 3325 SAT, 3500 SATXRP/USD: Breaks Beneath Strong %excerpt%.215 Сupport The daily chart shows XRP sliding beneath the %excerpt%.215 support level in today’s trading session. It dipped down to as low as %excerpt%.21 but has since bounced back higher as it sits above the support at %excerpt%.212 (downside 1.272 Fibonacci Extension level). The cryptocurrency is still within a range between %excerpt%.212 and %excerpt%.234, but the bears may
Topics:
Yaz Sheikh considers the following as important: Ripple (XRP) Price, XRP Analysis
This could be interesting, too:
Jordan Lyanchev writes Ripple’s (XRP) Surge to Triggers Over Million in Short Liquidations
Jordan Lyanchev writes Trump Confirms Work on Strategic Crypto Reserve: XRP, ADA, SOL Included
Mandy Williams writes Ripple Releases Institutional DeFi Roadmap for XRP Ledger in 2025
Jordan Lyanchev writes ChatGPT and DeepSeek Analyze Ripple’s (XRP) Price Potential for 2025
- XRP fell beneath the strong support at $0.215 this week after slipping by 5%.
- Against BTC, it is struggling to hold the 3000 SAT support.
- XRP remains wedged within a descending channel against BTC and must break this to climb higher.
Key Support & Resistance Levels
XRP/USD
Support: $0.212, $0.20, $0.185
Resistance: $0.2345, $0.2520, $0.27
XRP/BTC:
Support: 3000 SAT, 2900 SAT, 2855 SAT
Resistance: 3200 SAT, 3325 SAT, 3500 SAT
XRP/USD: Breaks Beneath Strong $0.215 Сupport
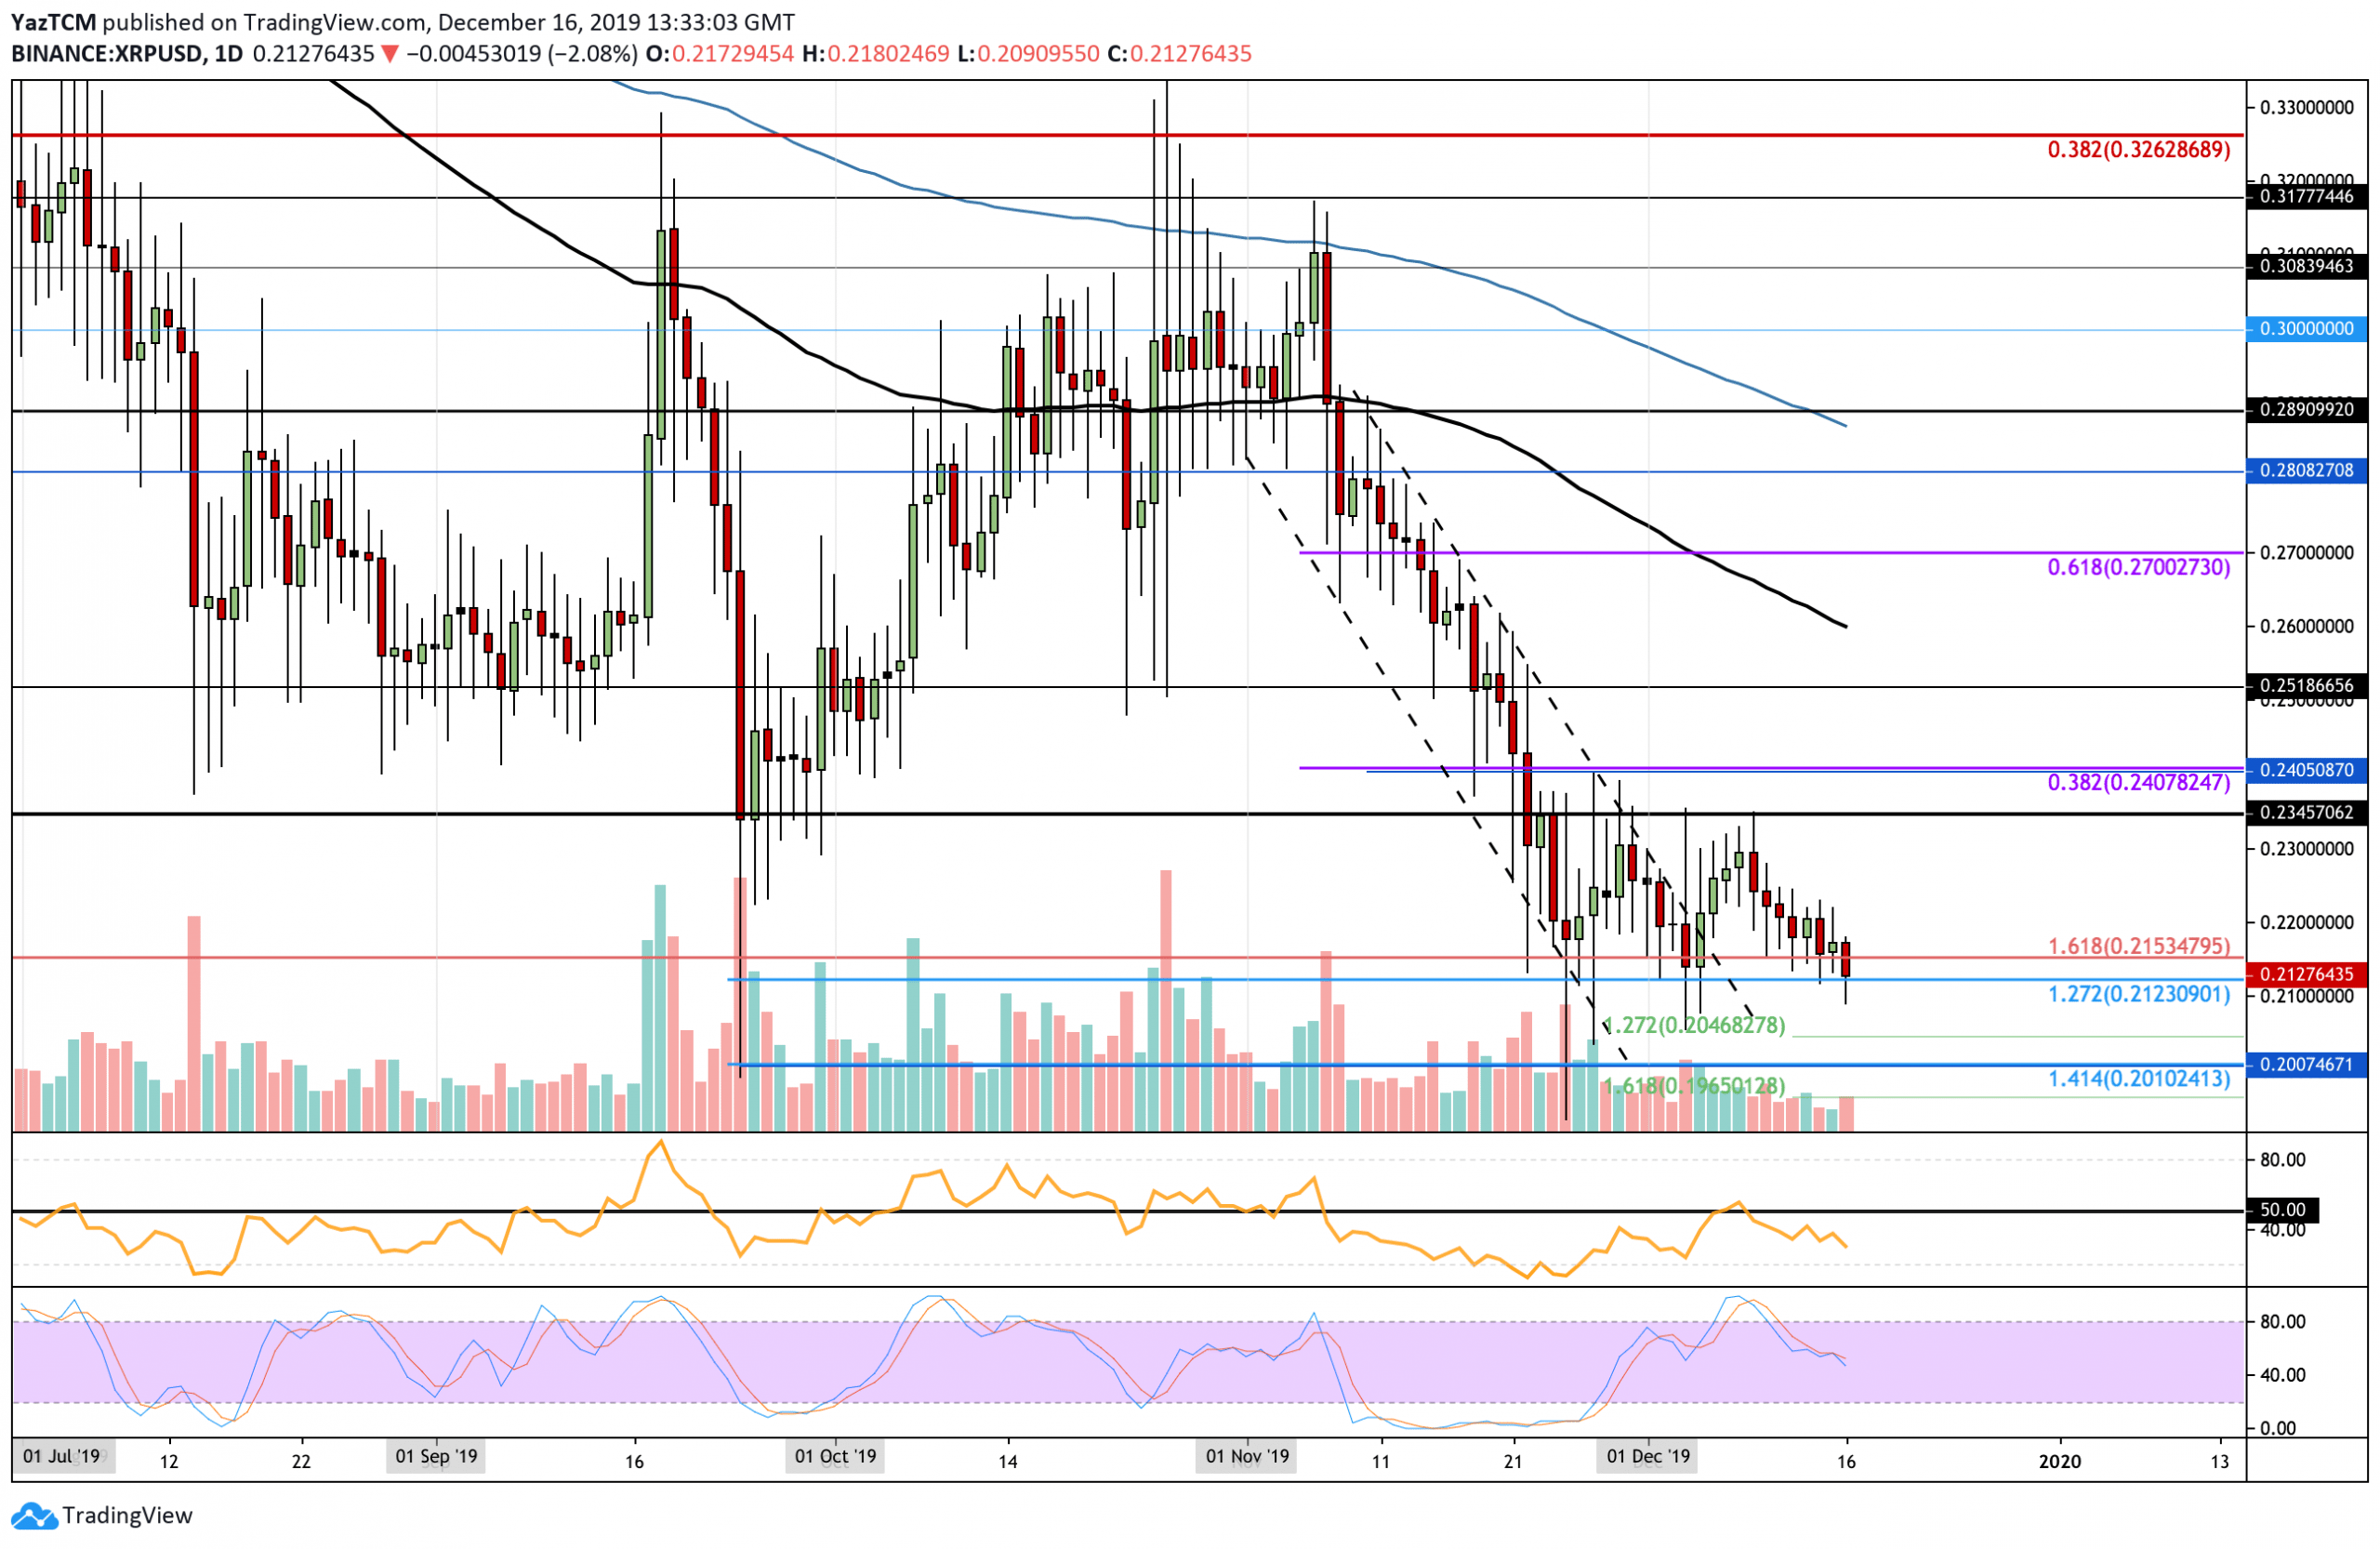
The daily chart shows XRP sliding beneath the $0.215 support level in today’s trading session. It dipped down to as low as $0.21 but has since bounced back higher as it sits above the support at $0.212 (downside 1.272 Fibonacci Extension level). The cryptocurrency is still within a range between $0.212 and $0.234, but the bears may have managed to take control over the market.
If XRP were to close beneath the support at $0.212, then the market would be considered as bearish. To turn bullish in the short term, it must break above the $0.234 level.
XRP Short Term Price Prediction
If the sellers do push the market below the current $0.212 level, initial support toward the downside can be expected at $0.210. Beneath this, added support can be found at $0.200 (downside 1.414 Fib Extension) and $0.196. Alternatively, if the buyers rebound from the $0.2123 support, immediate resistance is located at $0.22 and $0.23. Above this, resistance can be found at $0.2345 (December highs) and $0.24.
The RSI is beneath the 50 level, which shows that the sellers are in control over the market momentum. Furthermore, the Stochastic RSI is hanging in the balance as it sits around the 50 level itself. This shows that, unless the bulls can regroup and climb higher, there is still a lot of room for the market to head lower.
XRP/BTC: XRP Trapped Within A Descending Channel
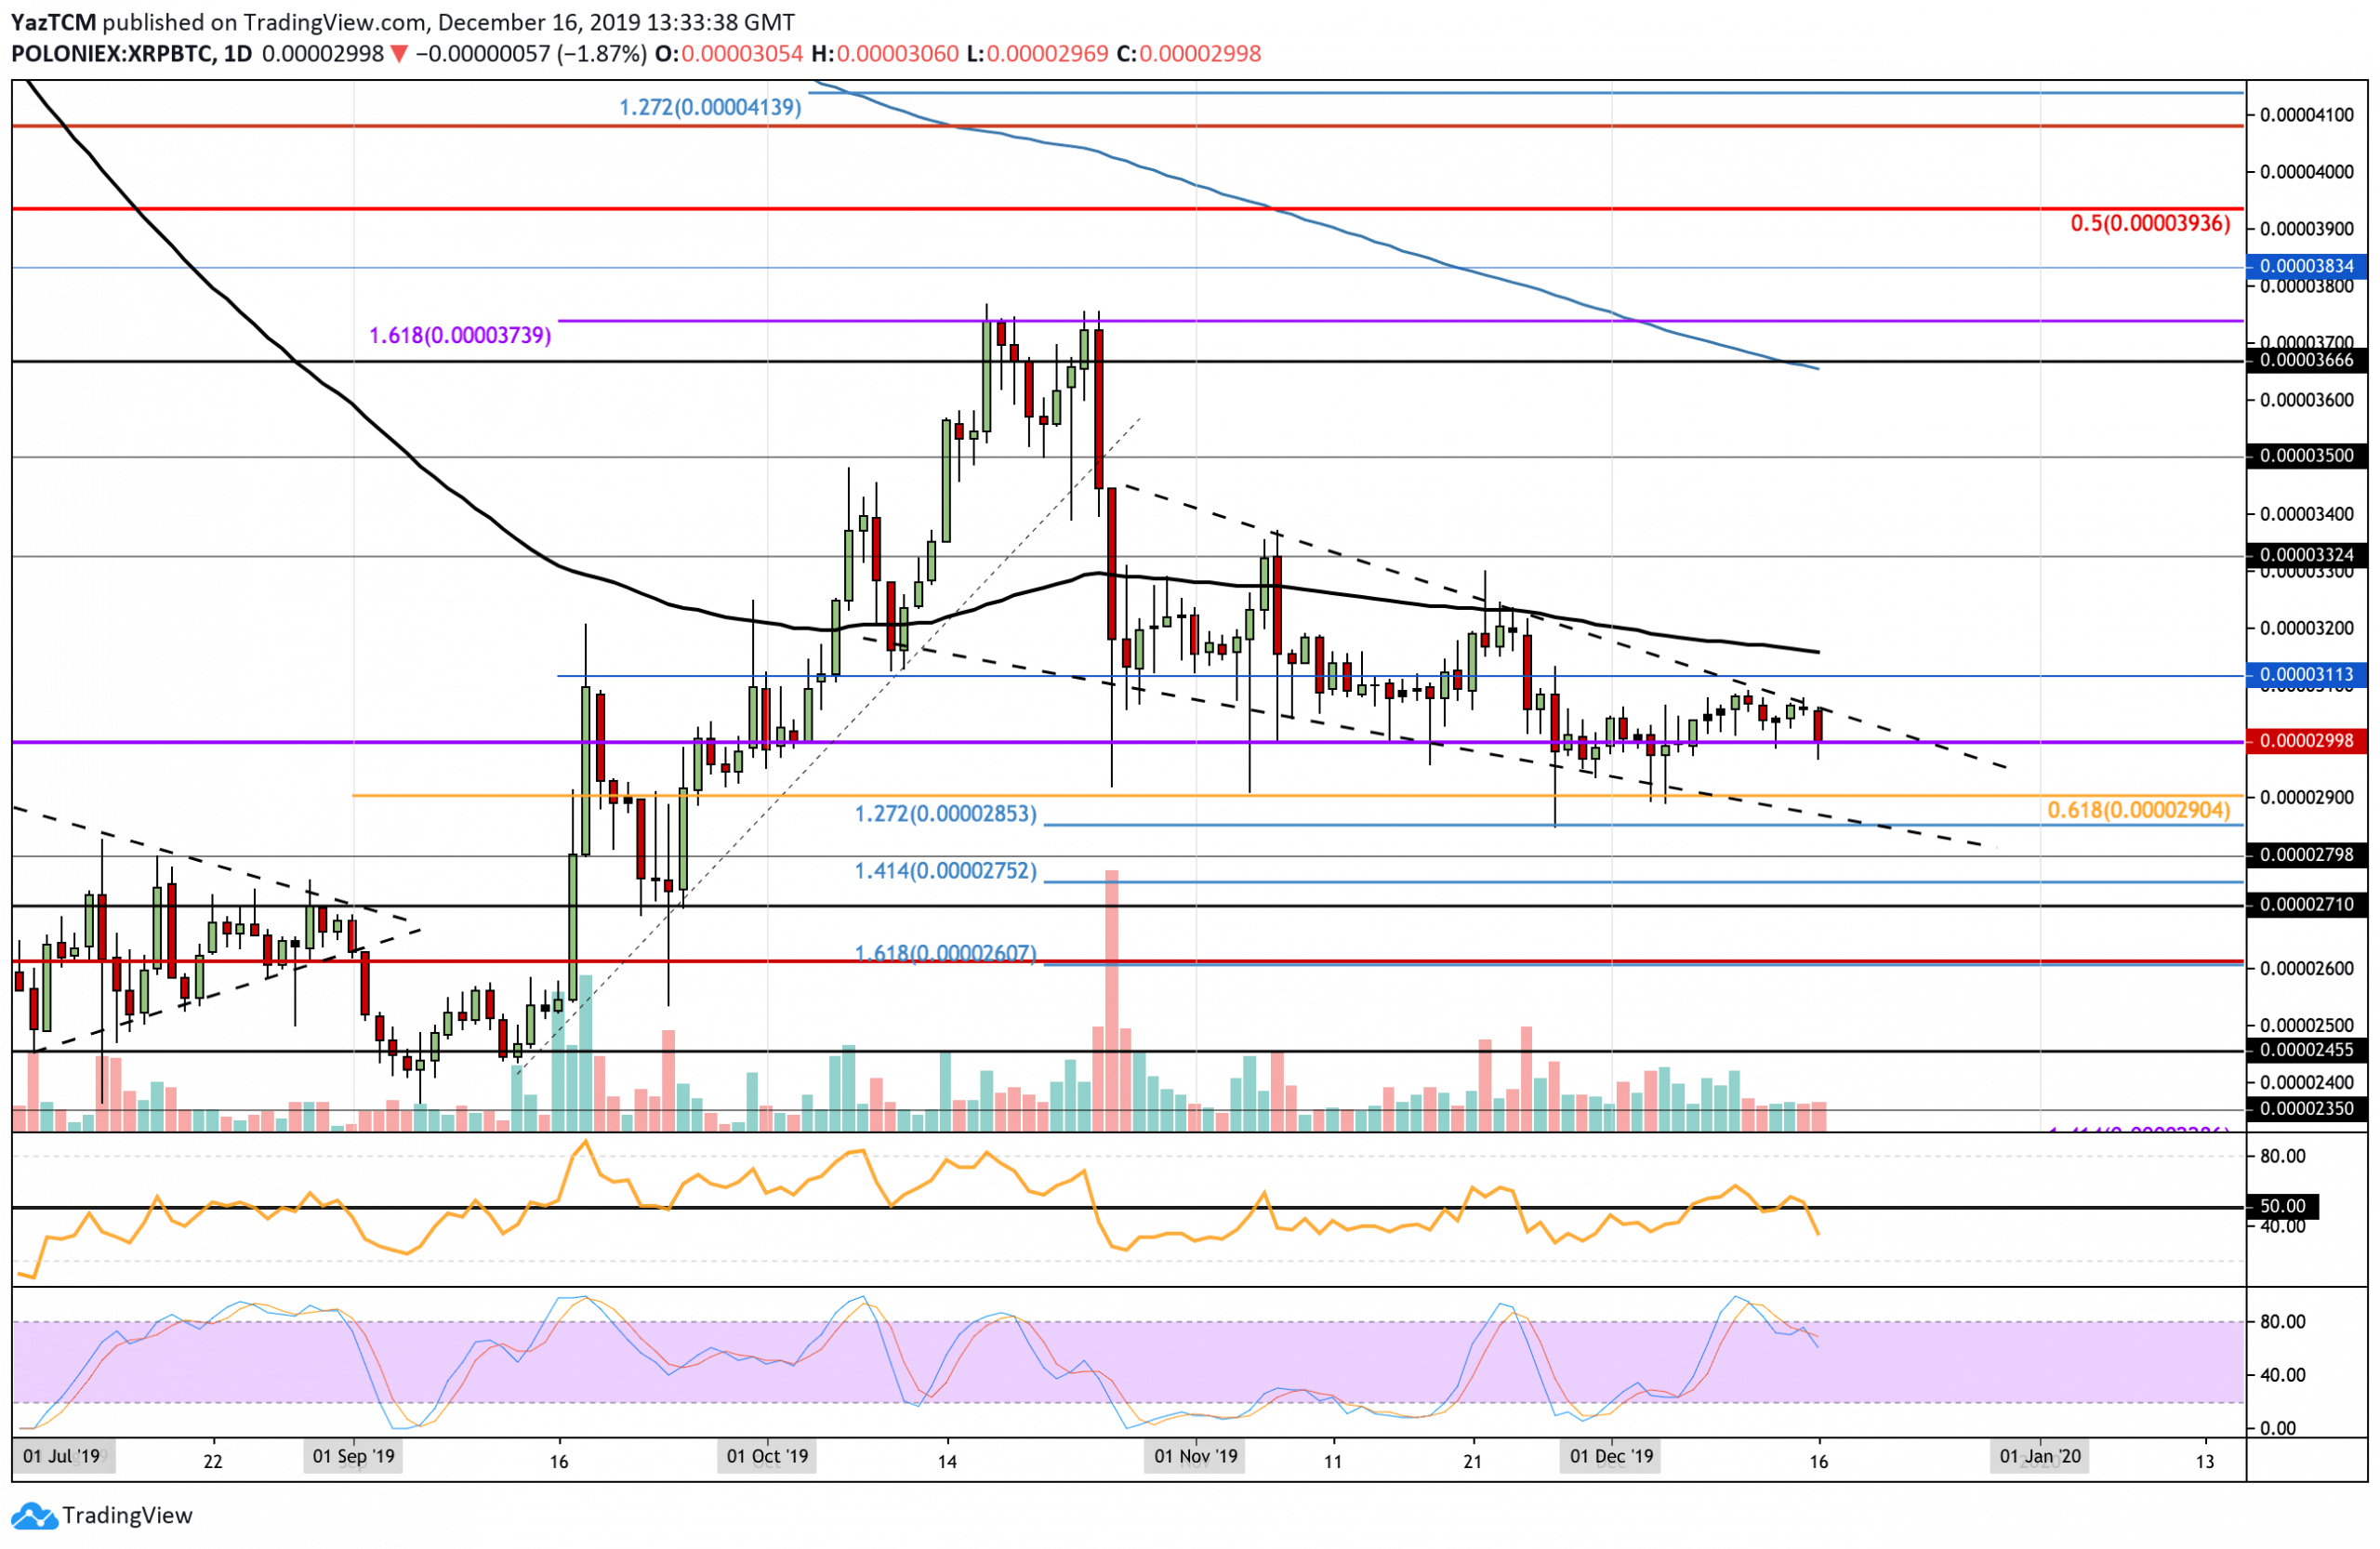
Against BTC, XRP did manage to bounce at the 3000 SAT support but failed to break above the strong resistance at the upper boundary of the 2-month old descending channel. This caused it to fall back into the 3000 SAT support level.
A break beneath 3000 SAT could send the cryptocurrency on a bearish spiral. For XRP to turn bullish, the coin must break above the upper boundary of the channel and push above 3200 SATS.
XRP Short Term Price Prediction
If the sellers continue to push XRP beneath the 3000 SAT support level, immediate support is located at 2900 SAT (.618 Fib Retracement). Beneath this, support is then located at the lower boundary of the channel (at around 2850 SAT). If XRP drops beneath the channel, added support can be found at 2750 SAT and 2600 SAT.
On the other hand, if the buyers manage to hold the support at 3000 SAT and bounce higher, they will be met by resistance at the upper boundary of the channel. Above this, resistance lies at 3200 SAT (100-days EMA), 3325 SAT (November highs), and 3500 SAT.