XRP dropped by a precipitous 18% this week, causing it to drop beneath %excerpt%.20 to reach %excerpt%.1830.Against BTC, the coin finally broke beneath the 3000 SAT support after weeks of struggling to hold the area.This latest price drop has caused XRP to create fresh multi-year lows not seen since December 2017.Key Support & Resistance LevelsXRP/USDSupport: %excerpt%.181, %excerpt%.17, %excerpt%.167. Resistance: %excerpt%.185, %excerpt%.19, %excerpt%.20.XRP/BTC:Support: 2710 SAT, 2530 SAT, 2455 SAT.Resistance: 2752 SAT, 2900 SAT, 3000 SAT.XRP/USD: Collapses Beneath %excerpt%.20 But Holding At %excerpt%.181.The daily chart shows XRP collapsing beneath the previously highlighted support at %excerpt%.212. The cryptocurrency then went on to collapse beneath support at %excerpt%.20, %excerpt%.19, and %excerpt%.185 to reach the current support at around %excerpt%.181.XRP is now battling to hold
Topics:
Yaz Sheikh considers the following as important: Ripple (XRP) Price, XRP Analysis
This could be interesting, too:
Jordan Lyanchev writes Ripple’s (XRP) Surge to Triggers Over Million in Short Liquidations
Jordan Lyanchev writes Trump Confirms Work on Strategic Crypto Reserve: XRP, ADA, SOL Included
Mandy Williams writes Ripple Releases Institutional DeFi Roadmap for XRP Ledger in 2025
Jordan Lyanchev writes ChatGPT and DeepSeek Analyze Ripple’s (XRP) Price Potential for 2025
- XRP dropped by a precipitous 18% this week, causing it to drop beneath $0.20 to reach $0.1830.
- Against BTC, the coin finally broke beneath the 3000 SAT support after weeks of struggling to hold the area.
- This latest price drop has caused XRP to create fresh multi-year lows not seen since December 2017.
Key Support & Resistance Levels
XRP/USD
Support: $0.181, $0.17, $0.167.
Resistance: $0.185, $0.19, $0.20.
XRP/BTC:
Support: 2710 SAT, 2530 SAT, 2455 SAT.
Resistance: 2752 SAT, 2900 SAT, 3000 SAT.
XRP/USD: Collapses Beneath $0.20 But Holding At $0.181.
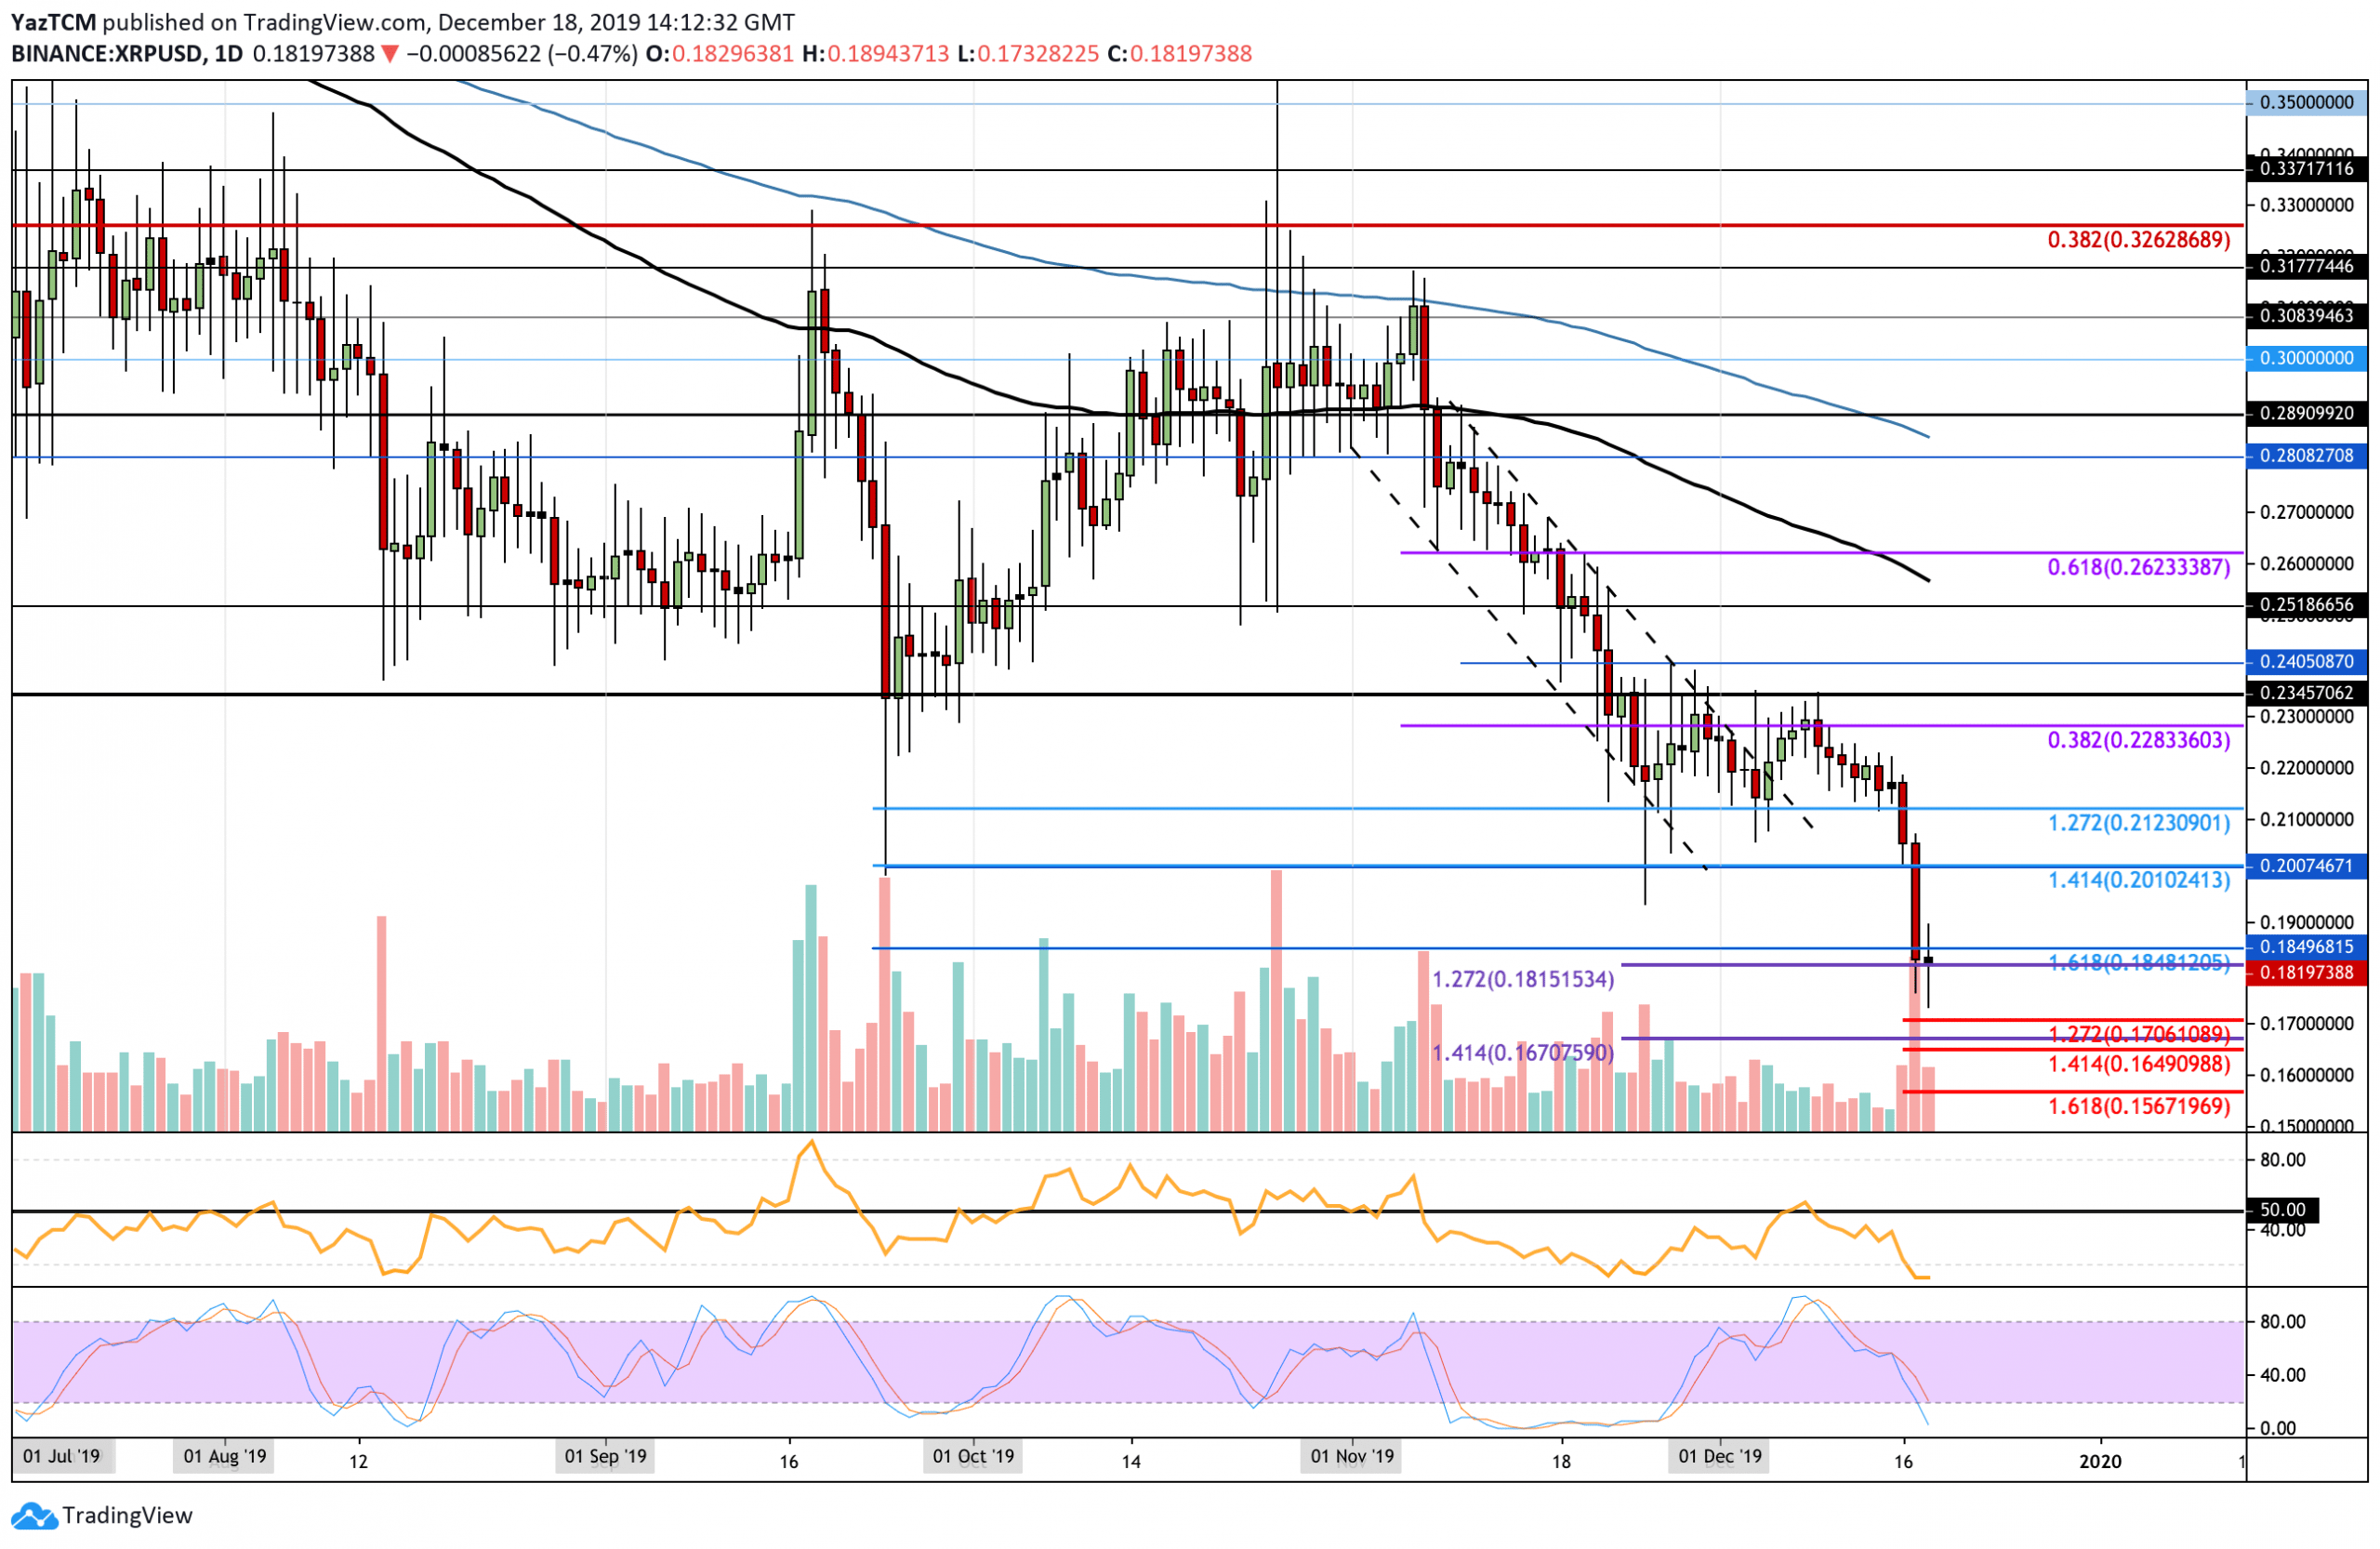
The daily chart shows XRP collapsing beneath the previously highlighted support at $0.212. The cryptocurrency then went on to collapse beneath support at $0.20, $0.19, and $0.185 to reach the current support at around $0.181.
XRP is now battling to hold the support at $0.191 provided by a downside 1.272 Fib Extension level. However, as the market is strongly bearish, XRP can be expected to continue its decline over the coming weeks. For this market to return to a neutral state, it must break back above the $0.21 resistance level.
XRP Short Term Price Prediction
If the sellers continue to add pressure to XRP and cause it to drop beneath the $0.1815 support, immediate support is then expected at $0.17. Beneath this, added support is found at $0.167, $0.165, and $0.156. Alternatively, if the bulls defend the current support and bounce higher, immediate resistance lies at $0.19 and $0.20. Above this, resistance is expected at $0.212.
The RSI is within extremely oversold conditions which suggest that the market may be a little overextended. For a sign that the bearish pressure is fading, look for the RSI to start to rise toward the 50 level.
XRP/BTC: XRP Finally Breaks Beneath 3000 SAT Causing Turbulence
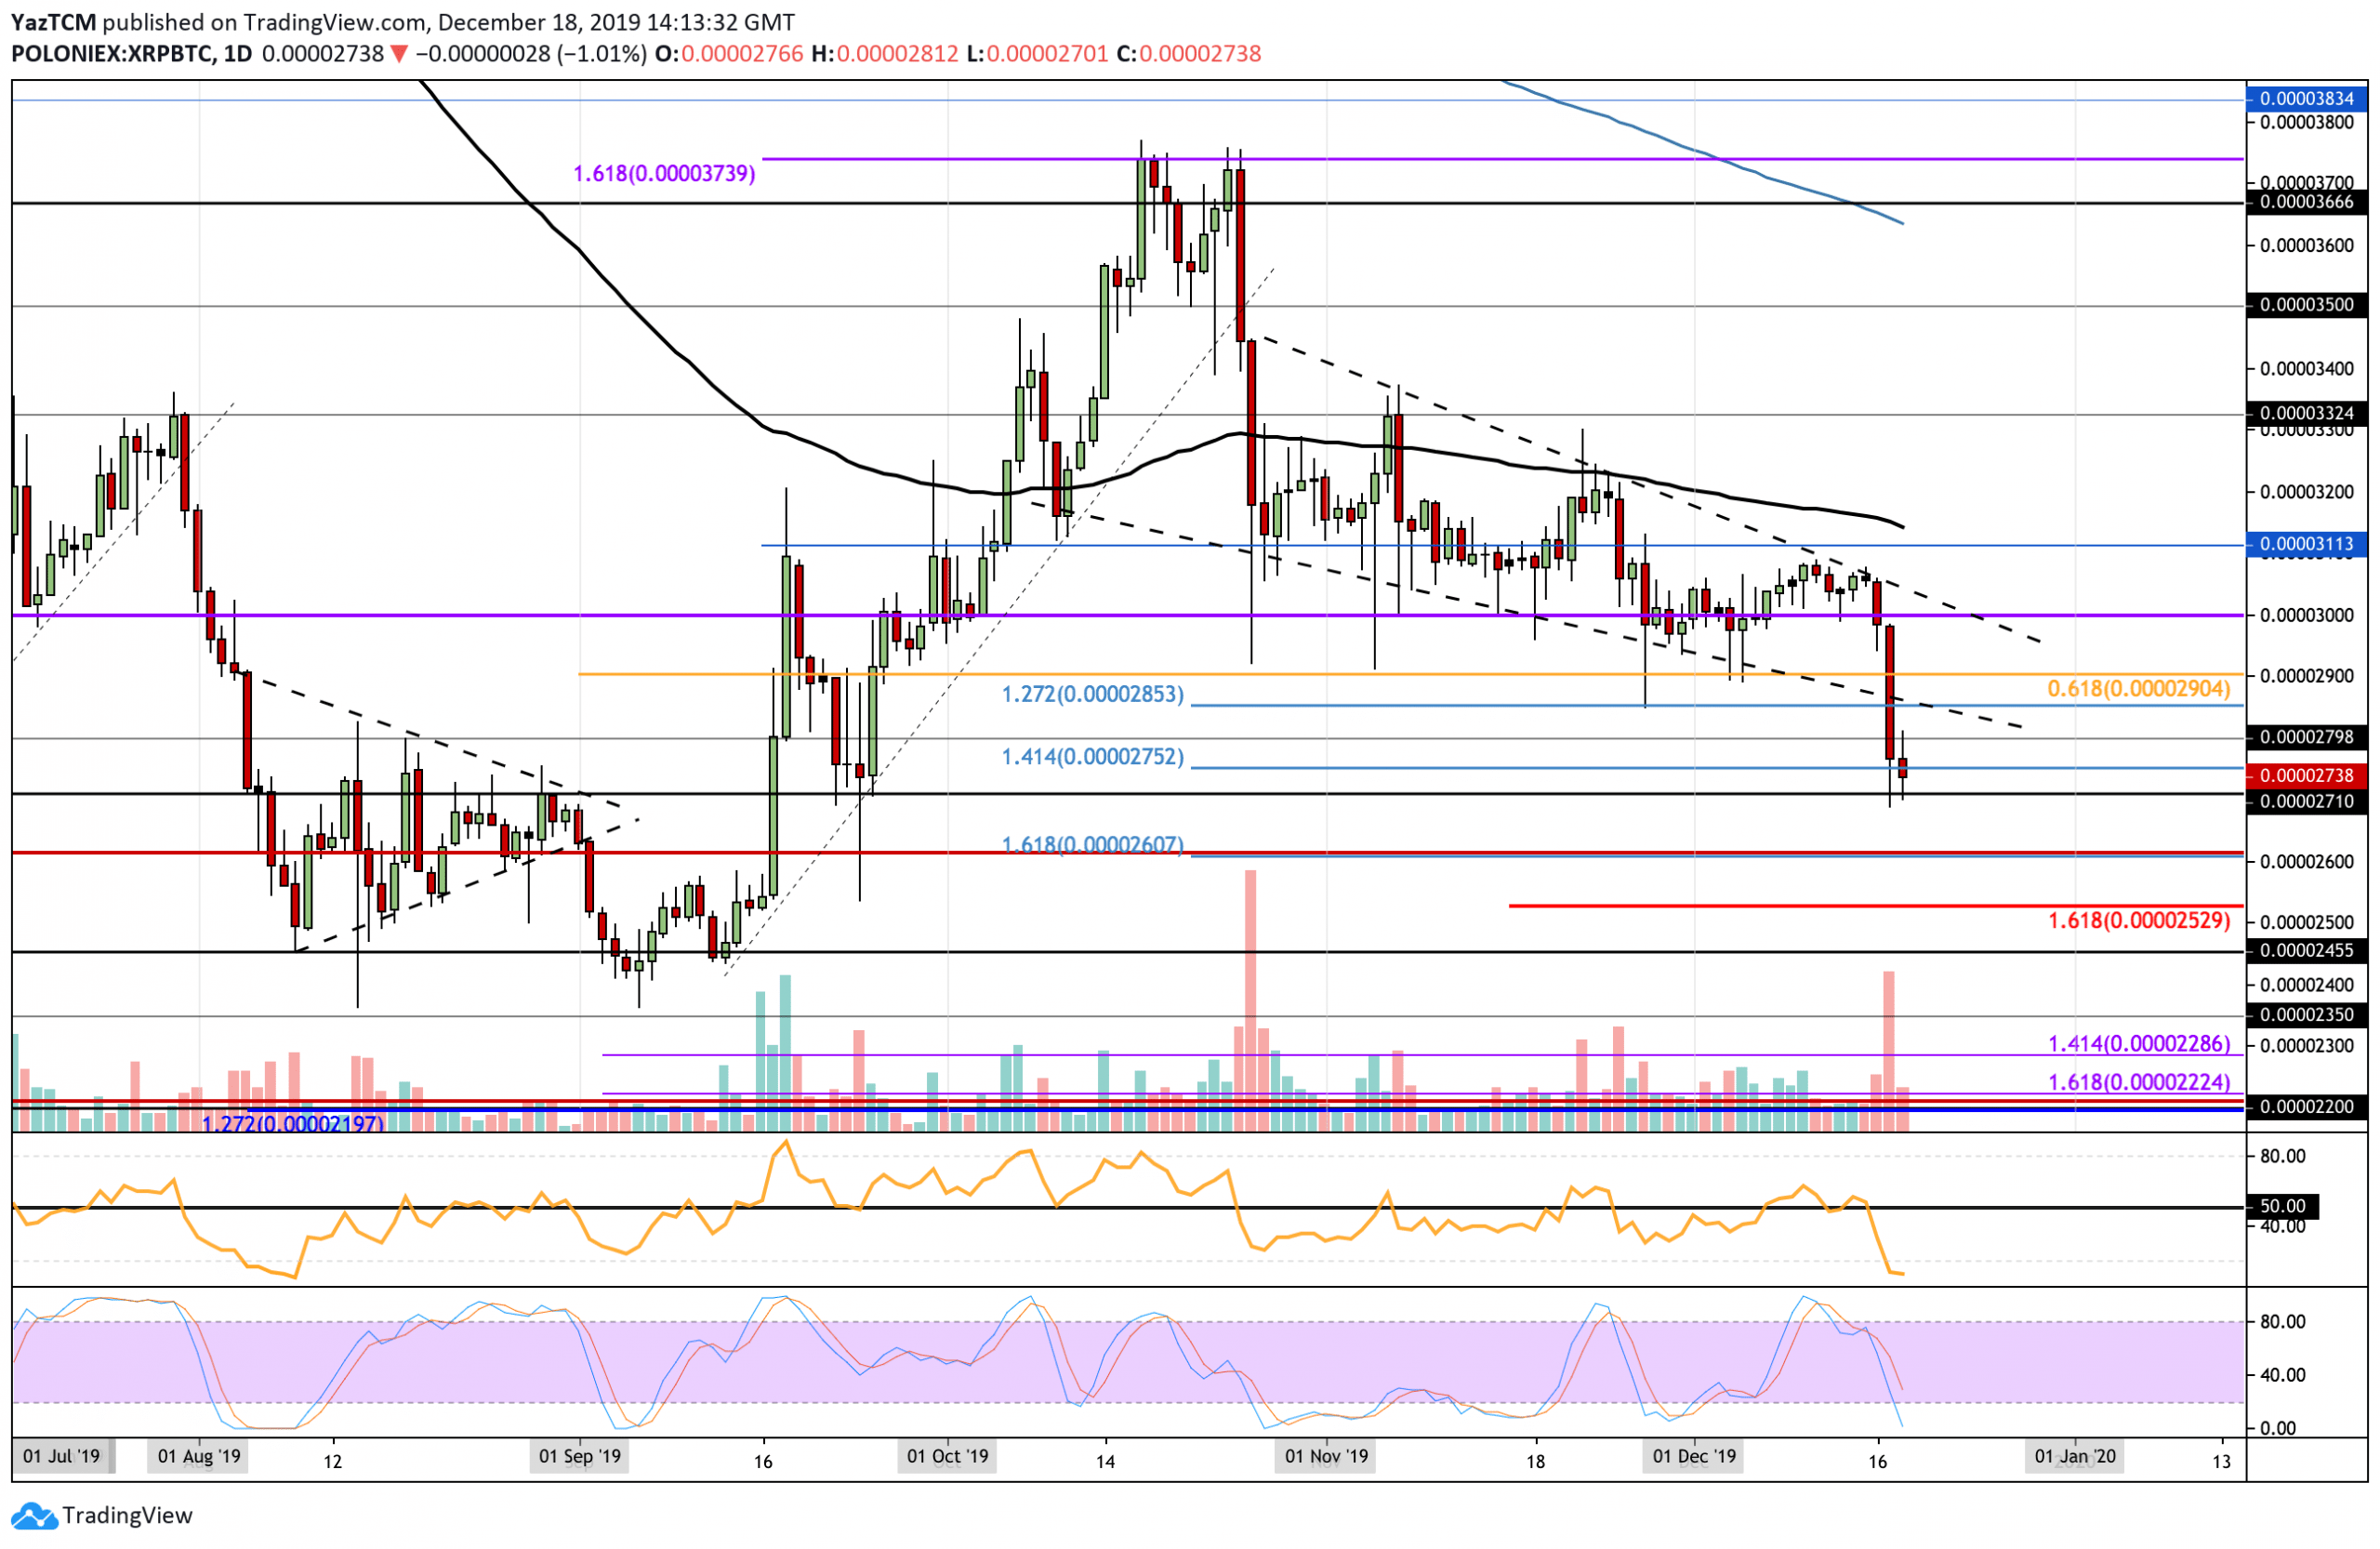
Against BTC, XRP collapsed beneath the previous descending wedge after breaking below the 3000 SAT level. It continued to fall until finding support at 2710 SAT. XRP has now bounced slightly higher from here but we can expect further turbulence during this strong bearish period.
For this coin to be considered as neutral again, XRP must rise above the 3000 SAT level. If XRP was to fall beneath the support at 2710 SAT, the bearish trend would continue.
XRP Short Term Price Prediction
If the sellers manage to push XRP beneath the current support at 2710 SAT, initial support lies at 2600 SAT. Beneath this, added support is expected at 2530 SAT, 2455 SAT, and 2350 SAT. Alternatively, if the buyers rebound from here, an initial resistance is located at 2800 SAT. Above this, resistance can be expected at 2853 SAT, 2900 SAT, and 3000 SAT.
Similarly, the RSI is within extreme oversold conditions after the recent price breakdown. If the RSI starts to rise back toward the 50 level, this can be considered as a sign that the selling pressure is fading.