Tezos fell by a steep 10% this week, making it the weakest performing altcoin out of the top 10 projects.Against Bitcoin, the cryptocurrency remains above strong support at 0.0002 BTC.Tezos still has surged by a total of 42% over the past three months as it climbs into the 10th ranked position.Key Support & Resistance LevelsXTZ/USDSupport: .50, .42, .29.Resistance: .64, .80, .88.XTZ/BTC:Support: 0.000189 BTC, 0.00018 BTC, 0.000167 BTC.Resistance: 0.00022 BTC, 0.00025 BTC, 0.000262 BTC..XTZ/USD: Tezos Finds Strong Support At .50Tezos continued to fall beneath the support at the .60 level after rolling over from the resistance at .80. The cryptocurrency continued to drop until support was reached at .50, and the bulls started to defend the area. Tezos is now on the
Topics:
Yaz Sheikh considers the following as important: Price Analysis, Tezos (XTZ) Price
This could be interesting, too:
CryptoVizArt writes ETH’s Path to K Involves Maintaining This Critical Support (Ethereum Price Analysis)
Duo Nine writes Crypto Price Analysis June-29: ETH, XRP, ADA, DOGE, and DOT
Duo Nine writes Crypto Price Analysis June-15: ETH, XRP, ADA, DOGE, and DOT
Duo Nine writes Why is the Shiba Inu (SHIB) Price Down Today?
- Tezos fell by a steep 10% this week, making it the weakest performing altcoin out of the top 10 projects.
- Against Bitcoin, the cryptocurrency remains above strong support at 0.0002 BTC.
- Tezos still has surged by a total of 42% over the past three months as it climbs into the 10th ranked position.
Key Support & Resistance Levels
XTZ/USD
Support: $1.50, $1.42, $1.29.
Resistance: $1.64, $1.80, $1.88.
XTZ/BTC:
Support: 0.000189 BTC, 0.00018 BTC, 0.000167 BTC.
Resistance: 0.00022 BTC, 0.00025 BTC, 0.000262 BTC..
XTZ/USD: Tezos Finds Strong Support At $1.50
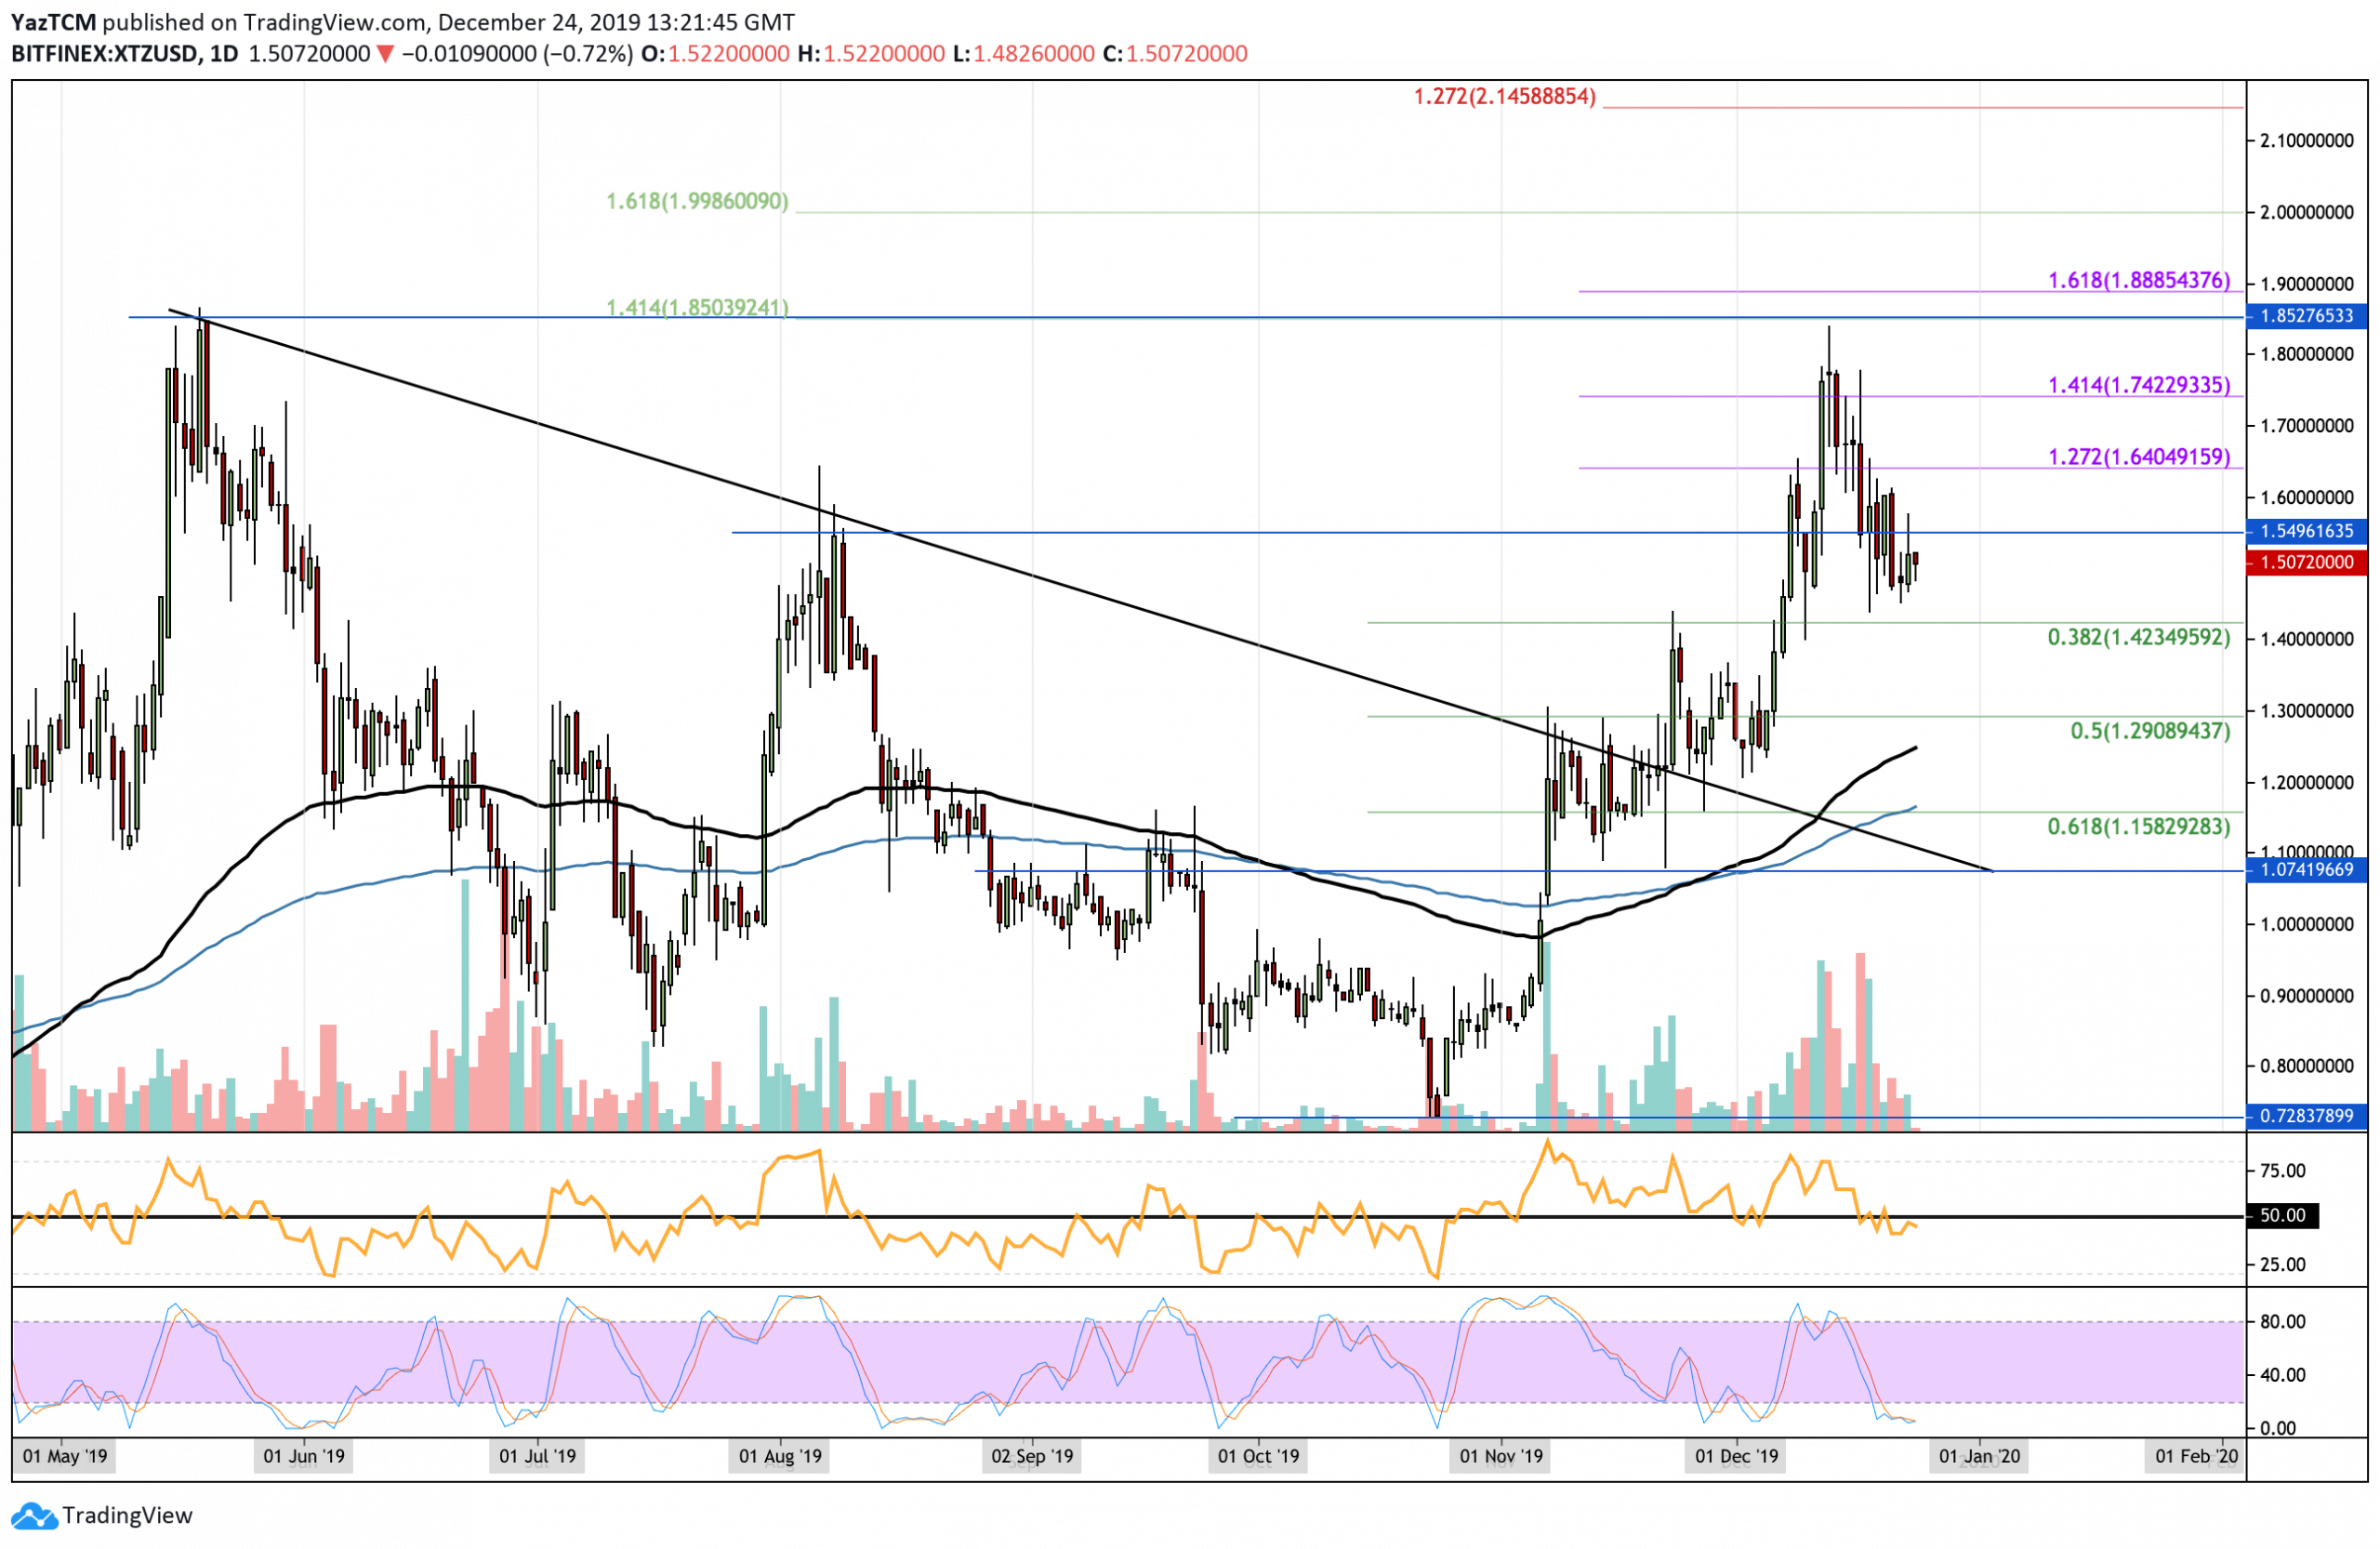
Tezos continued to fall beneath the support at the $1.60 level after rolling over from the resistance at $1.80. The cryptocurrency continued to drop until support was reached at $1.50, and the bulls started to defend the area.
Tezos is now on the bearish footing after dropping by a total of 18% over the past 12 days. If the sellers would continue to push Tezos beneath $1.50, the bearish trend would continue further lower. Alternatively, to turn bullish, it must rise and close above the $1.80 resistance level.
Tezos Short Term Price Prediction
If the bearish pressure persists and XTZ falls beneath $1.50, initial support is located at $1.42 (.382 Fib Retracement) and $1.29 (.5 FIb Retracement). Beneath this, additional support is found at $1.24 (100-days EMA) and $1.15 (.618 Fib Retracement and 200-days EMA). On the other hand, if the buyers defend the $1.50 region and push higher, an initial resistance is located at $1.64, $1.74, and $1.80. Beyond $1.80, higher resistance is found at $1.88 and $2.00.
The RSI has recently slipped beneath the 50 level for the first time in 2 months which shows that the sellers are starting to take control over the market momentum. However, the Stochastic RSI is trading within overbought conditions as we wait for a bullish crossover signal to send the market higher.
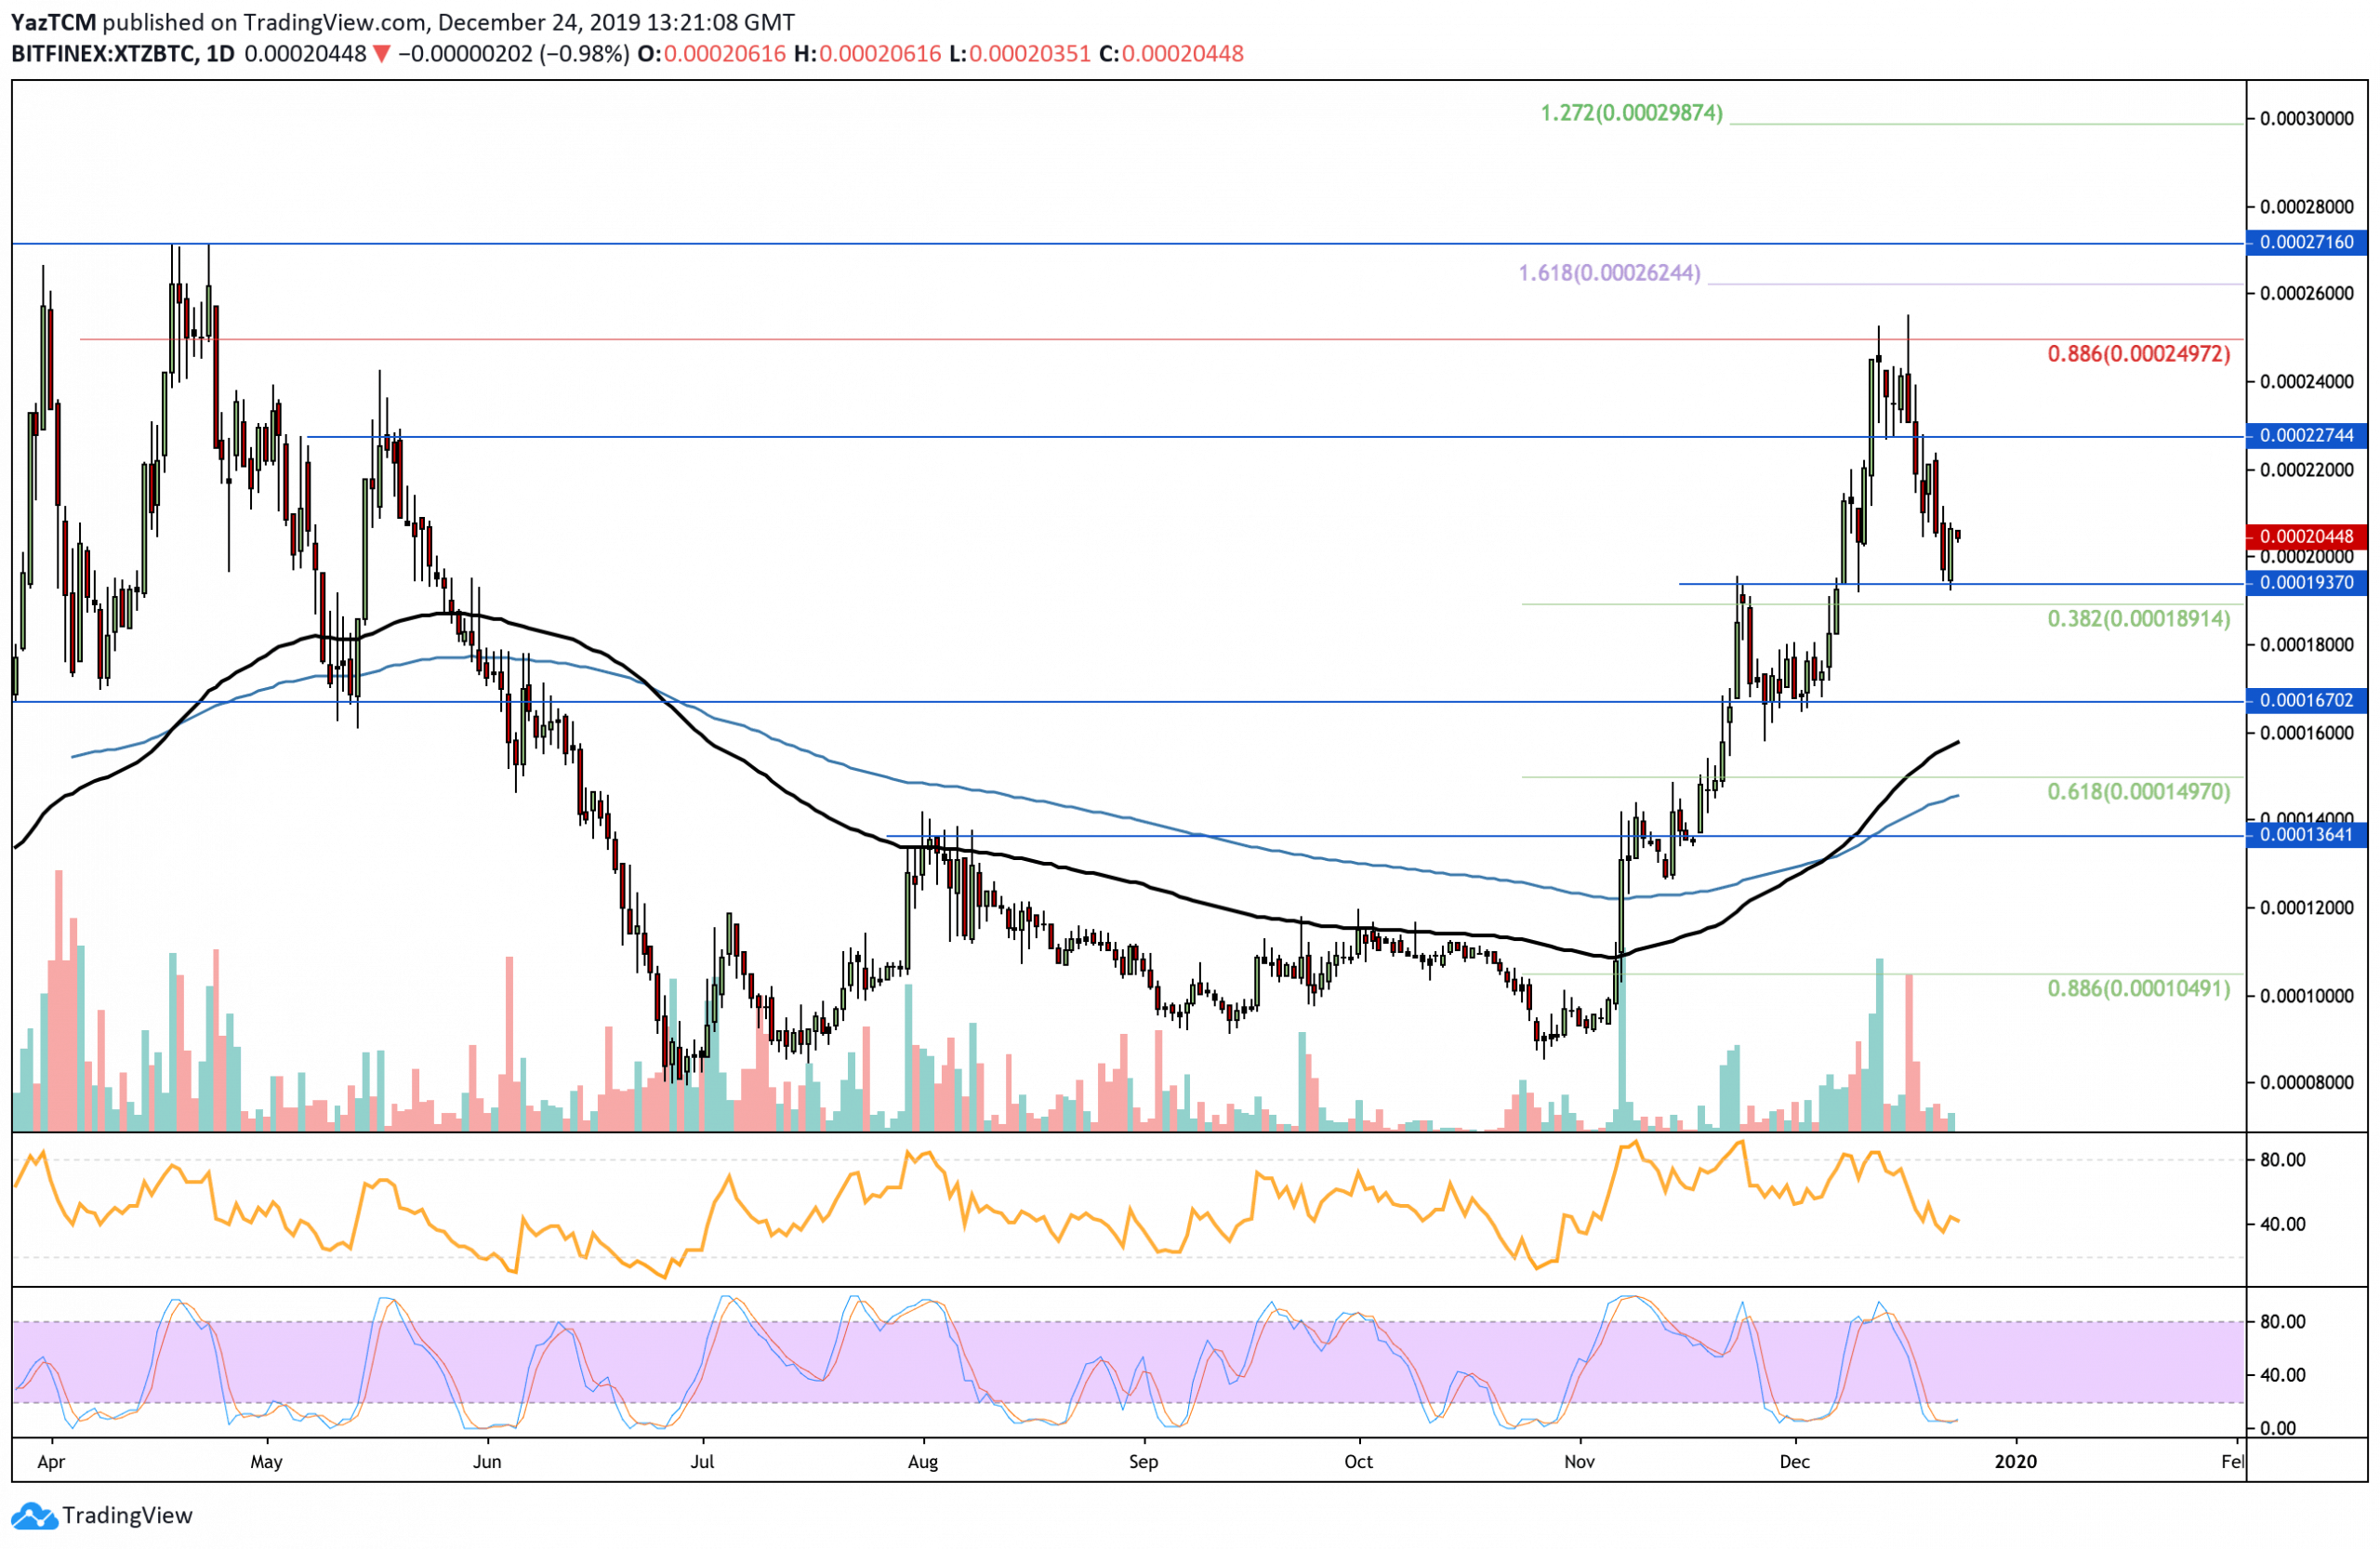
Against BTC, Tezos failed to climb over the resistance at the 0.00025 BTC level, causing it to roll over and fall. It dropped beneath 0.00020 BTC to find support at 0.000193 BTC – where the market rebounded.
If the sellers were to push Tezos further beneath the support at the 0.000193 BTC level, then it would be considered as a bearish market. Alternatively, to turn bullish, it must rise and break above the resistance at 0.00025 BTC.
Tezos Short Term Price Prediction
If the buyers manage to allow Tezos to climb higher from this area of support, an initial resistance is located at 0.00022 BTC and 0.00025 BTC (bearish .886 Fibonacci Retracement level). Above this, resistance lies at 0.000262 BTC 0.000271 BTC, and 0.00028 BTC. On the other hand, if the selling pushes XTZ beneath the support at 0.000193, additional support is found at 0.000189 BTC, 0.00018 BTC, and 0.000167 BTC.
Similarly, the Stochastic RSI is trading in extreme oversold conditions as we wait for a bullish crossover signal to send the market higher.