Tezos slipped by a further 10% this week but managed to find strong support at .30.Against Bitcoin, the cryptocurrency has rebounded after meeting support slightly beneath 0.00018 BTC.Today, XTZ is the only positive-performing cryptocurrency from the top projects. Key Support & Resistance LevelsXTZ/USDSupport: .29, .20, .15.Resistance: .42, .64, .74, .80..XTZ/BTC:Support: 0.000189 BTC, 0.00018 BTC, 0.000167 BTC.Resistance: 0.00022 BTC, 0.00025 BTC, 0.000262 BTC..XTZ/USD – Tezos Bounces At .30 Support LevelTezos continued to fall beneath the strong support at .50 this week. It continued to travel lower until finding recent support at .29 which is provided by the .5 Fibonacci Retracement level. XTZ has rebounded from this level of support as it presently trades at the
Topics:
Yaz Sheikh considers the following as important: Price Analysis, Tezos (XTZ) Price
This could be interesting, too:
CryptoVizArt writes ETH’s Path to K Involves Maintaining This Critical Support (Ethereum Price Analysis)
Duo Nine writes Crypto Price Analysis June-29: ETH, XRP, ADA, DOGE, and DOT
Duo Nine writes Crypto Price Analysis June-15: ETH, XRP, ADA, DOGE, and DOT
Duo Nine writes Why is the Shiba Inu (SHIB) Price Down Today?
- Tezos slipped by a further 10% this week but managed to find strong support at $1.30.
- Against Bitcoin, the cryptocurrency has rebounded after meeting support slightly beneath 0.00018 BTC.
- Today, XTZ is the only positive-performing cryptocurrency from the top projects.
Key Support & Resistance Levels
XTZ/USD
Support: $1.29, $1.20, $1.15.
Resistance: $1.42, $1.64, $1.74, $1.80..
XTZ/BTC:
Support: 0.000189 BTC, 0.00018 BTC, 0.000167 BTC.
Resistance: 0.00022 BTC, 0.00025 BTC, 0.000262 BTC..
XTZ/USD – Tezos Bounces At $1.30 Support Level
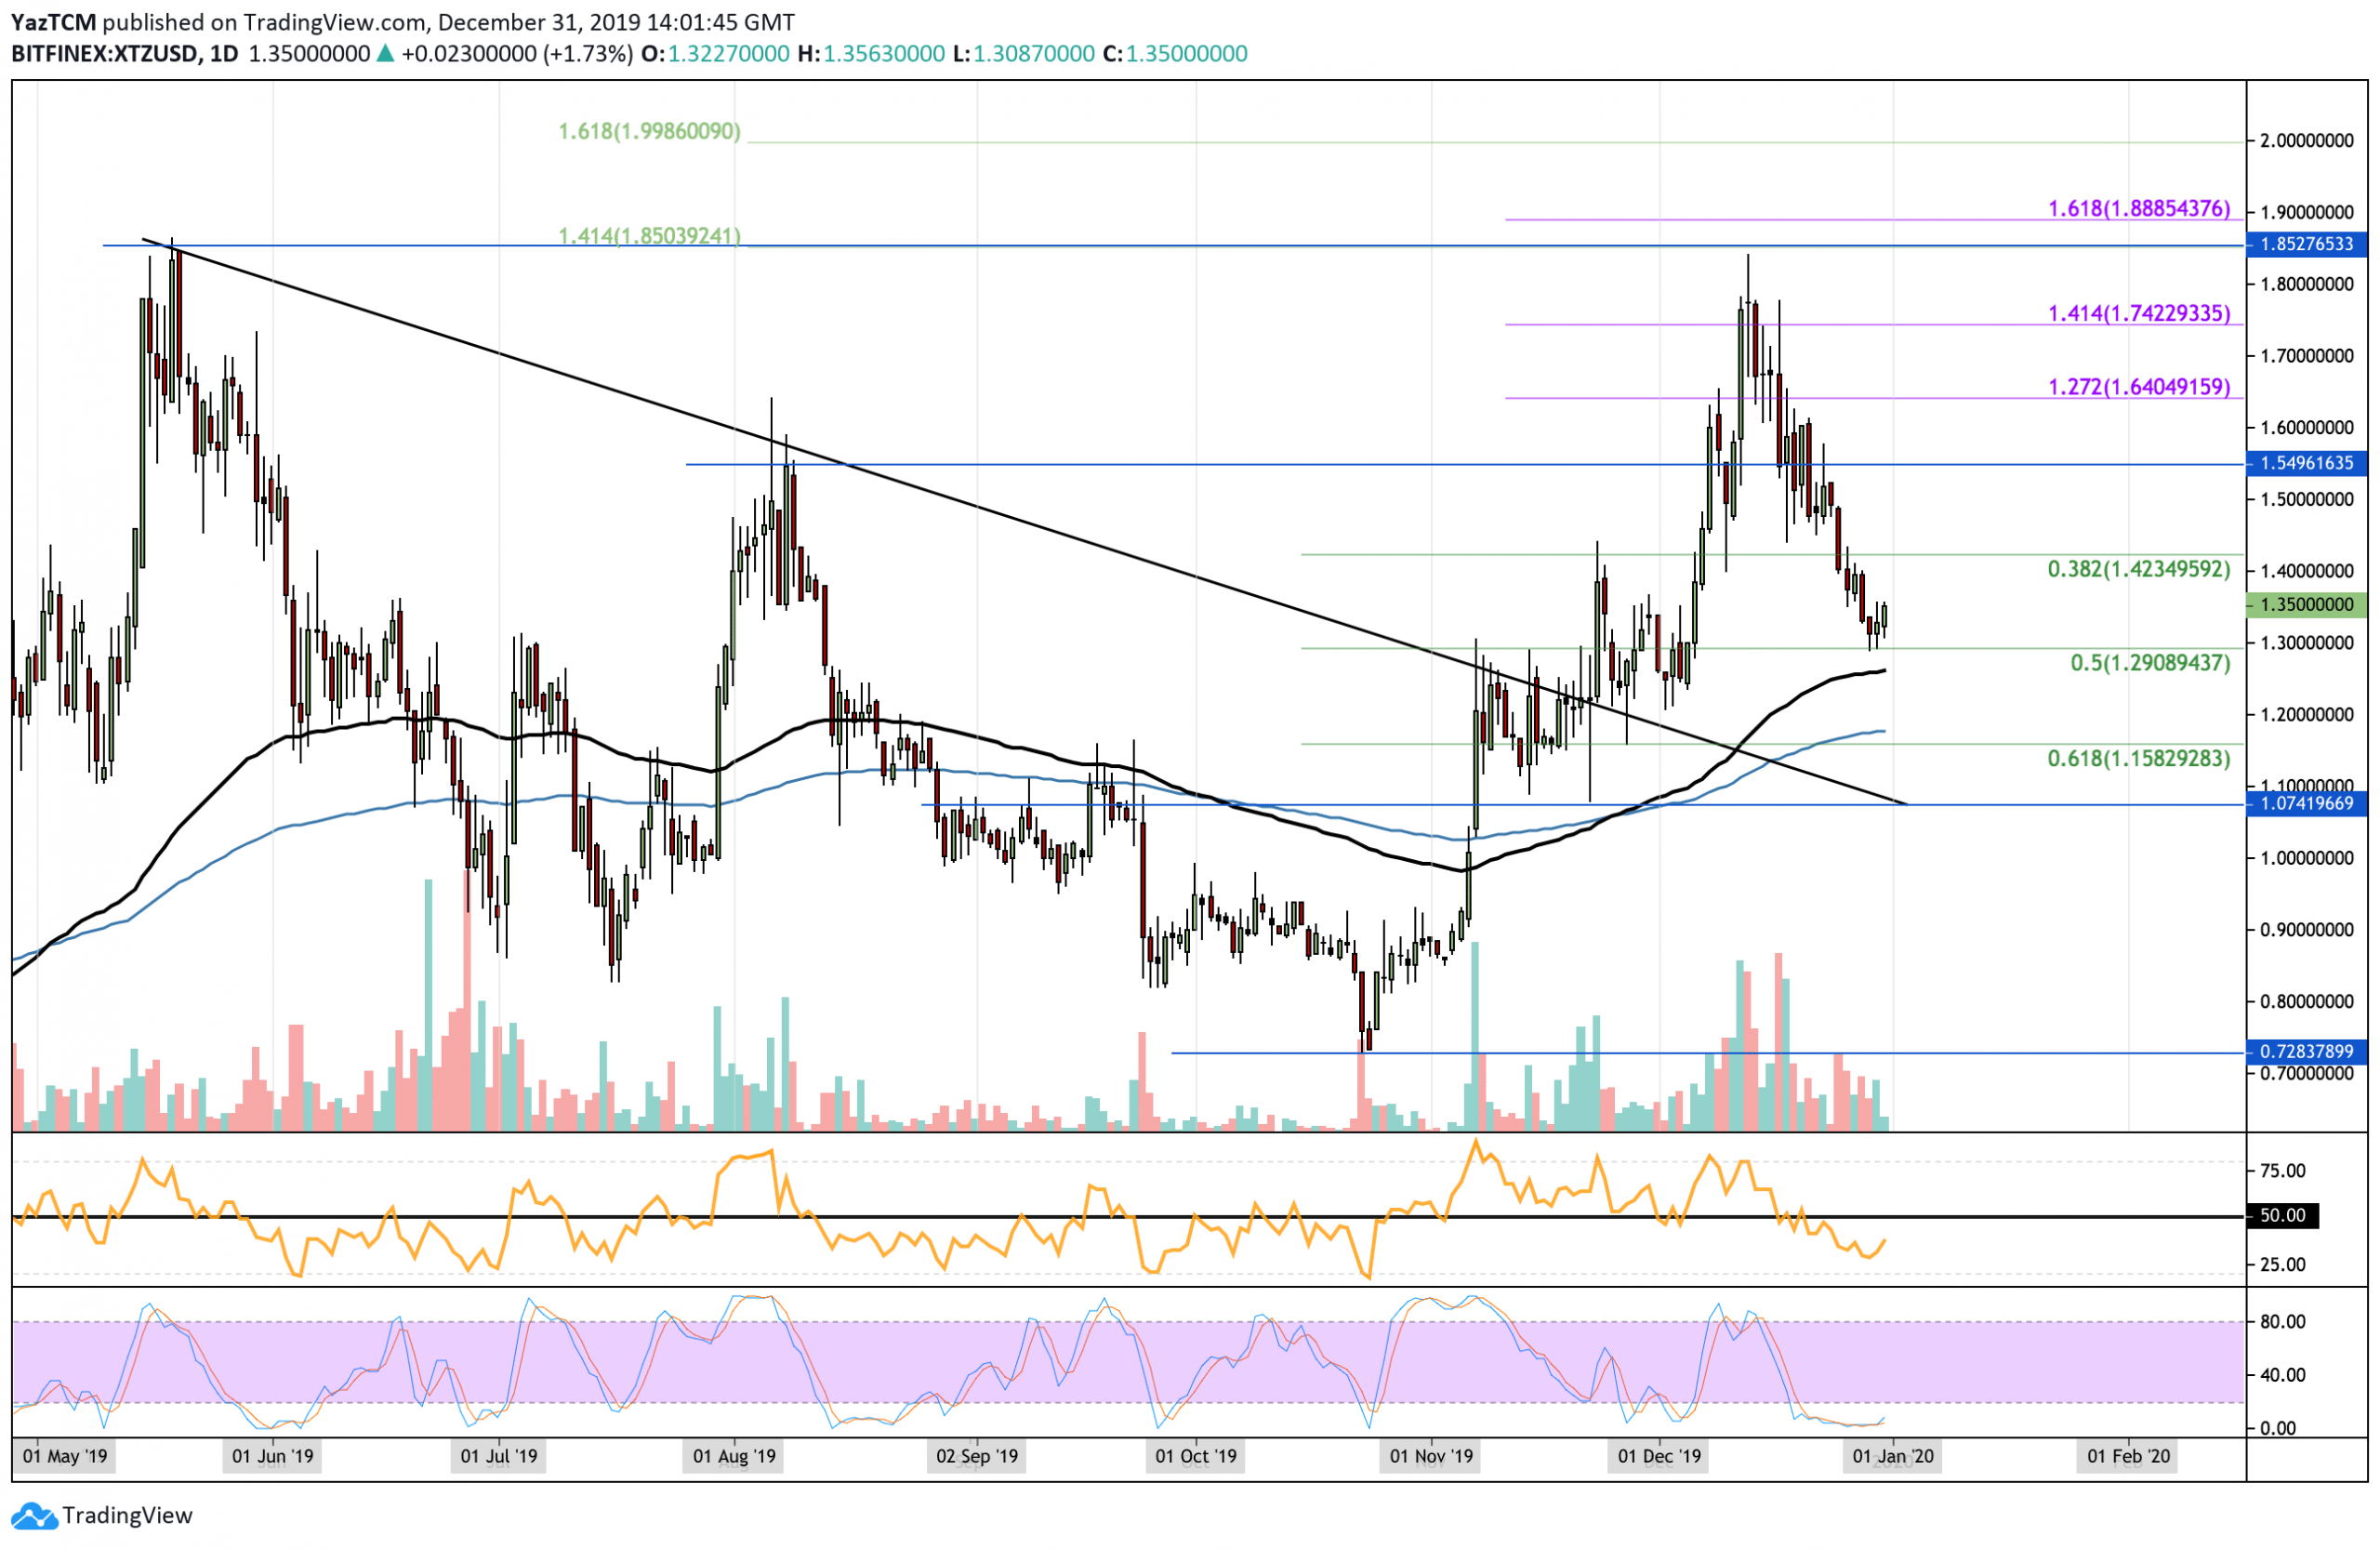
Tezos continued to fall beneath the strong support at $1.50 this week. It continued to travel lower until finding recent support at $1.29 which is provided by the .5 Fibonacci Retracement level. XTZ has rebounded from this level of support as it presently trades at the $1.35 level.
This market can now be considered as bearish until Tezos climbs back above $1.50. To turn bullish, it must climb above the $1.80 resistance level. If the sellers regroup and push the market beneath the support at $1.30, the bearish trend will continue lower toward $1.20.
Tezos Short Term Price Prediction
If the sellers continue to drive the market beneath the support at $1.30, initial support is located at $1.26 (100-days EMA) and $1.18 (100-days EMA). Beneath this, support lies at $1.15 (.618 Fib Retracement) and $1.07. Alternatively, if the bulls continue higher with the rebound initial resistance lies at $1.42 and $1.50. Above $1.50, resistance is located at $1.64, $1.74, and $1.80.
The RSI has dipped beneath the 50 level which shows that the sellers are in control over the market momentum, however, the RSI is rising which shows that the selling pressure is starting to fade. Furthermore, the Stochastic RSI is trading in extreme oversold conditions as we wait for a bullish crossover signal to send the market higher.
XTZ/BTC – Tezos Bounces At 0.00018 BTC Support.
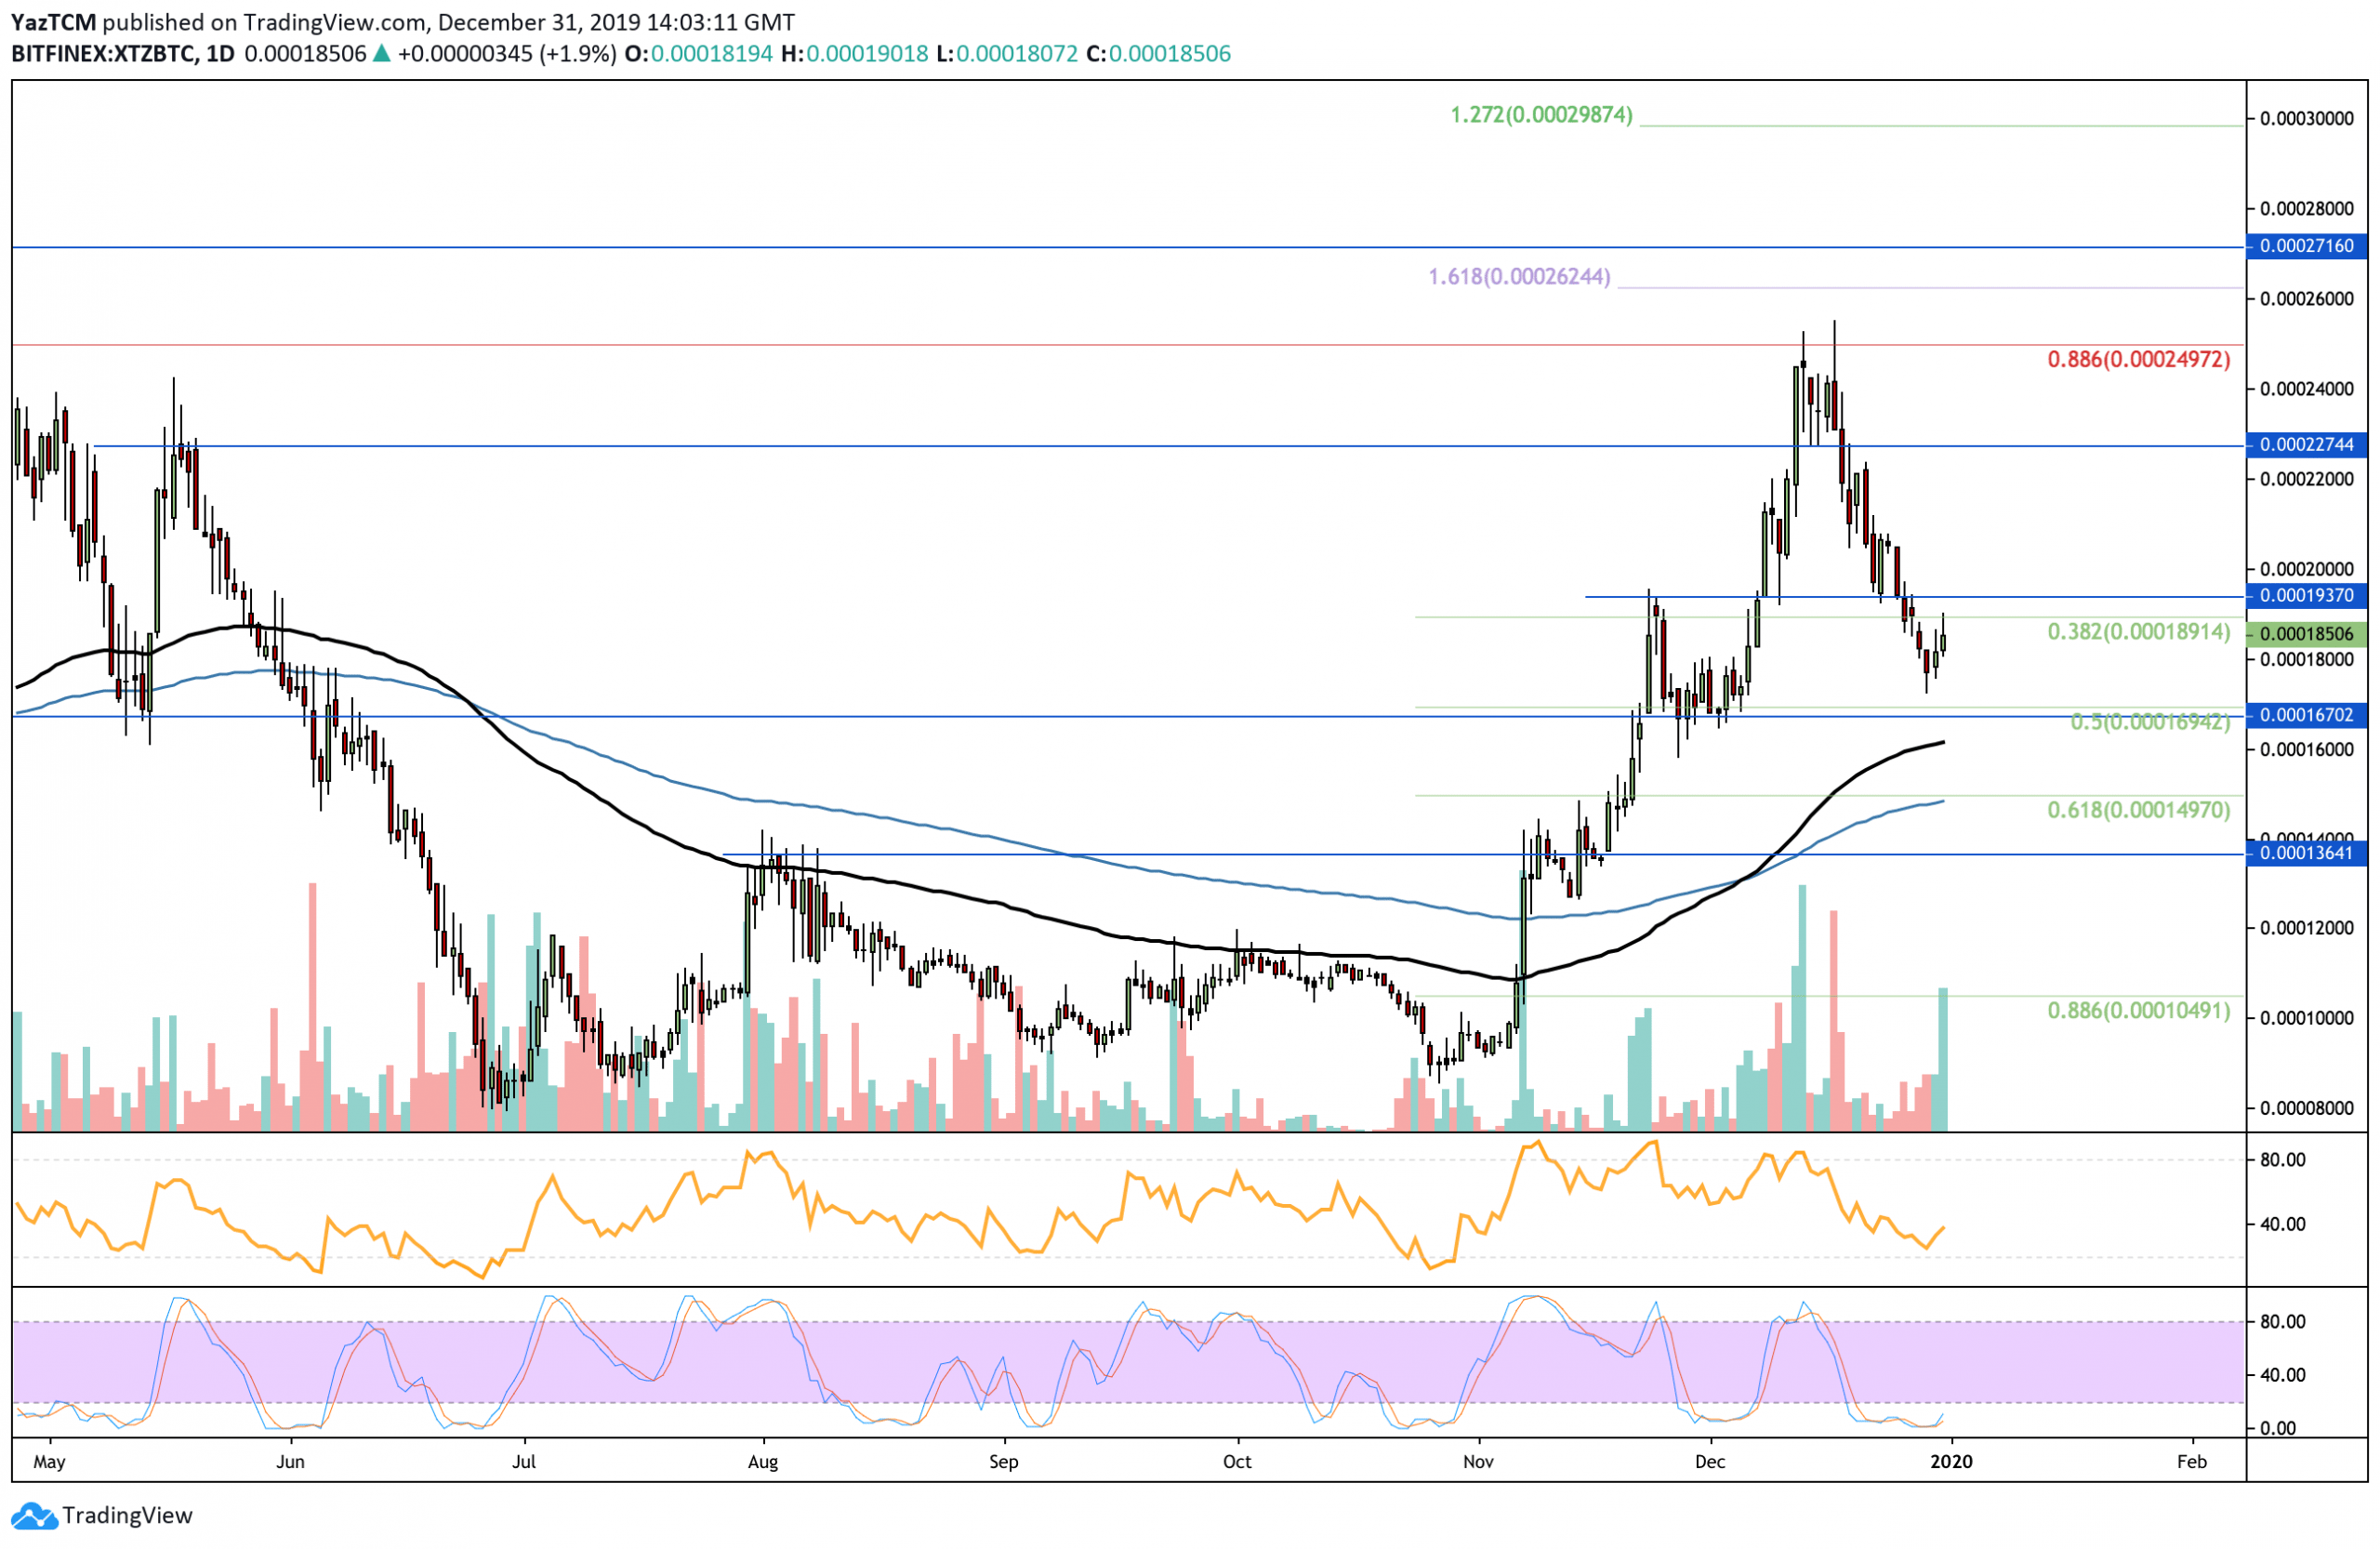
Against BTC, Tezos collapsed beneath the support at 0.0002 BTC and continued to trend lower until support was found at 0.00019 BTC. XTZ rebounded at this level of support as it now trades at the 0.000185 BTC level.
If the sellers were to push Tezos back beneath the 0.00018 BTC support level, then the market could be considered as bearish. To Turn bullish, it must rise much higher and break above the resistance at 0.00025 BTC.
Tezos Short Term Price Prediction
If the buyers continue to drive the price for Tezos higher, an initial resistance is located at 0.0002 BTC. Above this, resistance can be found at 0.00022 BTC, 0.00024 BTC, and 0.00025 BTC. Alternatively, if the sellers push the market beneath the support at 0.00018 BTC, additional support is found at 0..000169 BTC (.5 Fibonacci Retracement), 0.00016 BTC (100-days EMA), and 0.00015 BTC.
The Stochastic RSI is in extremely oversold conditions as we wait for a bullish crossover signal to send the market higher.