SummaryTezos has been surging this month after increasing by 52% to reach the current price of .25.The momentum is certainly on the side of the buyers against Bitcoin.Tezos must pass a 7-month falling resistance line to be able to continue this bullish run higher.Key Support & Resistance LevelsXTZ/USDSupport: .12, .06, .00.Resistance: .40, .44, .56.XTZ/BTC:Support: 0.000115 BTC, 0.00015 BTC, 0.000127 BTC.Resistance: 0.0001828 BTC, 0.000195 BTC, 0.000206 BTC Since our last analysis, Tezos fell lower from the resistance around the .40 level. It’s provided by a long term descending trend line that spans 7-months. After rolling over, Tezos went on to fall back into support at around .20 and is attempting another push higher.This coin is certainly one of the best performers
Topics:
Yaz Sheikh considers the following as important: Price Analysis
This could be interesting, too:
CryptoVizArt writes ETH’s Path to K Involves Maintaining This Critical Support (Ethereum Price Analysis)
Duo Nine writes Crypto Price Analysis June-29: ETH, XRP, ADA, DOGE, and DOT
Duo Nine writes Crypto Price Analysis June-15: ETH, XRP, ADA, DOGE, and DOT
Duo Nine writes Why is the Shiba Inu (SHIB) Price Down Today?
Summary
- Tezos has been surging this month after increasing by 52% to reach the current price of $1.25.
- The momentum is certainly on the side of the buyers against Bitcoin.
- Tezos must pass a 7-month falling resistance line to be able to continue this bullish run higher.
Key Support & Resistance Levels
XTZ/USD
Support: $1.12, $1.06, $1.00.
Resistance: $1.40, $1.44, $1.56.
XTZ/BTC:
Support: 0.000115 BTC, 0.00015 BTC, 0.000127 BTC.
Resistance: 0.0001828 BTC, 0.000195 BTC, 0.000206 BTC
 Since our last analysis, Tezos fell lower from the resistance around the $1.40 level. It’s provided by a long term descending trend line that spans 7-months. After rolling over, Tezos went on to fall back into support at around $1.20 and is attempting another push higher.
This coin is certainly one of the best performers during November 2019. For this positive run to continue further, XTZ must break above the long term falling trend line. On the other hand, for the trend to reverse to the negative, it would have to fall beneath $1.00.
Tezos Short Term Price Prediction
If the buyers can continue higher, initial strong resistance is located at the falling trend line (between $1.35 – $1.40). Above this, resistance is expected at $1.44 and $1.56. The resistance at $1.56 is provided by a short term 1.414 Fibonacci Extension level. The next level of significant resistance lies at $1.73, a point that had stalled the market during May 2019.
Alternatively, if the sellers step in and push the market lower, strong support is expected at $1.12. Beneath this, the next level of strong support lies at $1.06 which contains both the 100-days and 200-days EMAs. The last level of support to highlight is expected at $1.00 where lies the short term .618 Fib Retracement.
The RSI has recently rebounded at the 50 level which is a good sign for the bulls as it shows that they are still in charge of the market momentum.
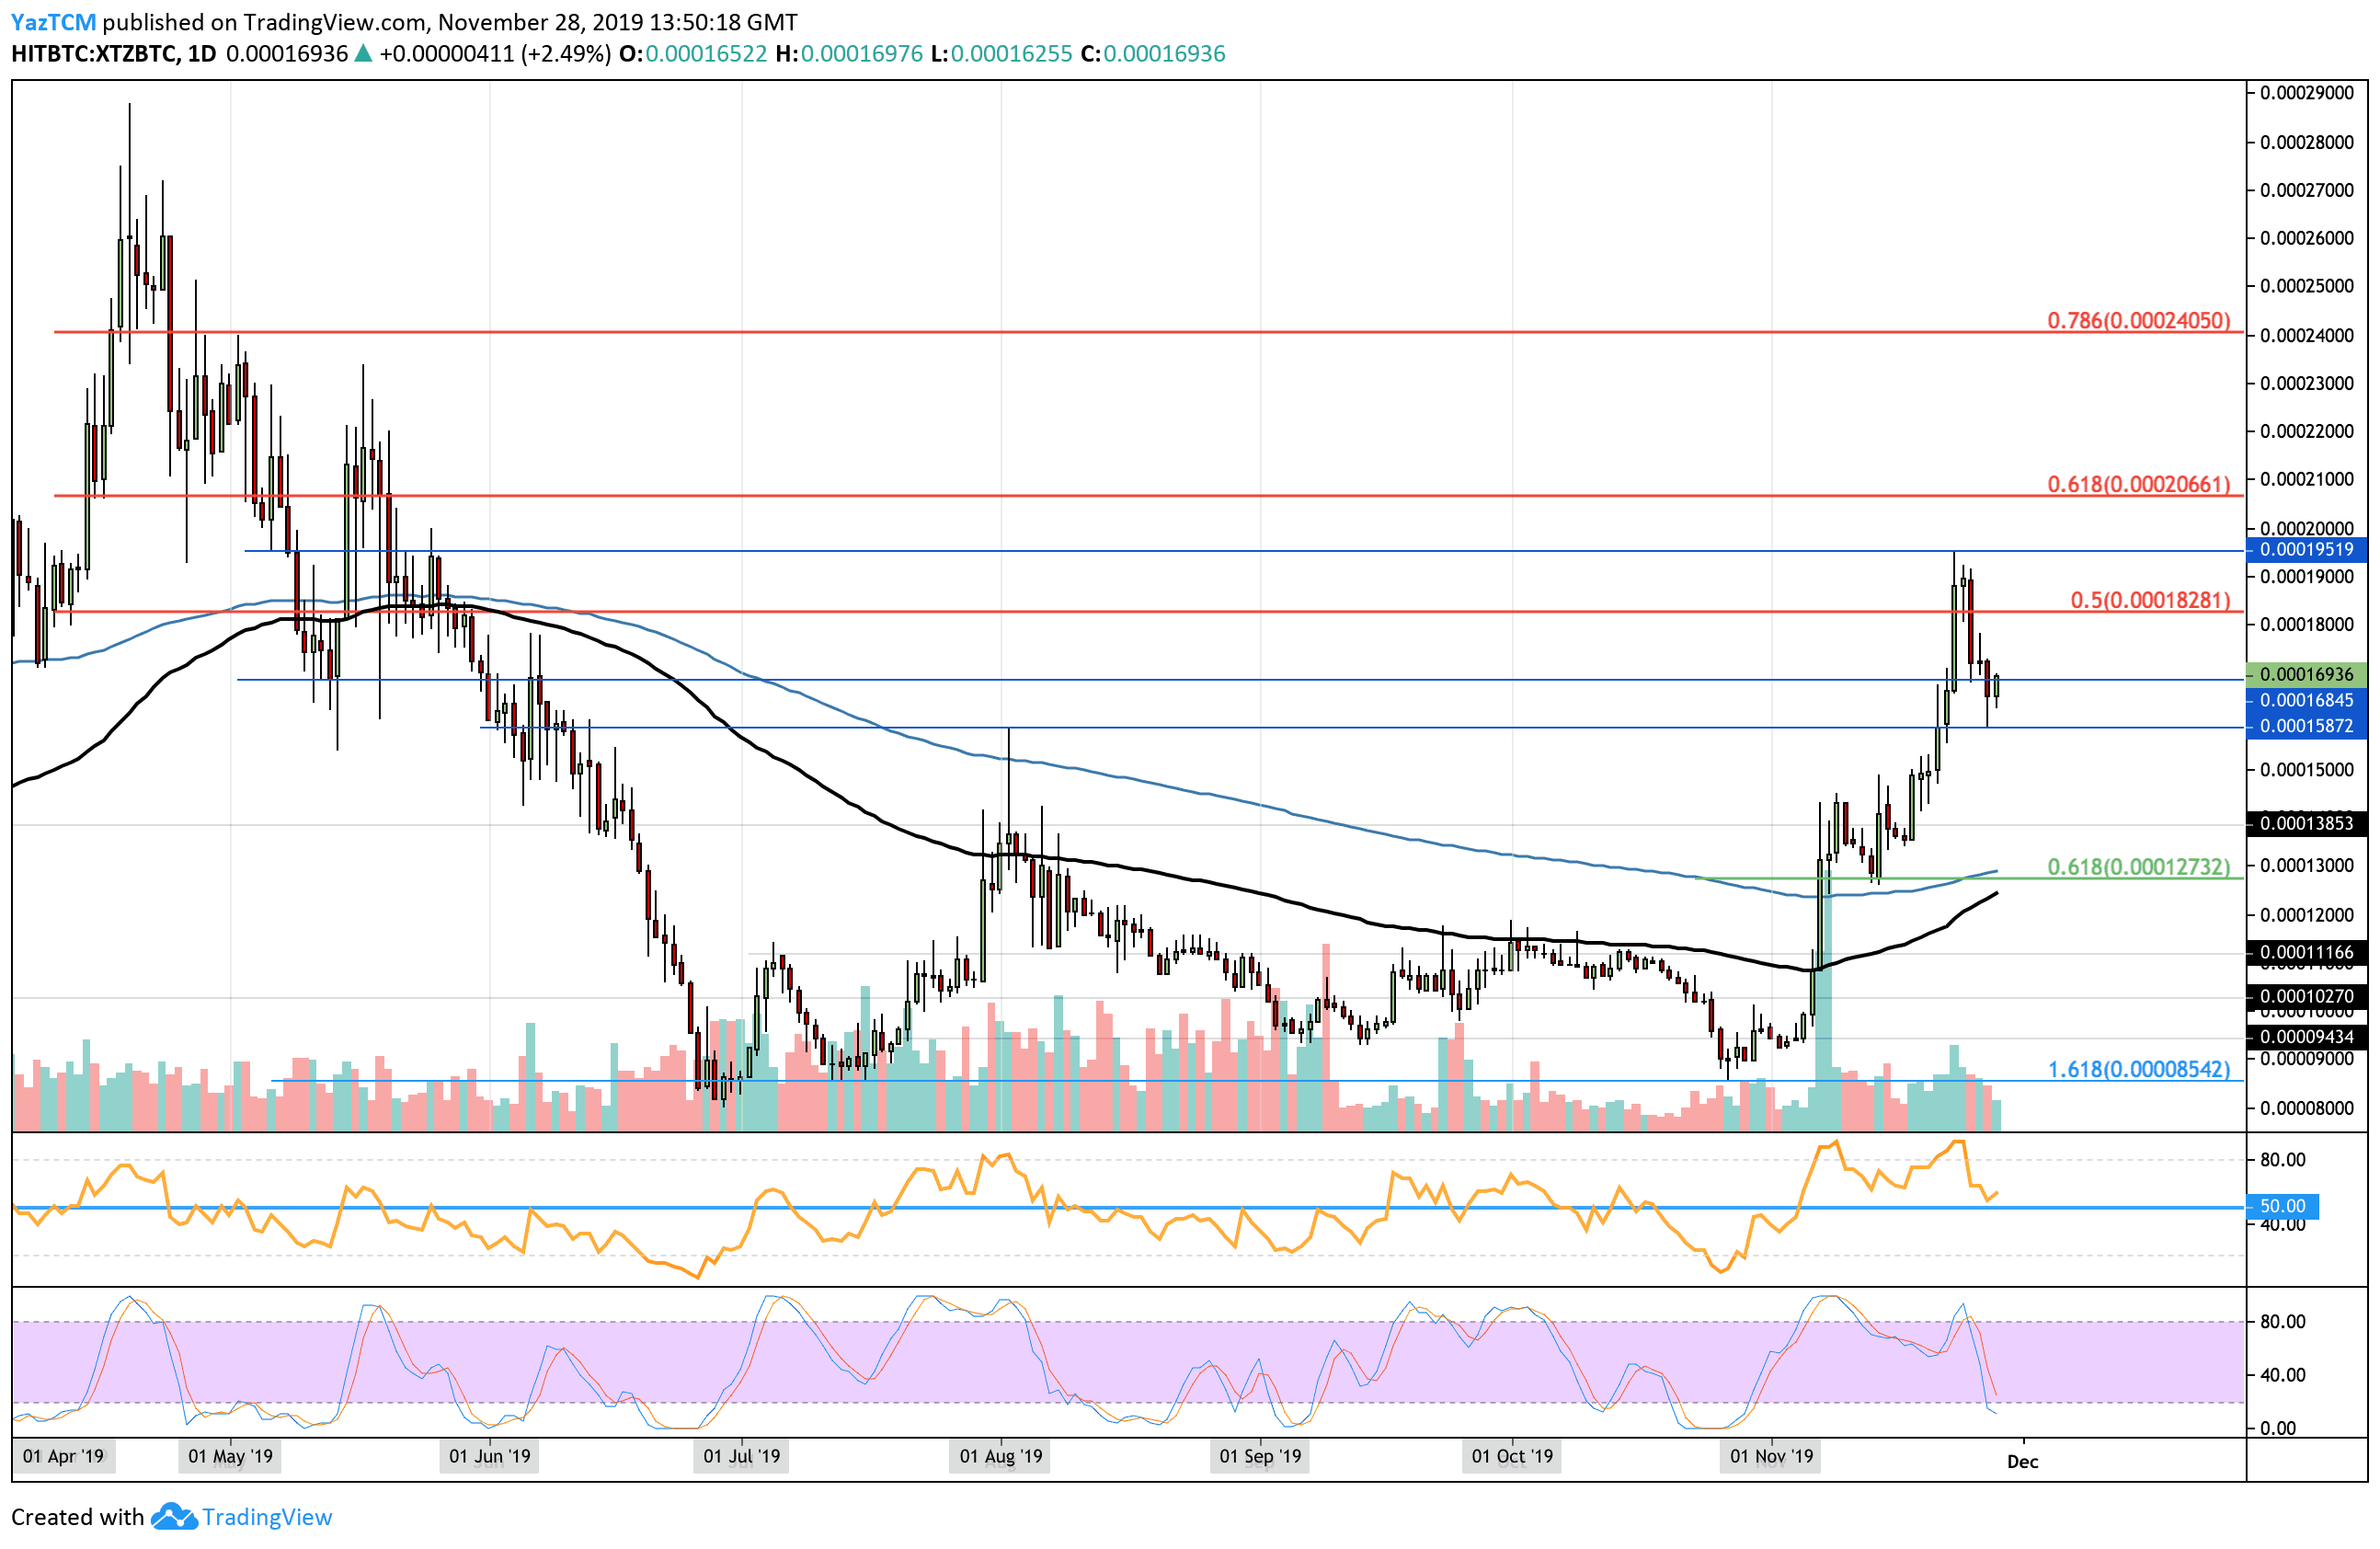
Against Bitcoin, Tezos rolled over at the resistance at around 0.000195 BTC and continued to fall until finding support at 0.000158 BTC. Tezos has since bounced higher and trades at 0.0001693 BTC.
For XTZ to continue its bullish run against Bitcoin, it must climb back above the resistance at 0.00020 BTC. If it was to drop beneath the support at 0.00012 BTC, the market would then be considered as bearish.
Tezos Short Term Price Prediction
If the buyers can continue with their ascension, an initial resistance is to be expected at 0.0001828 BTC and 0.000195 BTC. If the bulls continue to go higher above 0.00020 BTC, the next level of significant resistance lies at 0.000206 BTC which is the long term bearish .618 Fibonacci Retracement level.
On the other hand, if the sellers start to pressure the market lower, initial support is expected at 0.000115 BTC. Beneath this, support is found at 0.00015 BTC and 0.0001270 BTC. The support at 0.0001270 BTC is provided by a short term .618 Fibonacci Retracement level (drawn in green) and is bolstered by the 200-days EMA.
The RSI has recently rebounded at the 50 level which shows that the bulls are still in charge of the market momentum. Furthermore, the Stochastic RSI is close to reaching oversold conditions which show that the sellers may be exhausted.