SummaryTRON saw a 6% price increase over the past 24 hours. The cryptocurrency is close to entering the top 10 projects by market cap, as it’s currently occupying the 11th spot. The cryptocurrency is looking promising against BTC as it attempts to break October highs.TRX is poised for a leg up as the technical indicators suggest bearish pressure is fading.Key Support & Resistance LevelsTRX/USDSupport: %excerpt%.0136, %excerpt%.0125, %excerpt%.0118,.Resistance: %excerpt%.01580, %excerpt%.018, %excerpt%.020.TRX/BTC:Support: 200 SAT, 177 SAT, 150 SAT. Resistance: 215 SAT, 234 SAT, 250 SAT.TRX/USD: Can The Bounce Develop Into A Bull Run?The daily chart shows TRX bouncing slightly higher after finding support at %excerpt%.01360. This level had provided support for the market during October and is expected to hold the market moving
Topics:
Yaz Sheikh considers the following as important: Price Analysis, Tron News, Tron Price
This could be interesting, too:
CryptoVizArt writes ETH’s Path to K Involves Maintaining This Critical Support (Ethereum Price Analysis)
Duo Nine writes Crypto Price Analysis June-29: ETH, XRP, ADA, DOGE, and DOT
Duo Nine writes Crypto Price Analysis June-15: ETH, XRP, ADA, DOGE, and DOT
Duo Nine writes Why is the Shiba Inu (SHIB) Price Down Today?
Summary
- TRON saw a 6% price increase over the past 24 hours. The cryptocurrency is close to entering the top 10 projects by market cap, as it’s currently occupying the 11th spot.
- The cryptocurrency is looking promising against BTC as it attempts to break October highs.
- TRX is poised for a leg up as the technical indicators suggest bearish pressure is fading.
Key Support & Resistance Levels
TRX/USD
Support: $0.0136, $0.0125, $0.0118,.
Resistance: $0.01580, $0.018, $0.020.
TRX/BTC:
Support: 200 SAT, 177 SAT, 150 SAT.
Resistance: 215 SAT, 234 SAT, 250 SAT.
TRX/USD: Can The Bounce Develop Into A Bull Run?
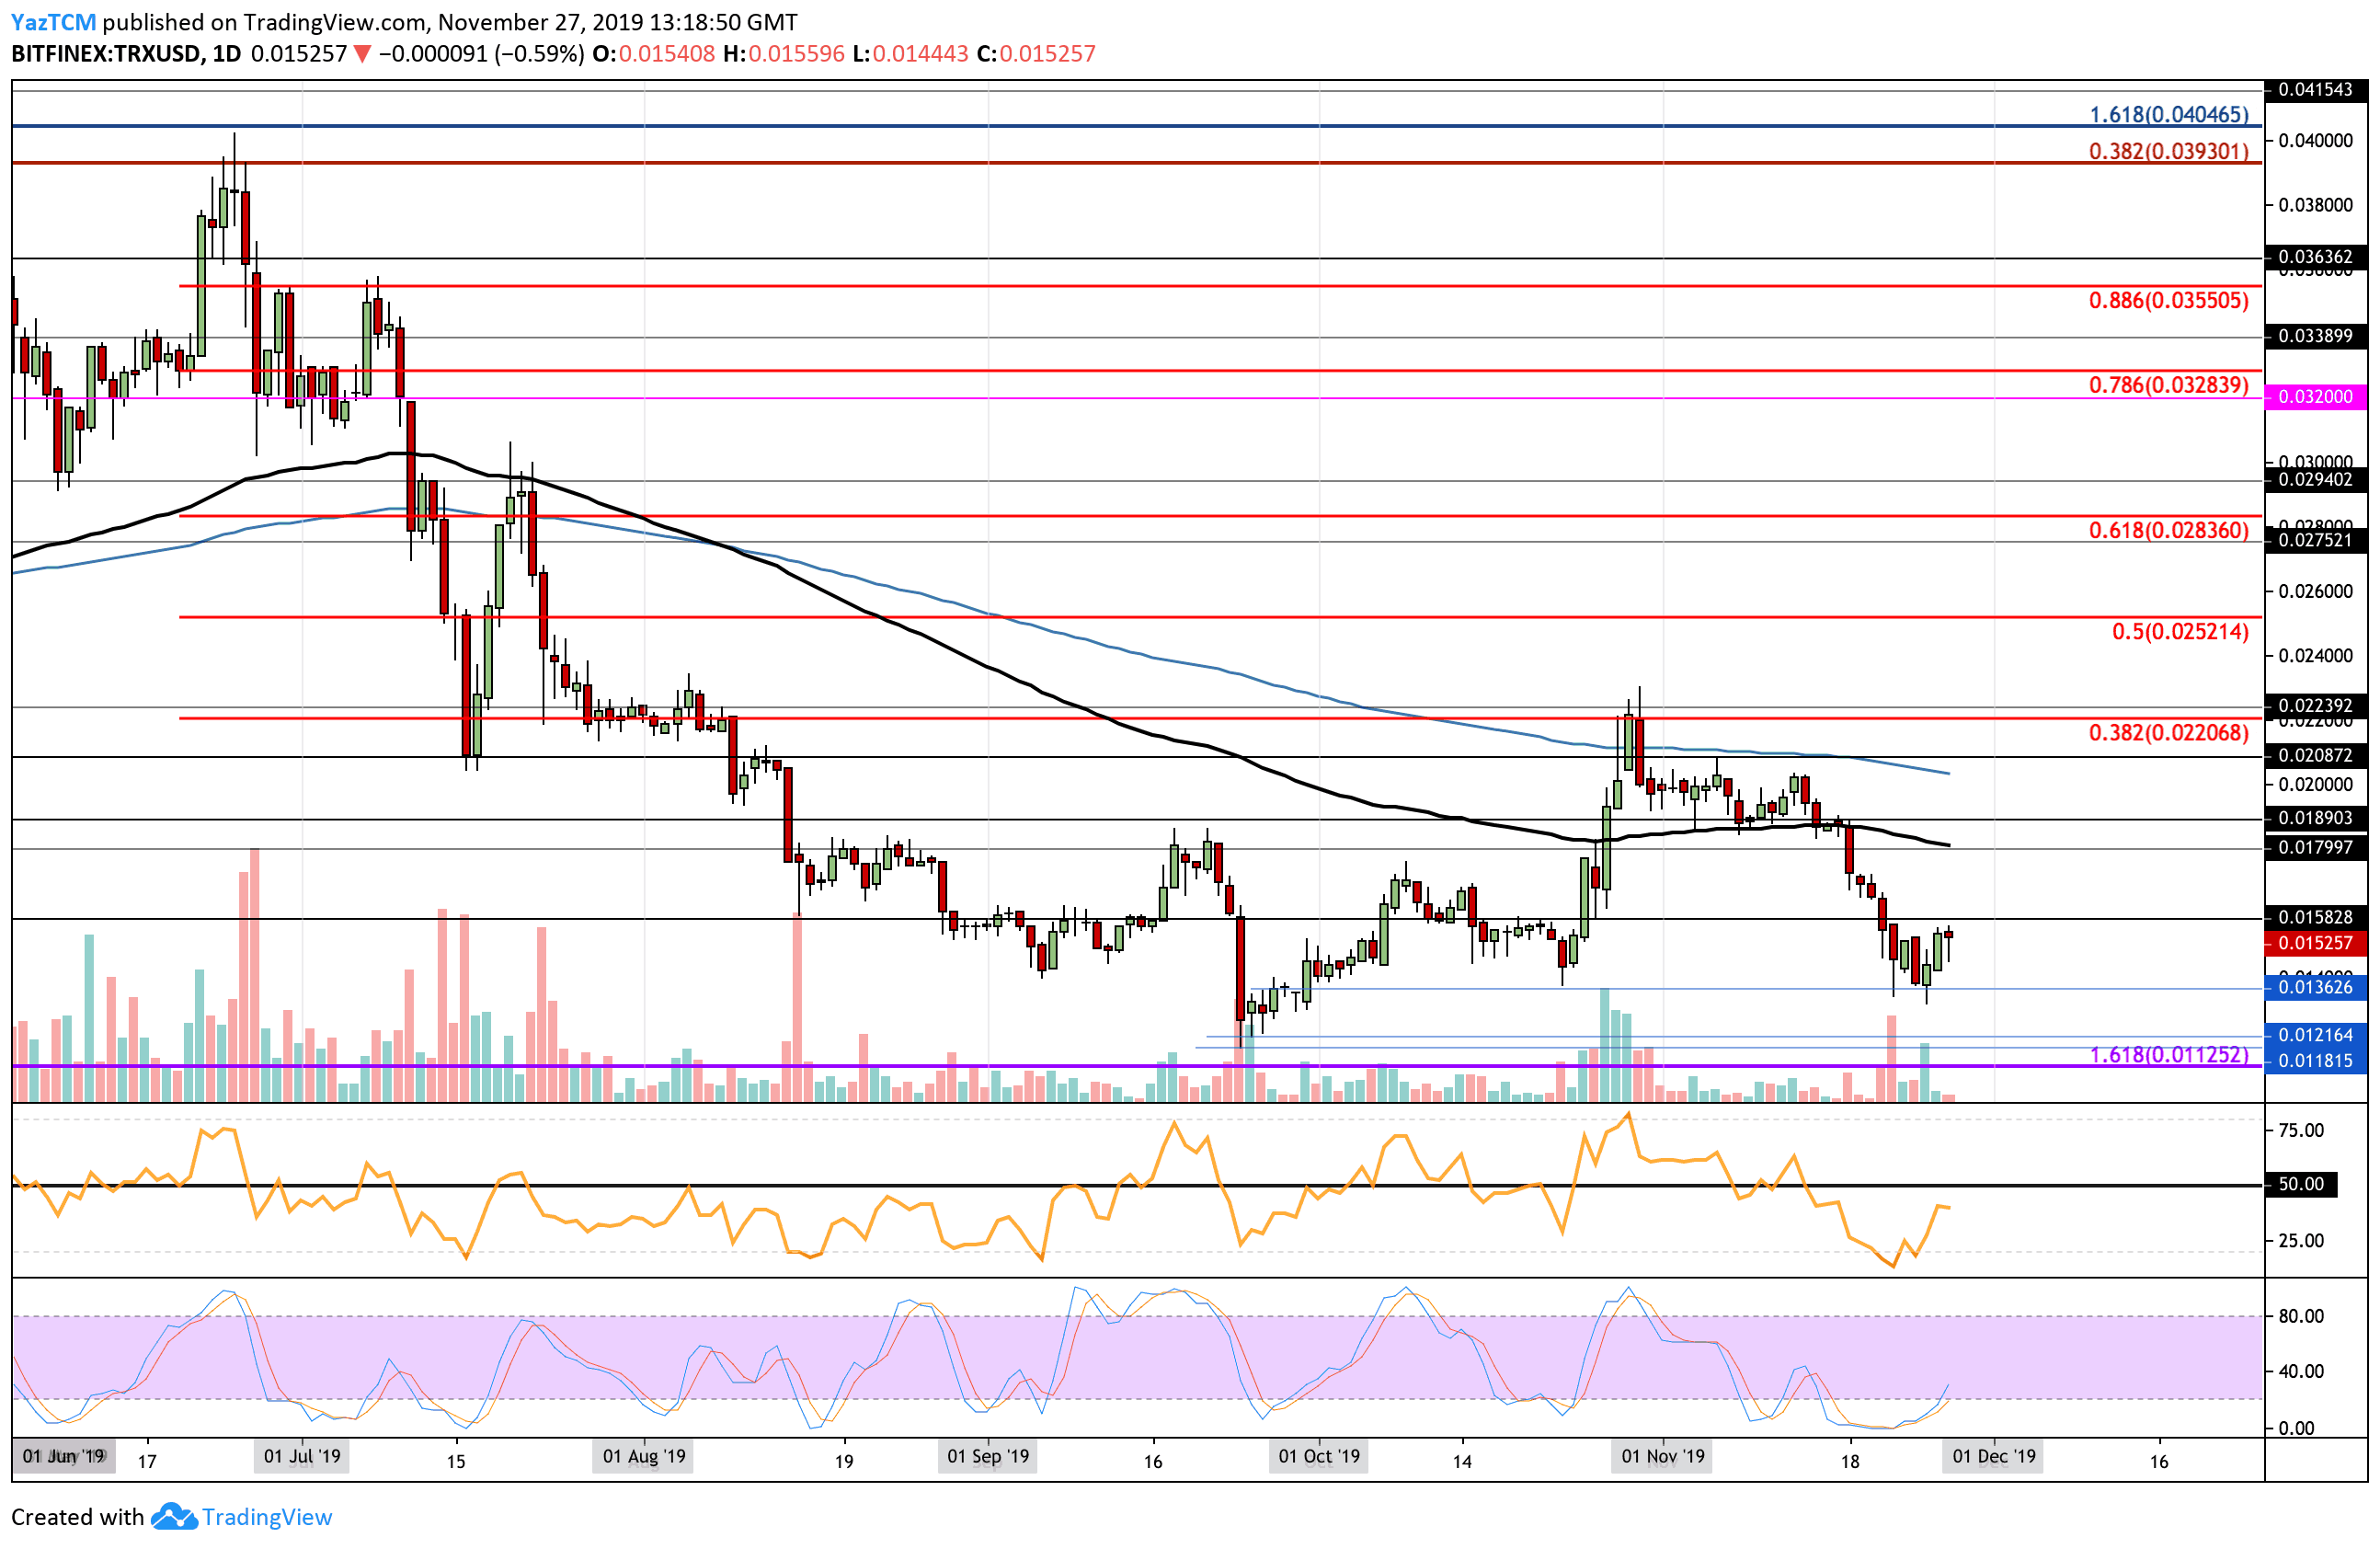 The daily chart shows TRX bouncing slightly higher after finding support at $0.01360. This level had provided support for the market during October and is expected to hold the market moving forward.
Relative to the entire cryptocurrency industry, Tron has been pretty resilient to recent price capitulations as, unlike many other altcoins, it did not create a fresh 2019 low during November 2019.
Tron Short Term Price Prediction
TRX faces current resistance at the $0.01580 level. If the bulls break above this, higher resistance is expected at $0.018, where lies the 100-days EMA. Following this, resistance can be located at $0.020 (200-days EMA).
Alternatively, if the sellers regroup and start to push the price lower, immediate strong support is expected at the $0.01360 level. Beneath this, support lies at $0.0125 and $0.0118 (Septemeber 2019 low).
The RSI is on its way to reach the 50 level, which shows that the selling pressure is starting to fade. Furthermore, the Stochastic RSI has recently produced a bullish crossover signal, which should help send the market higher if the moving averages can expand away from each other.
TRX/BTC: Starting To Look Healthy
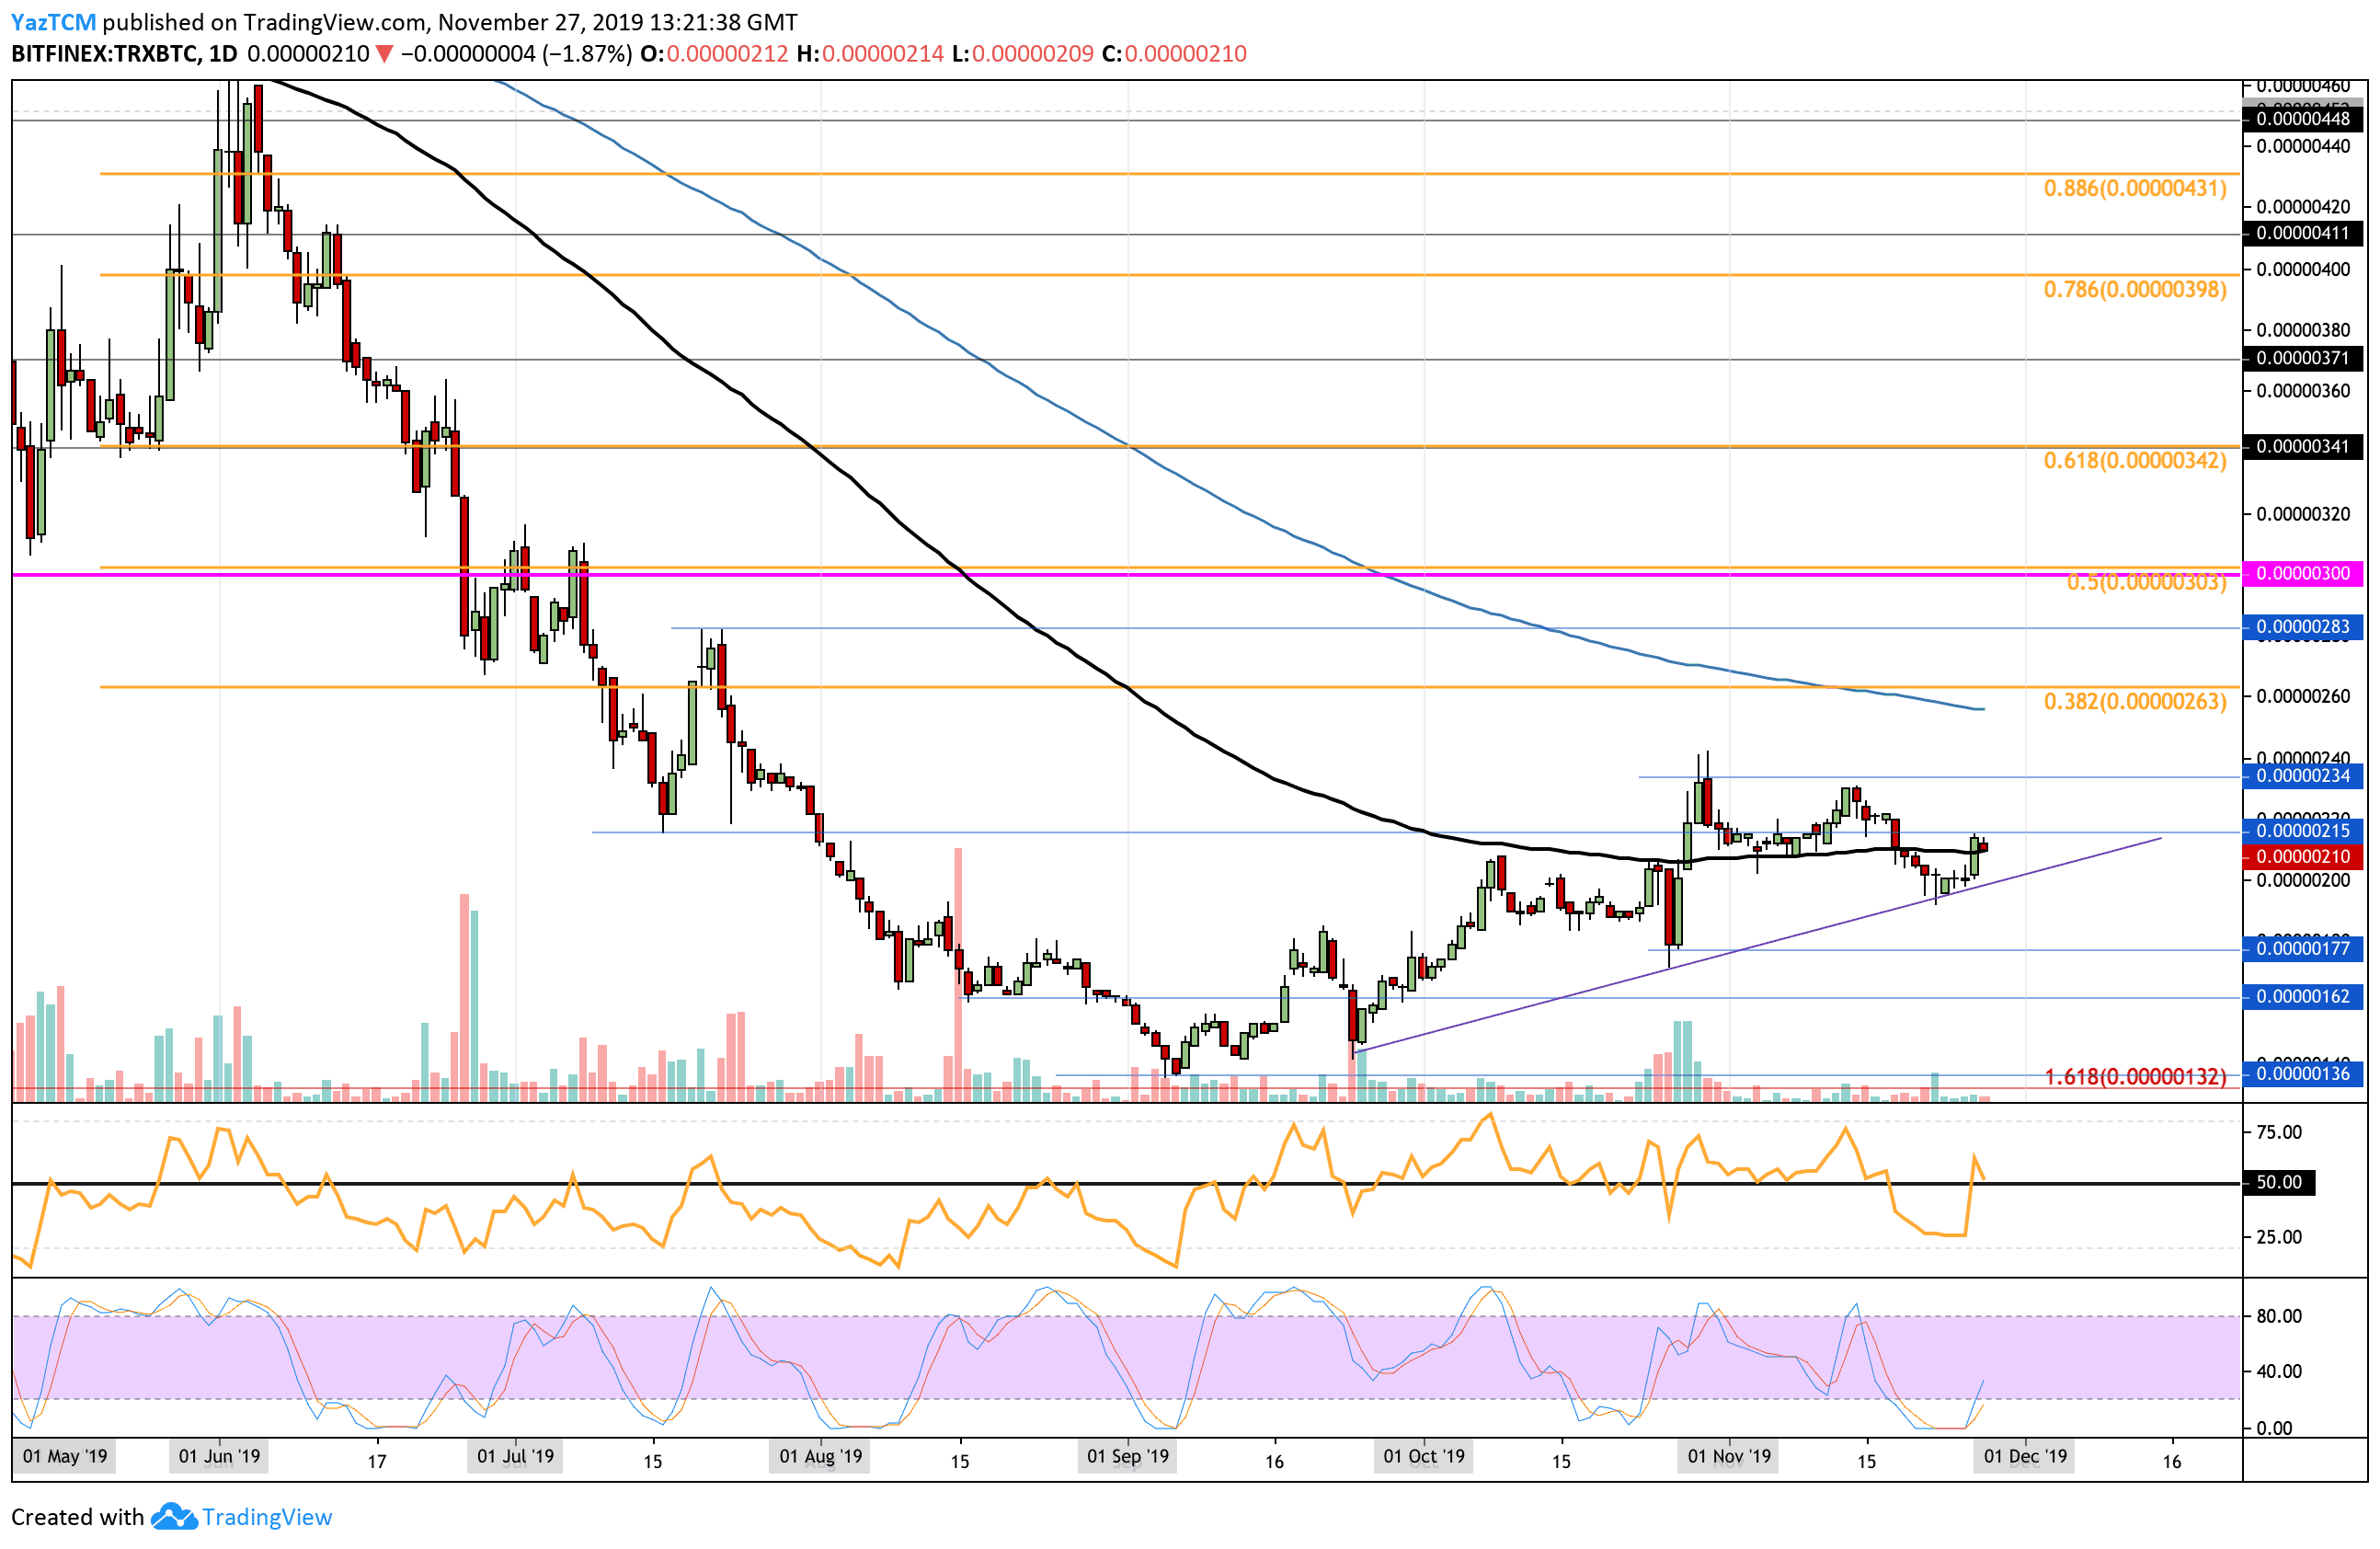
Against Bitcoin, TRX has been performing rather well after seeing a 3-month price increase of around 56%. It currently trades at about 210 SAT around the 100-days EMA and remains supported by a rising support line.
If this bullish momentum continues, TRX will have the opportunity to break above the October high at around 240 SAT.
TRX Short Term Price Prediction
The nearest level of resistance to overcome lies at 215 SAT. Above this, resistance is located at the October high-day-close at around 234 SAT. If TRX climbs above here, the market condition will turn bullish. Following this, strong resistance lies at 250 SAT at the 200-days EMA.
Alternatively, if the sellers push the market lower, immediate support can be found at the rising support line at around the 200 SAT level. Beneath this, support lies at 177 SAT and 150 SAT.
The RSI has returned to the 50 level after breaking above, which is a strong sign that the bulls are attempting to take charge of the market momentum. Similarly, the Stochastic RSI has recently produced a bullish crossover signal.