Tron saw a sharp 25% price fall over the past month, causing it to drop into the %excerpt%.0129 level.The cryptocurrency is struggling against BTC after falling beneath a rising trend line in early December.Tron could rebound higher from here as the Stochastic RSI lines up for a bullish crossover signal.Key Support & Resistance LevelsTRX/USDSupport: %excerpt%.0121, %excerpt%.0112, %excerpt%.0101 Resistance: %excerpt%.014, %excerpt%.0162, %excerpt%.018.ETH/BTC:Support: 171 SAT, 162 SAT, 152 SAT.Resistance: 191 SAT, 200 SAT, 207 SAT.TRX/USD – Are We Headed To December 2018 Lows?The daily chart clearly shows Tron struggling heavily over the past two months of trading. There was a slight rebound toward the end of November. However, it was unable to overcome the resistance at %excerpt%.0162, causing it to roll over and fall again. The
Topics:
Yaz Sheikh considers the following as important: Price Analysis, Tron (TRX) Price
This could be interesting, too:
Chayanika Deka writes Tron’s TVL Reaches New Record of .2 Billion
Chayanika Deka writes Tron’s Q3 2024 Revenue Grows by 6% in TRX Amidst Meme Coin Boom
Dimitar Dzhondzhorov writes Important Binance Announcement Concerning Tron (TRX) Holders: Details
CryptoVizArt writes ETH’s Path to K Involves Maintaining This Critical Support (Ethereum Price Analysis)
- Tron saw a sharp 25% price fall over the past month, causing it to drop into the $0.0129 level.
- The cryptocurrency is struggling against BTC after falling beneath a rising trend line in early December.
- Tron could rebound higher from here as the Stochastic RSI lines up for a bullish crossover signal.
Key Support & Resistance Levels
TRX/USD
Support: $0.0121, $0.0112, $0.0101
Resistance: $0.014, $0.0162, $0.018.
ETH/BTC:
Support: 171 SAT, 162 SAT, 152 SAT.
Resistance: 191 SAT, 200 SAT, 207 SAT.
TRX/USD – Are We Headed To December 2018 Lows?
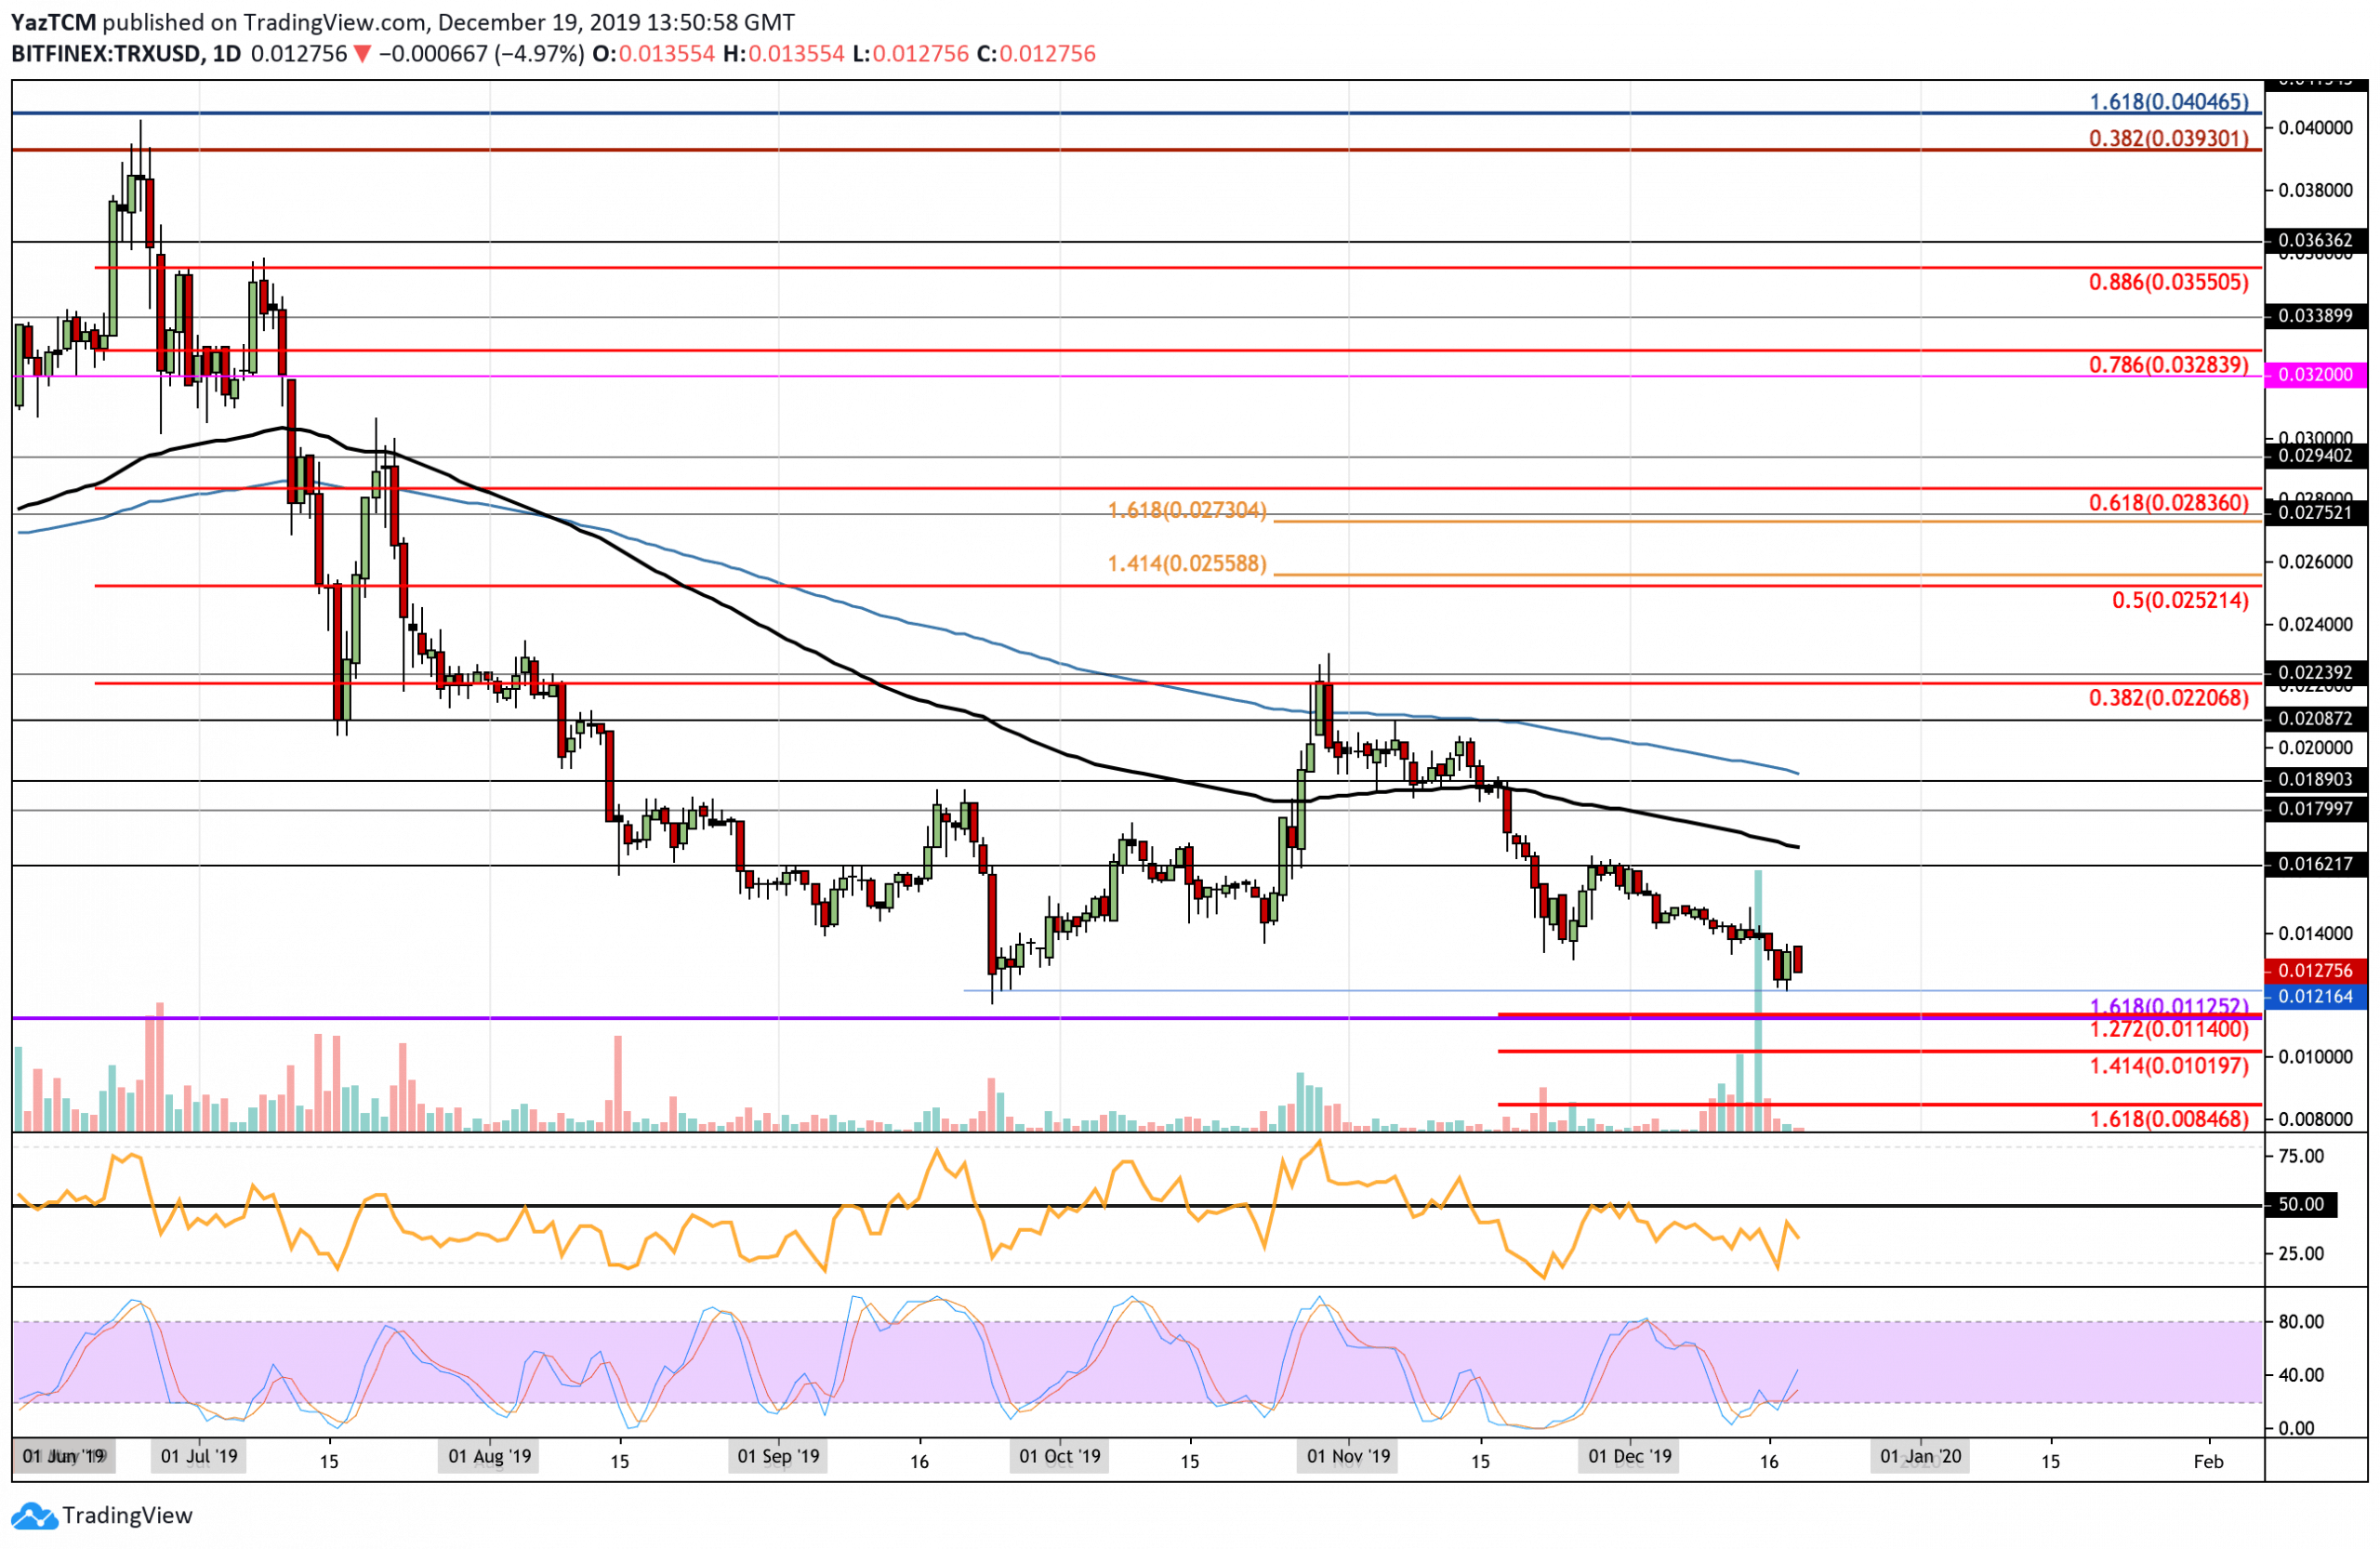
The daily chart clearly shows Tron struggling heavily over the past two months of trading. There was a slight rebound toward the end of November. However, it was unable to overcome the resistance at $0.0162, causing it to roll over and fall again. The cryptocurrency recently found support at $0.0121 (October lows), but the bears are shaping up to re-test this support soon.
This coin is strongly bearish, and if it falls beneath the $0.012 support, the bearish run can be expected to continue. To turn bullish, this coin must rise above the $0.019 resistance level that is provided by the 200-days EMA.
Tron Short Term Price Prediction
If the sellers continue to pressure the market, immediate support is expected at $0.0121. Beneath this, support lies at $0.0112, which is the December 2018 lows. If the sellers push beneath here, they will be creating a fresh multi-year low. If this is the case, added support could be expected at $0.010 (downside 1.414 Fib Extension) and $0.0084 (downside 1.618 Fib Extension).
Alternatively, if the buyers regroup and push higher, initial resistance lies at $0.0137. Above this, resistance lies at $0.0162 and $0.0168 (100-days EMA).
The RSI is underneath the 50 level to show the sellers are in possession of the market momentum. However, the Stochastic RSI is primed for a bullish crossover signal, which could send the market higher.
TRX/BTC: TRX Breaks Rising Support Line And Drops Drastically
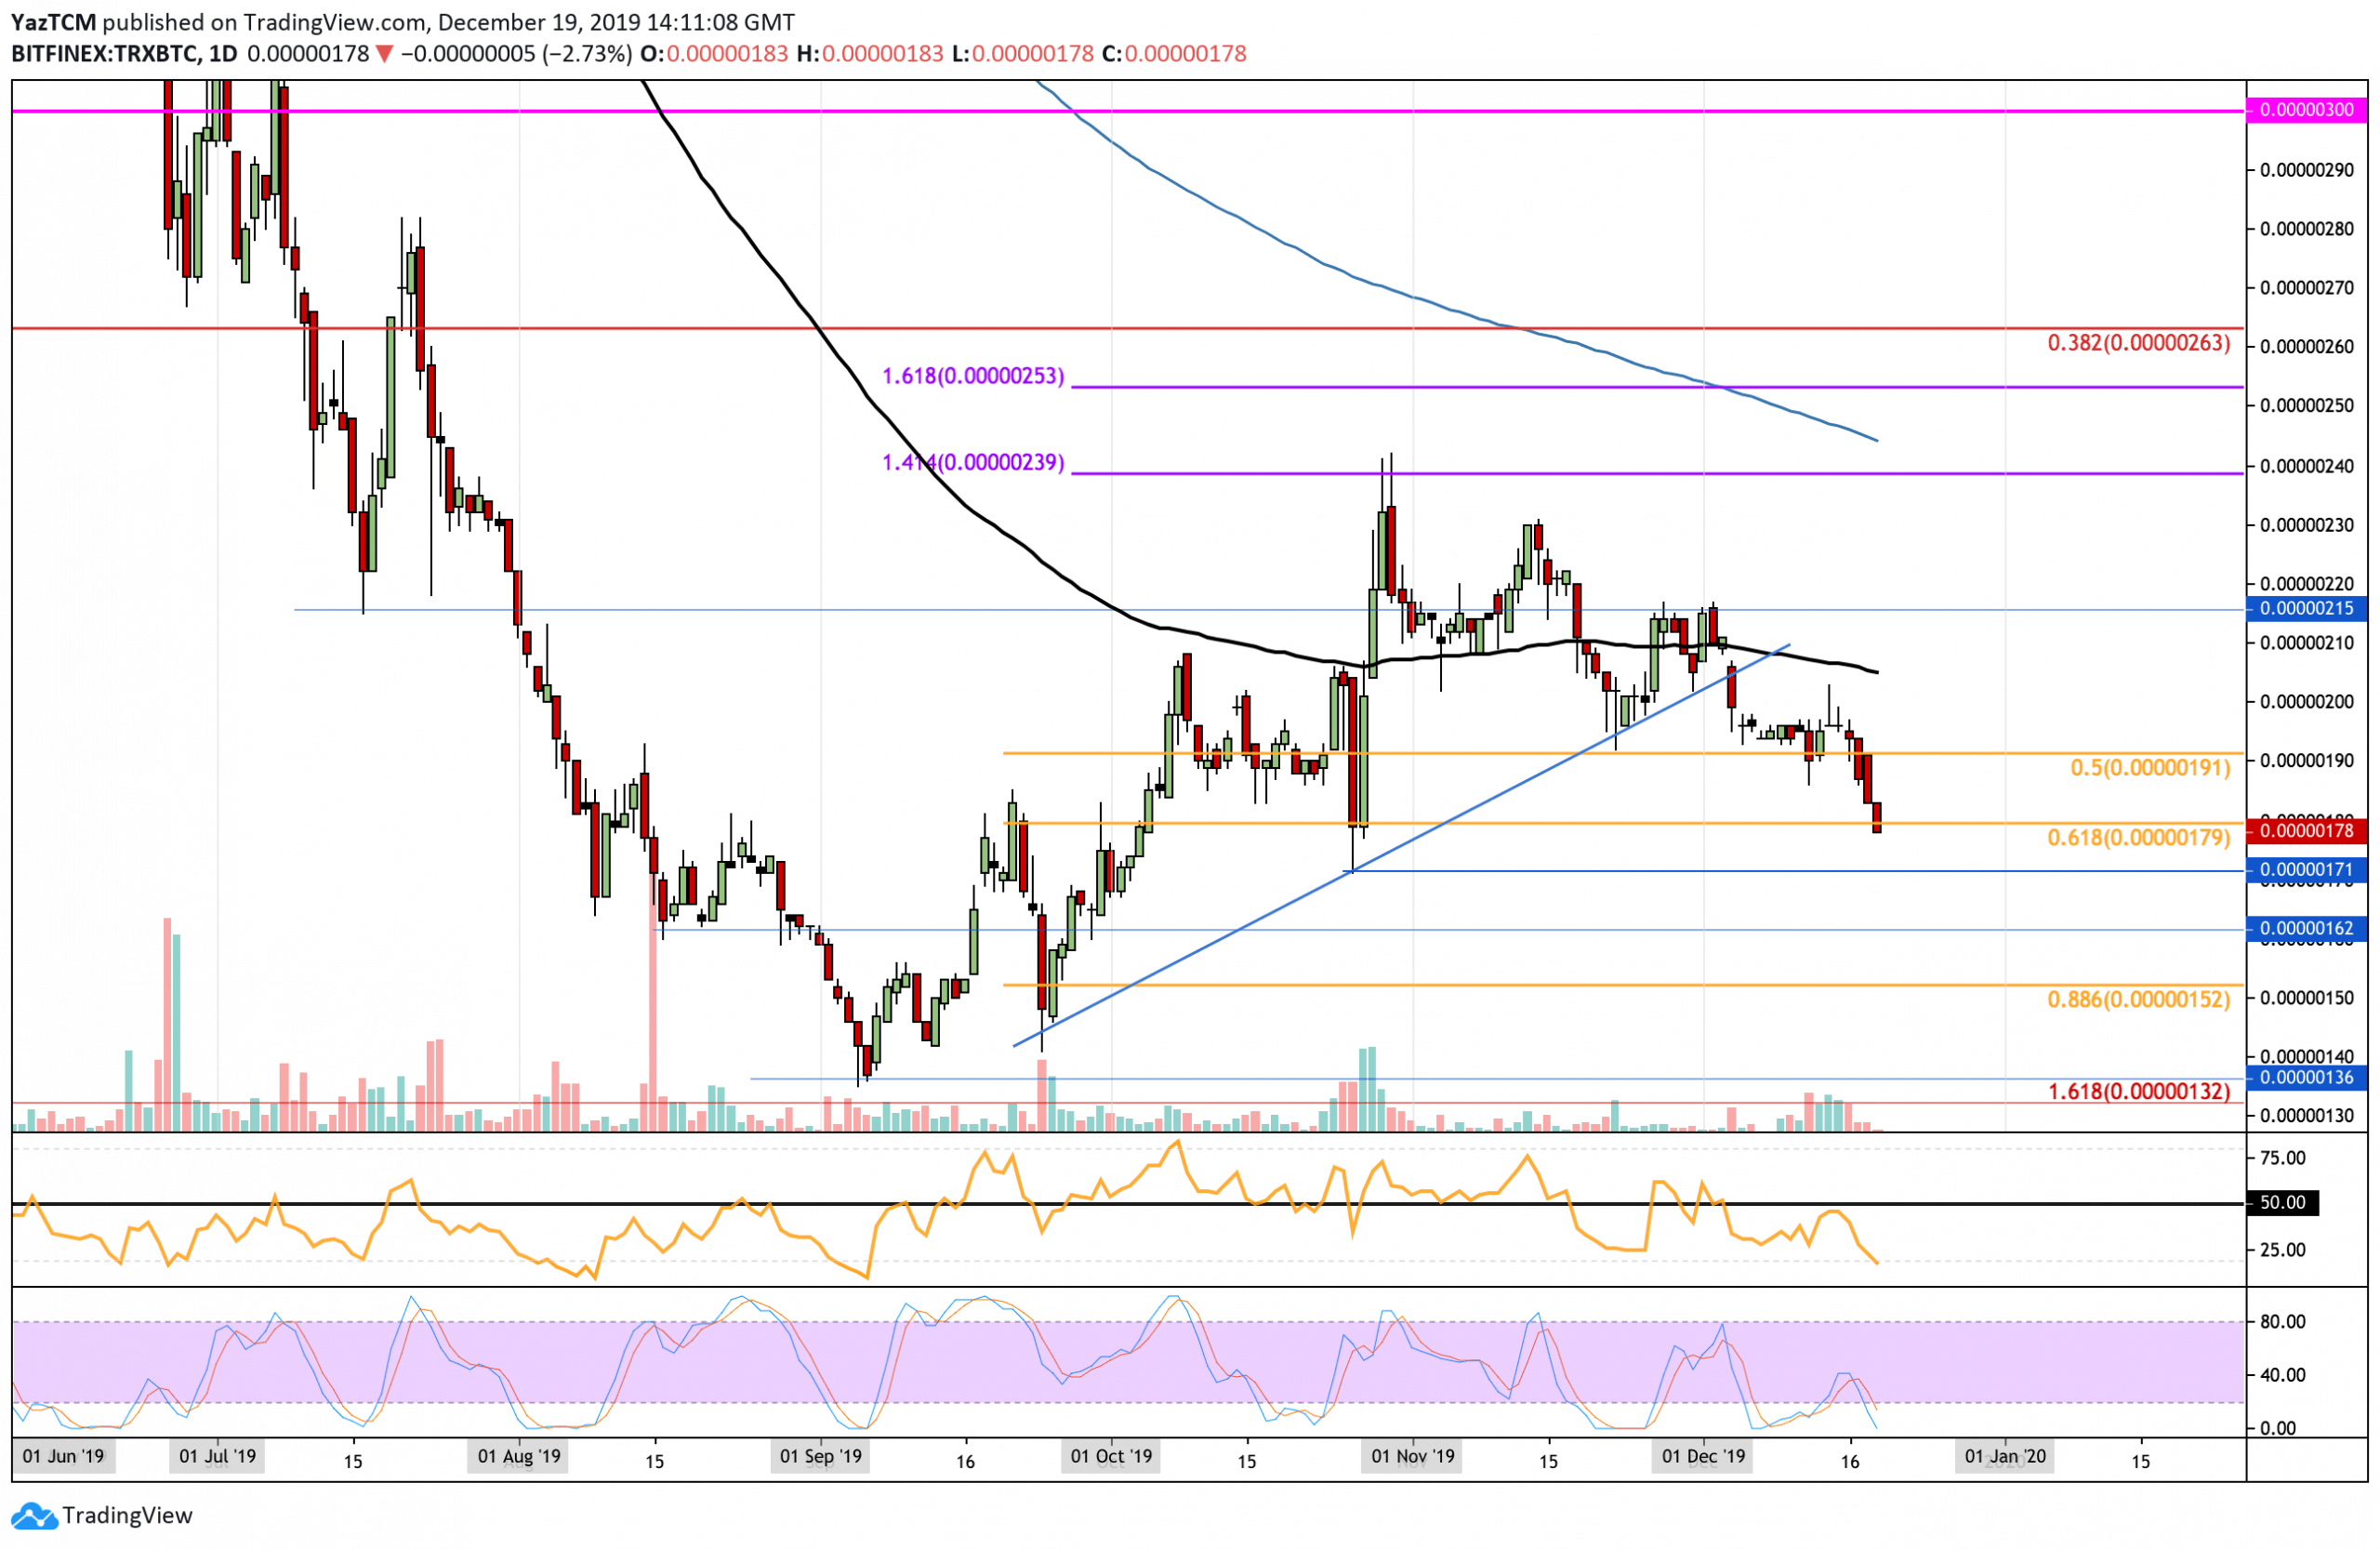
Against Bitcoin, Tron broke beneath the rising trend line toward the start of December, causing it to roll over and fall quite precipitously. It sank beneath support at 200 SAT and 191 SAT (.5 Fib Retracement) to reach the current support at 178 SAT.
For this market to be considered as bullish, TRX would need to rise above the 215 SAT level to break the December highs.
Tron Short Term Price Prediction
If the bears continue to drive the price lower, we can expect immediate support at the 171 SAT level. Beneath this, support lies at 162 SAT and 152 SAT (.886 Fib Retracement). Alternatively, if the buyers regroup and start to push higher, we can expect resistance at 190 SAT and 200 SAT. Above 200 SAT, resistance lies at 207 SAT (100-days EMA).
The RSI is in extreme oversold conditions, which shows that the sellers may be a little overextended. Similarly, the Stochastic RSI is extremely oversold as we wait for a bullish crossover signal to develop to send us higher.