The rally in the crypto-market undergoes as Bitcoin is only a few hundred dollars away from hitting its all time high. Bitcoin dominance is dropping drastically since November 18 providing enough space and volumes for the boost of altcoins. This week only Bitcoin dominance is down to 3.35%.Bitcoin dominance is in a downtrend since 2019 as more altcoins are introduced to the market.The November 18 drop of Bitcoin dominance boosted volumes to altcoins, such as Ripple and Ethereum. Both projects recently have introduced significant updates. Ripple announced that it’s now working with Central Banks and launched XRP Ledger promotions, Ethereum completed the Staking round for its PoS transition.XRP/USD since November 18 has gained a hefty +96.27 and touched a high of September 21. 2018 at
Topics:
<title> considers the following as important:
This could be interesting, too:
Emmanuel (Parlons Bitcoin) writes Un code moral pour l’âge d’or, la règle Bitcoin
Bitcoin Schweiz News writes April-Boom an den Märkten: Warum Aktien und Bitcoin jetzt durchstarten
Bitcoin Schweiz News writes VanEck registriert ersten BNB-ETF in den USA – Nächster Meilenstein für Krypto-ETFs?
Fintechnews Switzerland writes Revolut Hits Milestone of One Million Users in Switzerland
Bitcoin Schweiz News writes US-Rezession als Bitcoin-Turbo? BlackRock überrascht mit kühner Prognose
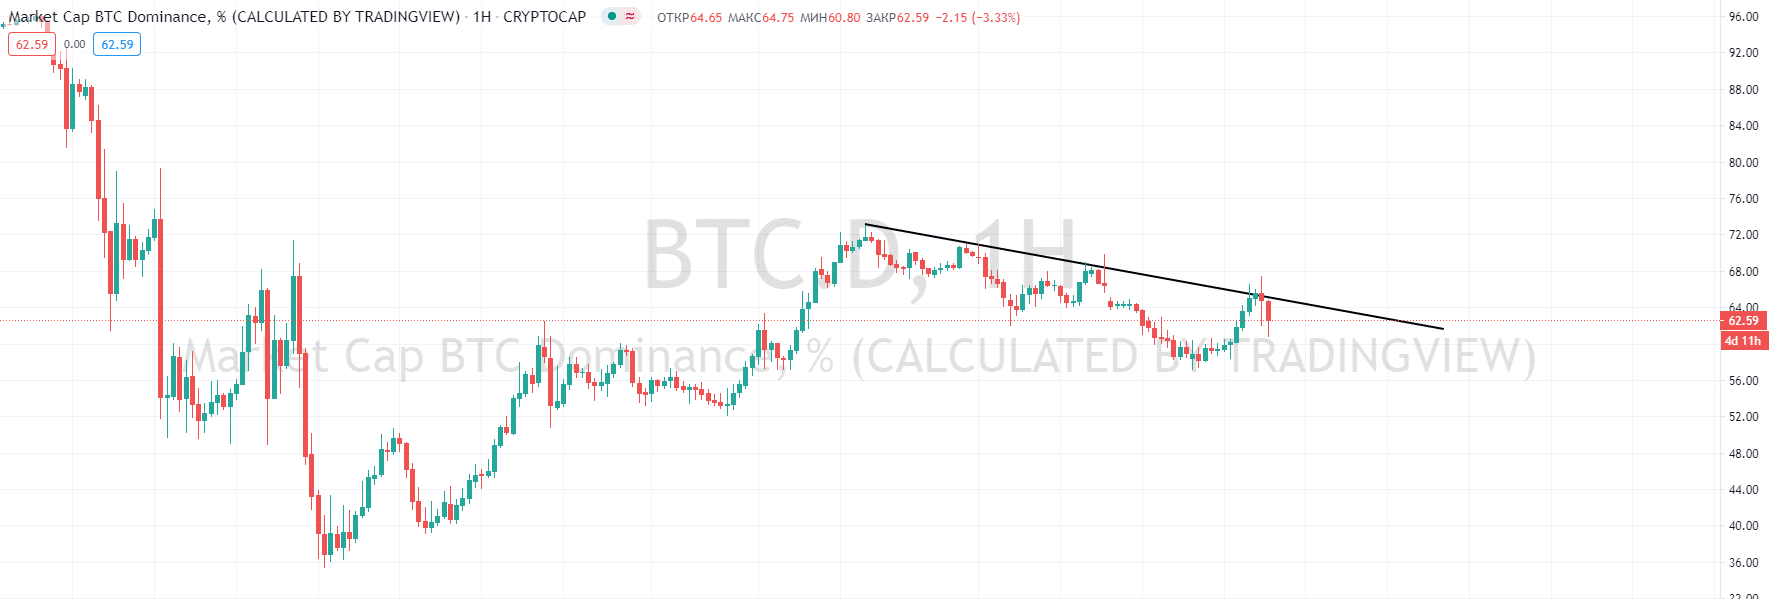
The rally in the crypto-market undergoes as Bitcoin is only a few hundred dollars away from hitting its all time high. Bitcoin dominance is dropping drastically since November 18 providing enough space and volumes for the boost of altcoins. This week only Bitcoin dominance is down to 3.35%.
Bitcoin dominance is in a downtrend since 2019 as more altcoins are introduced to the market.

The November 18 drop of Bitcoin dominance boosted volumes to altcoins, such as Ripple and Ethereum. Both projects recently have introduced significant updates. Ripple announced that it’s now working with Central Banks and launched XRP Ledger promotions, Ethereum completed the Staking round for its PoS transition.
XRP/USD since November 18 has gained a hefty +96.27 and touched a high of September 21. 2018 at $0.7814140. On a daily chart there is still enough room for Ripple’s price to grow, though RSI is pointing that further correction is inevitable.

In spite of the fact that Ripple was rejected by the resistance at $0.7814140, an hourly chart suggests that we should be prepared for another bull run. There is a symmetrical triangle on an hourly chart of XRP/USD and the pair has tested the upper edge of the triangle three times already. Breakout from the triangle will pump the price higher.

RSI on an hourly chart indicates that Ripple has completed the correction and is no longer on the oversold dead-zone of the indicator, MACD line has touched the signal line and is about to cross to confirm the bullish run, there is one more confirmation to be made which is a breakout from the triangle. If Ripple breaks below the triangle, support levels to watch are $0.618900 and $0.571720.
On November 23, Ripple announced that it officially added Bank of America as a RippleNET lead member. Bank of America is one of Ripple’s oldest clients contributing to the network since 2016, though only this year Ripple listed Bank of America among the other major banks, such as Santander, PNC and Nium. With such “coming out” Bank of America clearly states that Central Banks and the FED are looking towards CBDC’s and instant low-cost cross-border payment solutions.
Ethereum has shown significant growth as well, though I was sceptical on the completion of the staking, it went as planned and 524 288 ETH were staked at the Ethereum 2.0 contract. The official launch of the Ethereum 2.0 is planned on December 1, which is another date to watch for Ethereum investors and traders.
Just like Ripple, Ethereum’s token ETH still has a lot of room for growth. The bullish sentiment of ETH/USD is backed by one interesting pattern on a daily chart – double bottom.

ETH/USD has reached $623 and almost tested the high of June 03, 2018 at $625 and based on the double bottom pattern, the growth may continue up to $837 in mid-term. For the short-term there are several resistances that ETH has to overstep in order to continue the surge.
As seen on an hourly chart below, the pair has formed a bullish flag and the upper edge of the flag which simultaneously is a short-term dynamic resistance is still intact.

The most congenial price action at this point would be a decline towards $577 – $578, where the pair will hit the dynamic support and MA100, and a massive uptrend move. Nevertheless, the uptrend will be confirmed only if ETH closes above the dynamic resistance. If the breakout is confirmed in the nearest time, Ethereum will proceed further and close above this year’s high of $623.
The launch of Ethereum 2.0 will support the surge of the ETH price, as Ethereum 2.0 will apply shard-chains and will transition the whole network to PoS. The transition won’t happen rapidly, though if the launch is successful the mining cost of Ethereum will rise as the Network will apply a difficulty bomb – a protocol which perplexes mining of Ethereum.

Senior Vice President at Overbit. Technical analyst, crypto-enthusiast, ex-VP at TradingView, medium and long-term trader, trades and analyses FX, Crypto and Commodities markets.
