Bulls continue supporting Bitcoin at the time of descending corrections.By Dmitriy Gurkovskiy, Chief Analyst at RoboForex.After testing ,600, the cryptocurrency has quickly reached ,500. Many traders believe that declines below ,000 encourage investors to start buying. However, today Bitcoin price hasn’t been able to break the resistance area at ,000 yet.Photo: RoboForex / TradingViewToday Bitcoin price is confidently rebounding from the ascending trendline, which can be drawn in the H4 chart. A possible breakout of this line might force a correction but the price remains below it, thus confirming pressure from bulls. In addition to that, one can see a breakout of the descending trendline at the RSI. As a rule, such a signal hints at further growth and a breakout of the closest
Topics:
<title> considers the following as important:
This could be interesting, too:
Emmanuel (Parlons Bitcoin) writes Un code moral pour l’âge d’or, la règle Bitcoin
Bitcoin Schweiz News writes April-Boom an den Märkten: Warum Aktien und Bitcoin jetzt durchstarten
Bitcoin Schweiz News writes VanEck registriert ersten BNB-ETF in den USA – Nächster Meilenstein für Krypto-ETFs?
Fintechnews Switzerland writes Revolut Hits Milestone of One Million Users in Switzerland
Bitcoin Schweiz News writes US-Rezession als Bitcoin-Turbo? BlackRock überrascht mit kühner Prognose
Bulls continue supporting Bitcoin at the time of descending corrections.
By Dmitriy Gurkovskiy, Chief Analyst at RoboForex.
After testing $17,600, the cryptocurrency has quickly reached $19,500. Many traders believe that declines below $18,000 encourage investors to start buying. However, today Bitcoin price hasn’t been able to break the resistance area at $20,000 yet.

Photo: RoboForex / TradingView
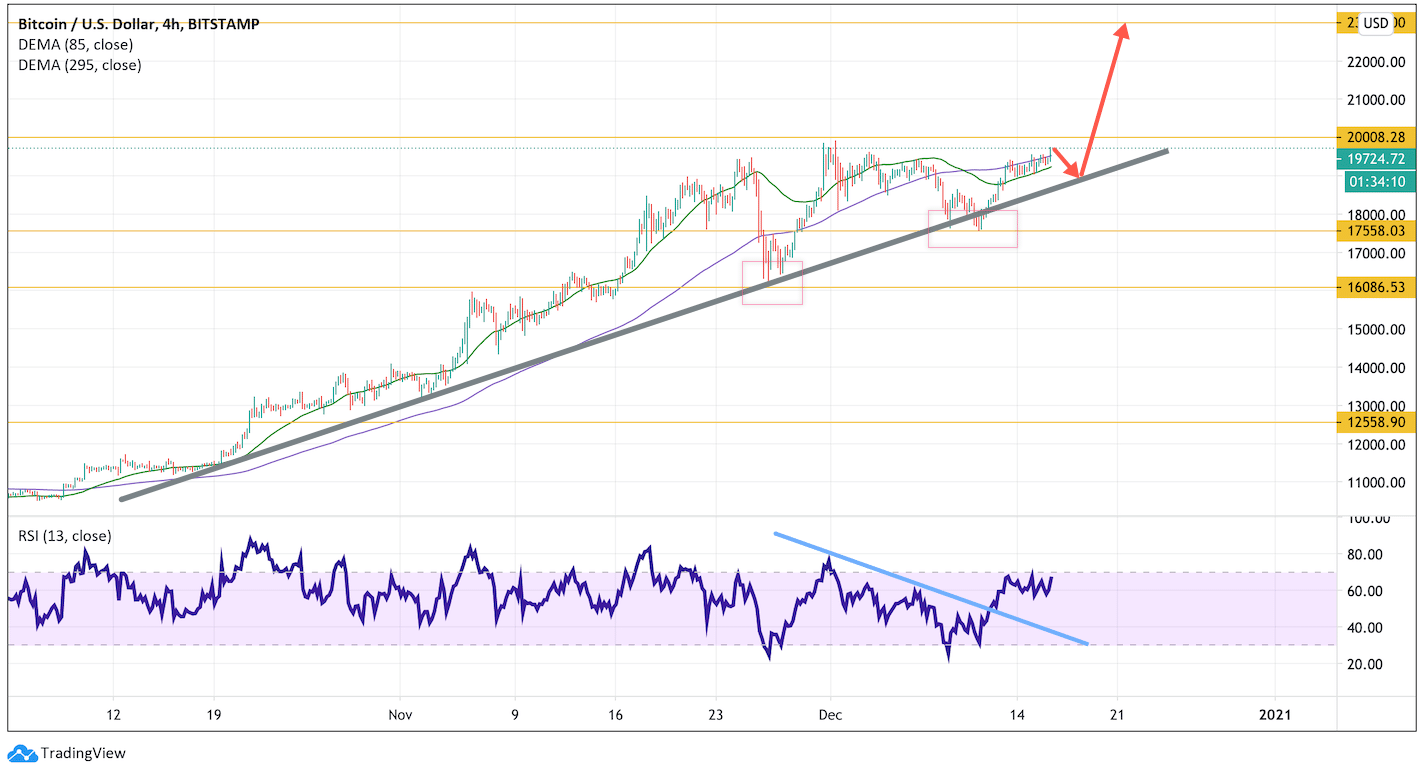
Today Bitcoin price is confidently rebounding from the ascending trendline, which can be drawn in the H4 chart. A possible breakout of this line might force a correction but the price remains below it, thus confirming pressure from bulls. In addition to that, one can see a breakout of the descending trendline at the RSI. As a rule, such a signal hints at further growth and a breakout of the closest resistance level.
Good news that may support the asset to break its all-time high is the increase in the total number of wallets with one or more Bitcoin. This number is extremely high, thus indicating that investors continue saving the cryptocurrency and aren’t looking to sell it.
Chinese authorities say that the digital yuan is not intended to replace global fiat currencies, such as the USD or the Euro. This asset is rather meant to make different payments as well as investments. With advances of the yuan, the European Central Bank is seriously worrying that the digital Euro may be quickly left behind in this matter. Sweden is also very active in exploring the possibilities of switching the country’s payment infrastructure to the digital Krona. Needless to say, that such activities on the part of governments and central banks will significantly arouse interest in the cryptocurrency industry in principle and that may have a positive influence on a further rally in BTC/USD.
Insurance and pension funds are also ready to invest some part of their assets in Bitcoin. Percentage-wise, such investments won’t be large but the sheer fact that big-time companies are intended to buy the cryptocurrency may attract conventional investors, who are still doubting whether to buy digital assets or not. Earlier, big private investors talked about their willingness to close their positions in Gold in favor of buying Bitcoin because the precious metal was fundamentally looking weaker than the major cryptoasset due to the difficulties with its transportation and payments. However, the key factor why cryptocurrencies remain popular is the falling profitability of precious metals and steadily rising profit from investments in Bitcoin.

Photo: RoboForex / TradingView
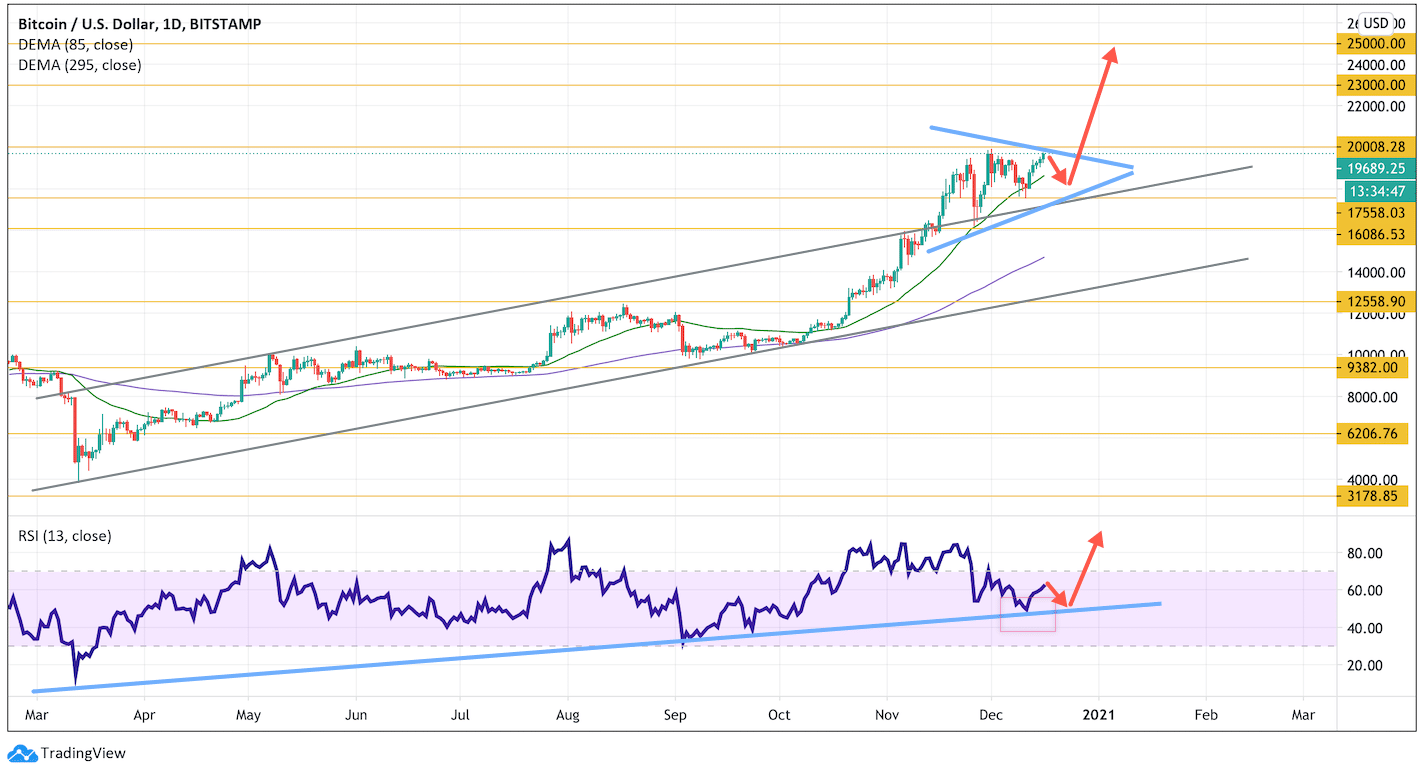
From a technical point of view, the daily chart shows a “Triangle” pattern. If the price breaks its upside border and fixes above $20,000, the asset will continue rising towards $23,000 within the frameworks of the pattern materialization. Another signal in favor of this idea is a rebound from the support line at the RSI. It’s very important for bulls to break the local high – otherwise, the price may fall to break $17,400 and complete the current trend. In this case, to reach the next downside target, the asset must cover the distance equal to the pattern’s height.
For this article, we’ve used BTCUSD charts by TradingView.
Disclaimer: Any predictions contained herein are based on the author's particular opinion. This analysis shall not be treated as trading advice. RoboForex shall not be held liable for the results of the trades arising from relying upon trading recommendations and reviews contained herein.

Dmitriy Gurkovskiy is a senior analyst at RoboForex, an award-winning European online foreign exchange forex broker.
