Cryptocurrencies continue consolidating.Dmitriy Gurkovskiy, a senior analyst at foreign exchange broker RoboForex, provides his vision of the possible tendencies in price changes for Bitcoin as well as for other major cryptos.The major digital asset is stuck inside a Triangle pattern and only a breakout of .565 may indicate further growth towards .865. However, the bearish pressure is also rising – we haven’t seen any growth in Ethereum, although it earlier demonstrated a nice ascending impulse. ETH/USD has tested the descending channel’s upside border in the daily chart, which may result in a rebound to the downside to reach 5. That’s why, one shouldn’t exclude a possibility of a new decline in BTC/USD towards .320 as well, where the asset may complete a huge reversal pattern.
Topics:
<title> considers the following as important:
This could be interesting, too:
Emmanuel (Parlons Bitcoin) writes Un code moral pour l’âge d’or, la règle Bitcoin
Bitcoin Schweiz News writes April-Boom an den Märkten: Warum Aktien und Bitcoin jetzt durchstarten
Bitcoin Schweiz News writes VanEck registriert ersten BNB-ETF in den USA – Nächster Meilenstein für Krypto-ETFs?
Fintechnews Switzerland writes Revolut Hits Milestone of One Million Users in Switzerland
Bitcoin Schweiz News writes US-Rezession als Bitcoin-Turbo? BlackRock überrascht mit kühner Prognose
Cryptocurrencies continue consolidating.
Dmitriy Gurkovskiy, a senior analyst at foreign exchange broker RoboForex, provides his vision of the possible tendencies in price changes for Bitcoin as well as for other major cryptos.
The major digital asset is stuck inside a Triangle pattern and only a breakout of $10.565 may indicate further growth towards $13.865. However, the bearish pressure is also rising – we haven’t seen any growth in Ethereum, although it earlier demonstrated a nice ascending impulse. ETH/USD has tested the descending channel’s upside border in the daily chart, which may result in a rebound to the downside to reach $175. That’s why, one shouldn’t exclude a possibility of a new decline in BTC/USD towards $6.320 as well, where the asset may complete a huge reversal pattern. After that, the entire cryptomarket may start a strong bullish uptrend and may consider conservative purchases.
Bitcoin
In the daily chart, bears are still defending the resistance level at $10,000. At the moment, BTC/USD is forming a Triangle pattern. The key trading idea remains the same: the asset is expected to break the pattern’s downside border and continue falling towards $6,320 to complete it. Another signal in favor of this idea will be a rebound from the descending trendline at the RSI. To confirm this scenario, the pair must break the support level and fix below $8,555. However, this scenario will no longer be valid if the price breaks the pattern’s upside border. In this case, the instrument may continue trading upwards with the first target at $11,900.
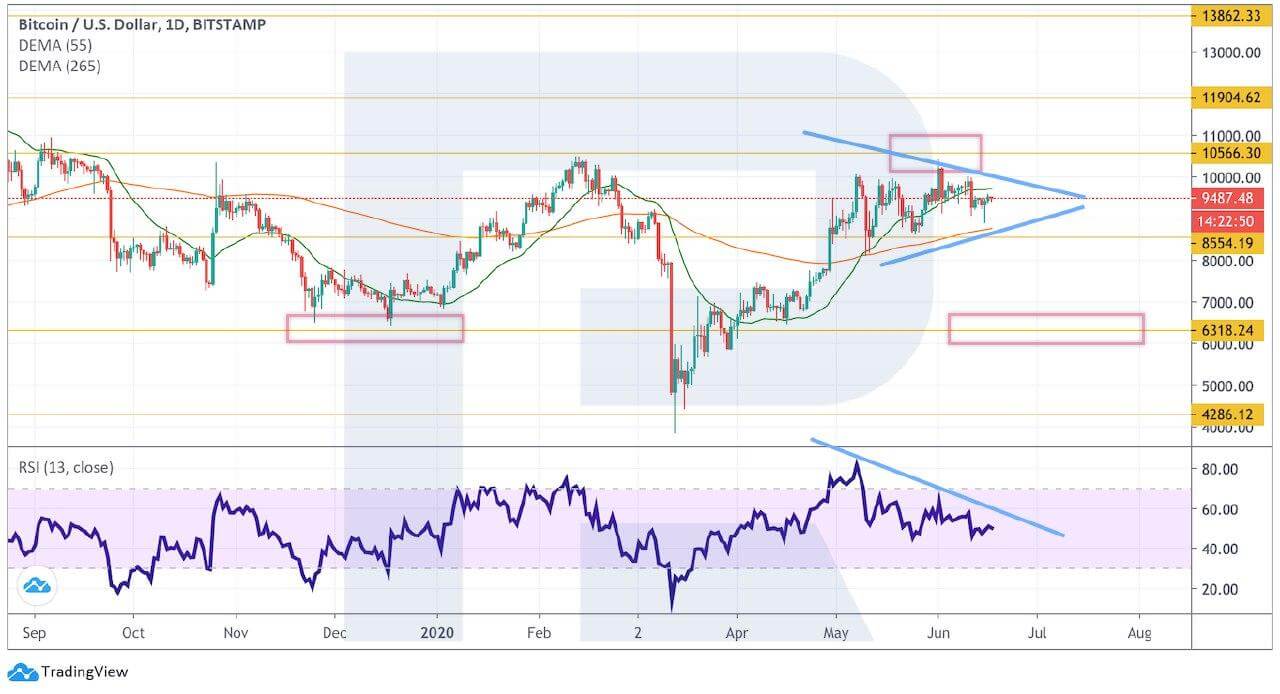
Photo: RoboForex / TradingView
As we can see in the H4 chart, BTC/USD is falling inside the descending channel. One shouldn’t exclude a possibility of a test of the channel’s upside border at $9,750 and further decline towards $8,875. If the price breaks the latter level, it may continue falling to reach $7,995. A strong signal in favor of this idea will be a rebound from the resistance line at the RSI. However, the bearish scenario may be canceled if the asset breaks the channel’s upside border at $10,045. In this case, the instrument may continue trading upwards to reach $10,565.
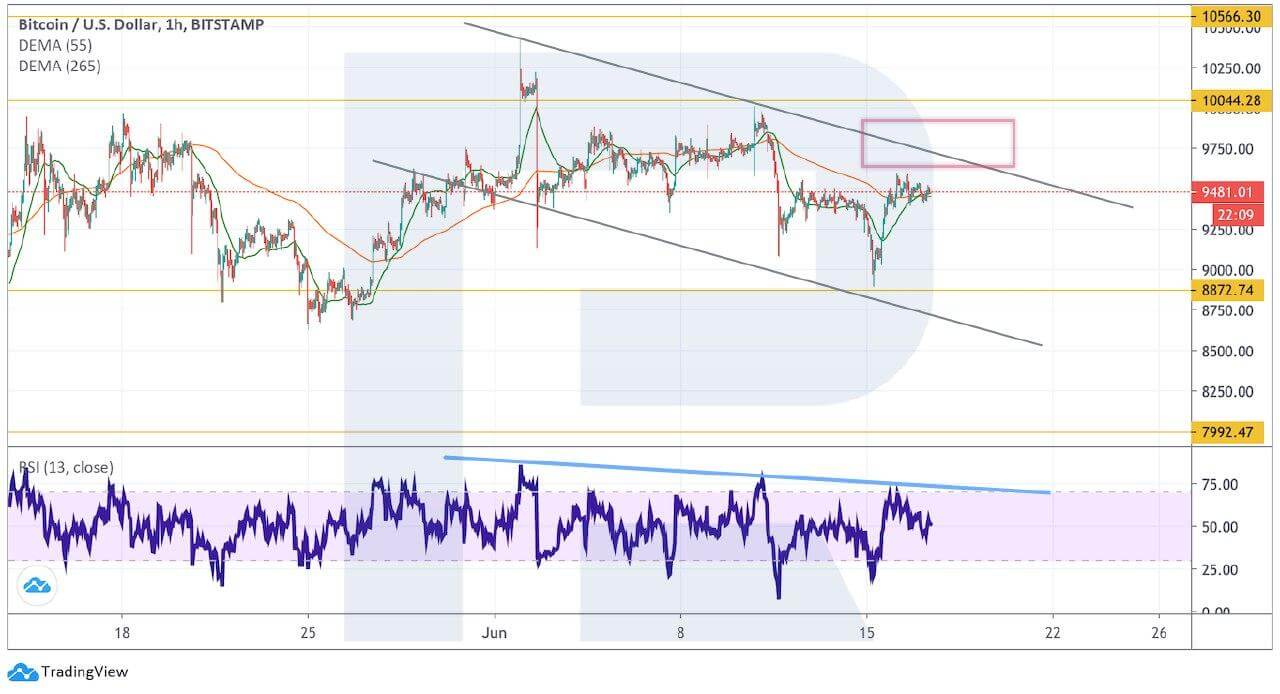
Photo: RoboForex / TradingView
Ethereum
As we can see in the daily chart, Ethereum is still correcting within the descending channel; bulls haven’t been able to fix the price above $253 to continue pushing it towards $287. The key trading idea implies a rebound from the channel’s upside border and a further decline with the first target at $175. A strong signal in favor of this idea is a rebound from the ascending support line at the RSI, which indicates a potential breakout of the rising channel’s downside border. However, this scenario may no longer be valid if the asset breaks the resistance level and fixes above $253. In this case, the instrument may switch to another scenario, which suggests further growth.
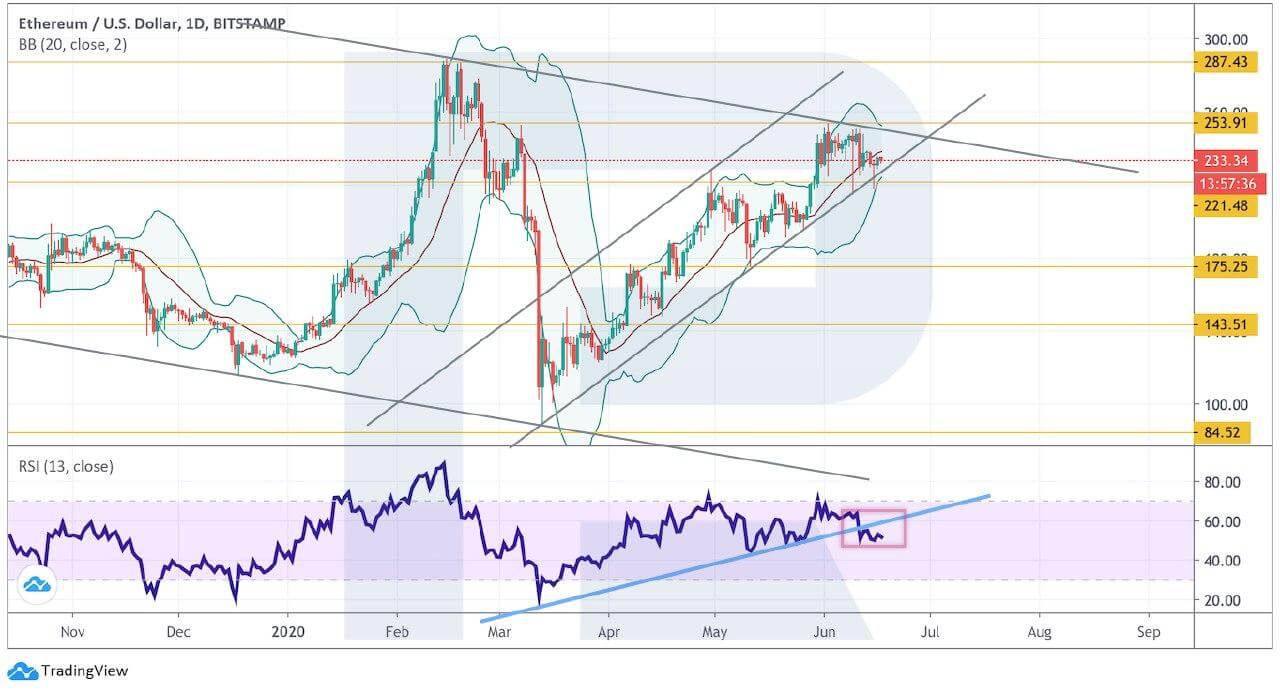
Photo: RoboForex / TradingView
On shorter timeframes, ETH/USD is falling within the descending channel. The RSI indicator has already rebounded from the resistance level, thus implying further decline right from the current levels. The first downside target is at $223, a breakout of which may result in a further decline towards $210. However, this scenario may be canceled if the instrument breaks the channel’s upside border and fixes above $241. In this case, the asset may continue trading upwards to reach $253.
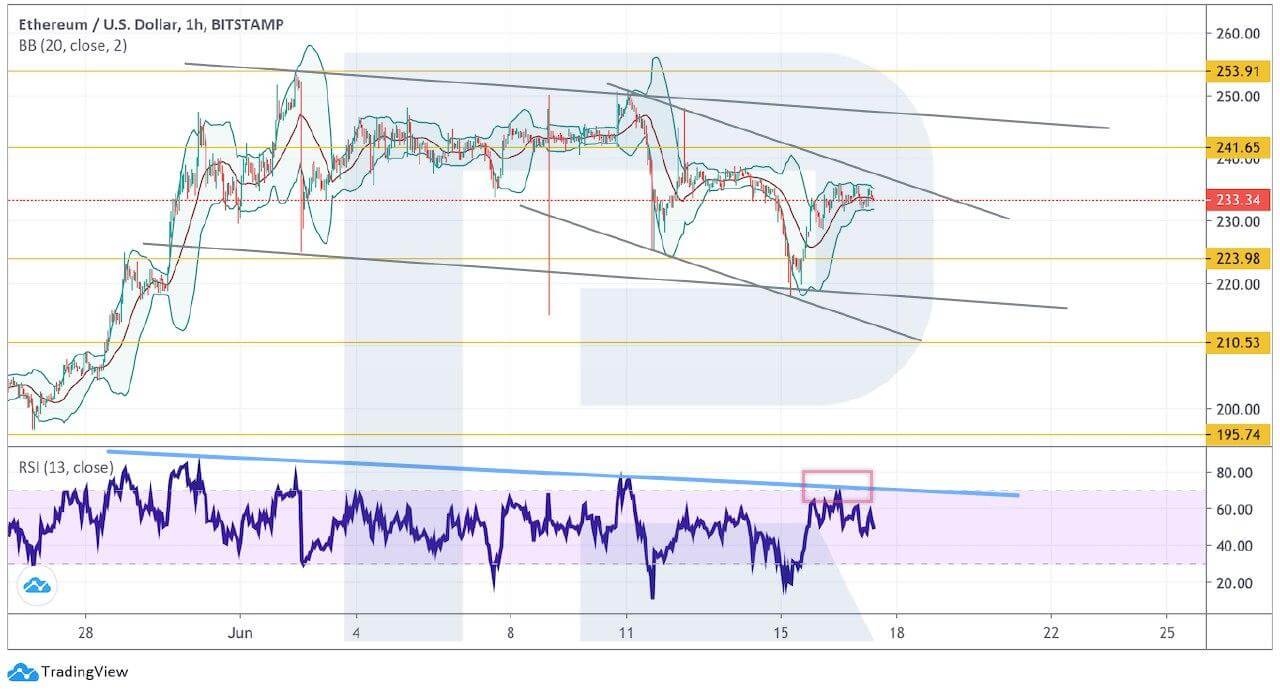
Photo: RoboForex / TradingView
Litecoin
In the daily chart, Litecoin is still correcting; a Triangle pattern remains in effect. The RSI indicator has already broken the ascending trendline, which means that there is a potential for a breakout of the pattern to the downside to start completing it with the predicted target at $24. To confirm this idea, the pair must break the pattern’s downside border and fix below $38. However, this scenario may no longer be valid if the asset breaks $51. In this case, the upside target will be $68.
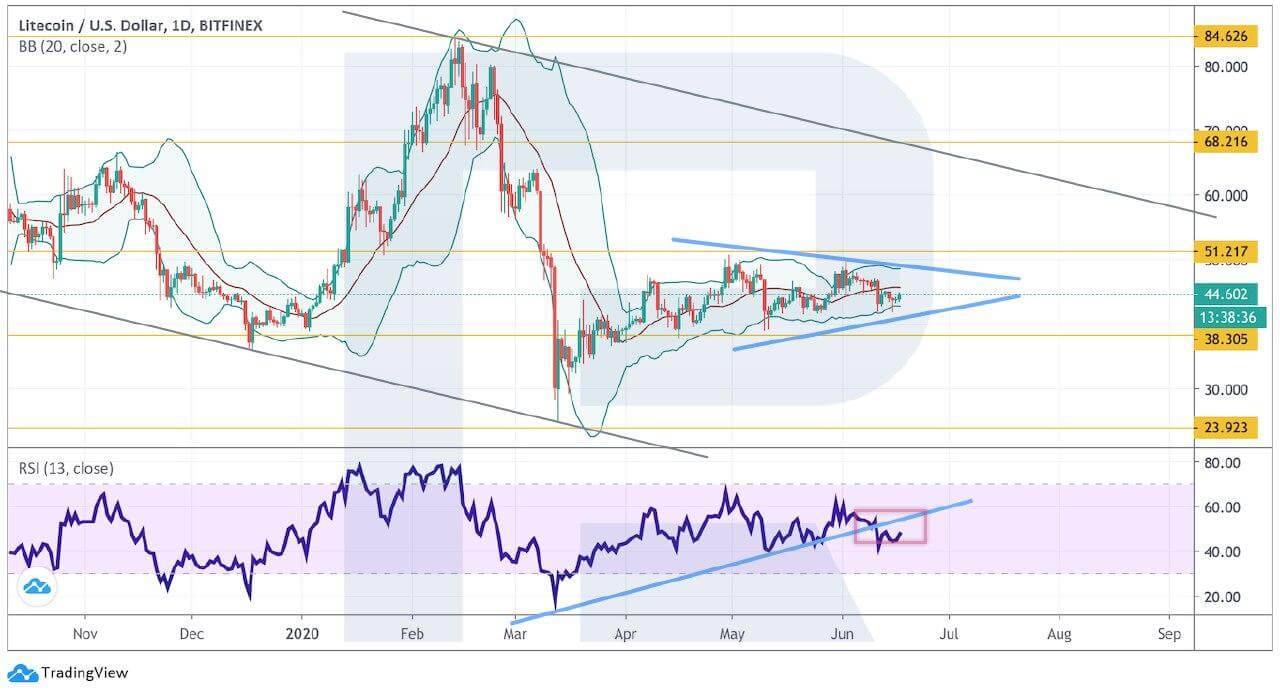
Photo: RoboForex / TradingView
As we can see in the H4 chart, LTC/USD is rebounding from the rising channel’s downside border. One should expect another rebound from the resistance level at $45 and a new decline to break $41, which may result in a further downtrend towards $38.75. A strong signal in favor of this idea is a rebound from the trendline at the RSI. However, this scenario may no longer be valid if the price breaks the descending channel’s upside border and fixes above $46. In this case, the instrument may continue trading upwards with the target at $48.
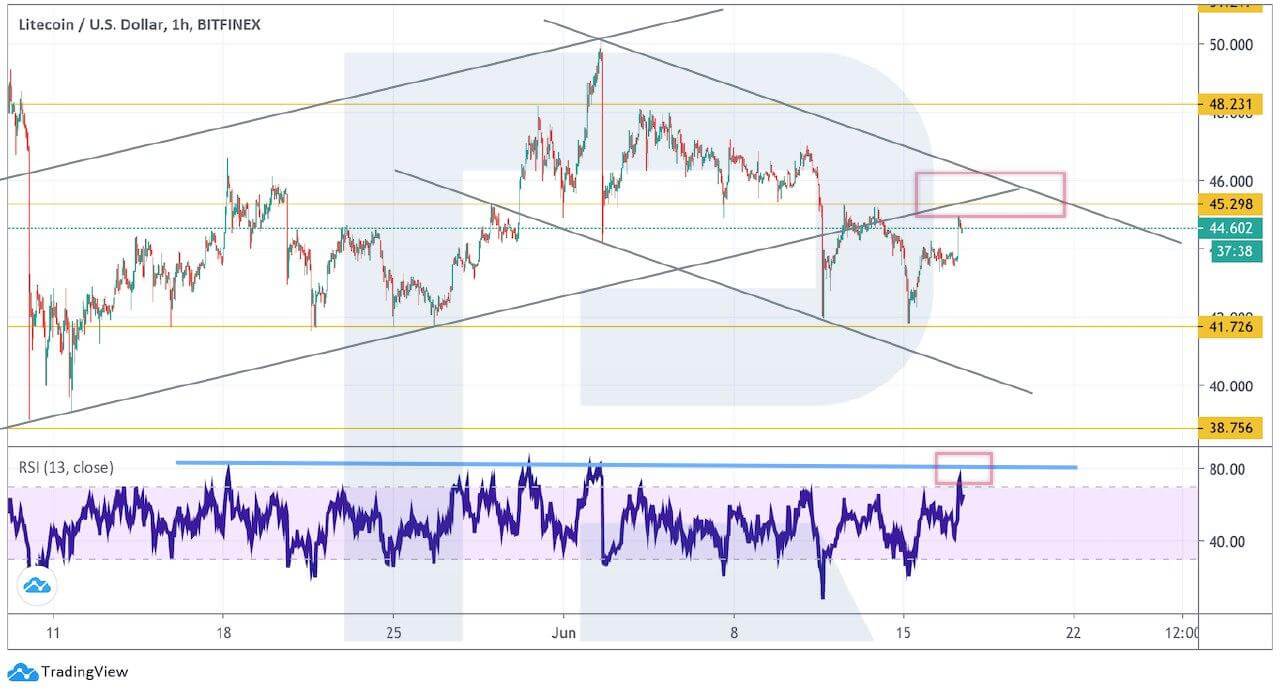
Photo: RoboForex / TradingView
Bitcoin Cash
As we can see in the daily chart, Bitcoin Cash is still stuck inside a Triangle pattern; the RSI indicator has also failed to break through its sideways channel. The key trading idea implies an attempt to break the pattern’s downside border, which may result in a further decline towards $136. However, this scenario may no longer be valid if the price breaks the pattern’s upside border and fixes above $280. In this case, the instrument may continue trading upwards to reach $356.
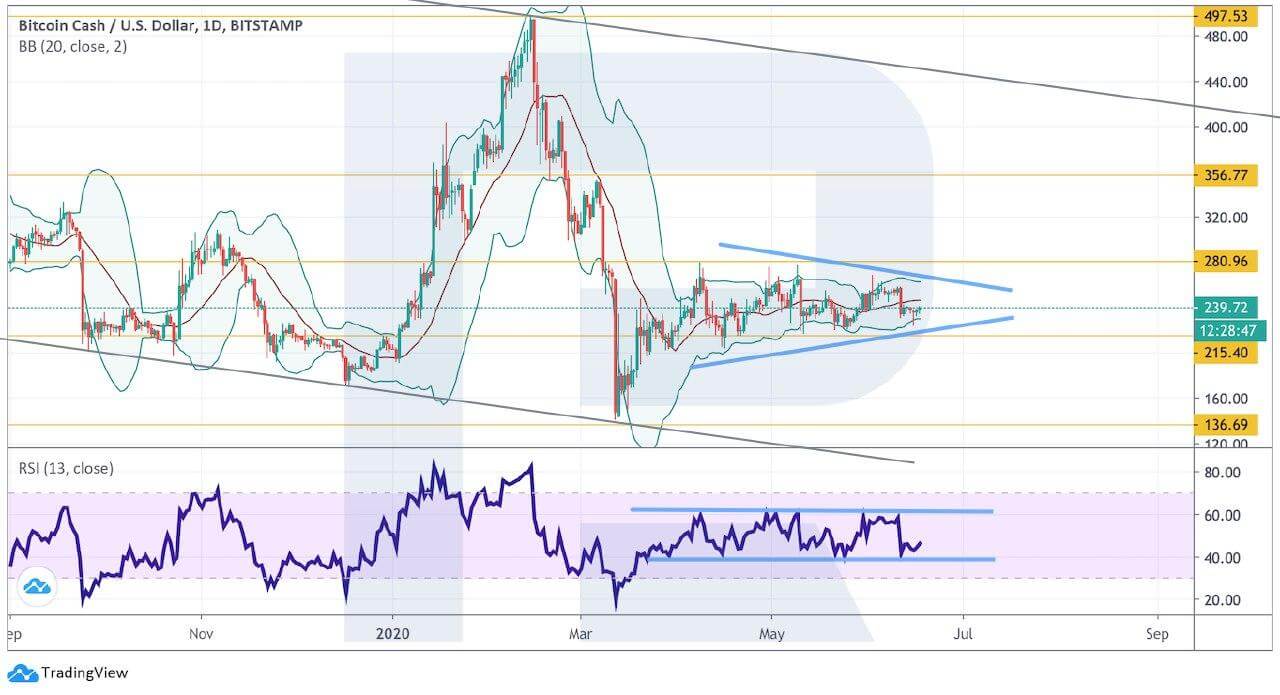
Photo: RoboForex / TradingView
In the H4 chart, the asset is no longer moving within the short-term ascending channel; right now, it is testing the channel’s broken border. There is a potential for a rebound and a new decline to break $228, which may result in a further downtrend towards $213. However, this scenario may be canceled if the pair breaks $250. In this case, the instrument may return into the channel and continue trading upwards to reach $264.
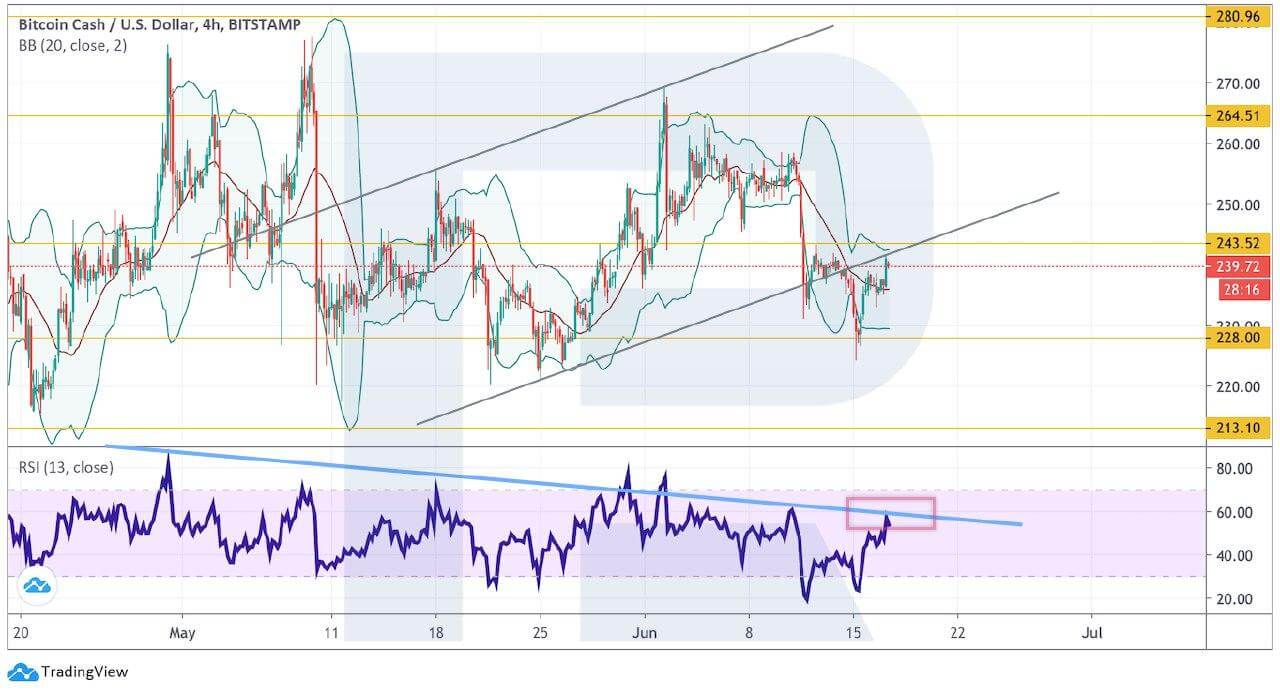
Photo: RoboForex / TradingView
EOS
In the daily chart, EOS is stuck between the resistance and support levels, thus forming a sideways channel. At the same time, one can see a Triangle pattern here. The RSI has broken the ascending trendline, thus indicating a possible breakout of the pattern’s downside border and further decline towards $1.32. To confirm this idea, the price must break the support level and fix below $2.32. it should also be noted that the instrument is moving below Ichimoku Kinkō Hyō Cloud, thus indicating the bearish tendency and further downtrend. However, this scenario may be canceled if the cryptocurrency breaks $2.87. In this case, the asset may continue trading upwards with the target at $4.10.
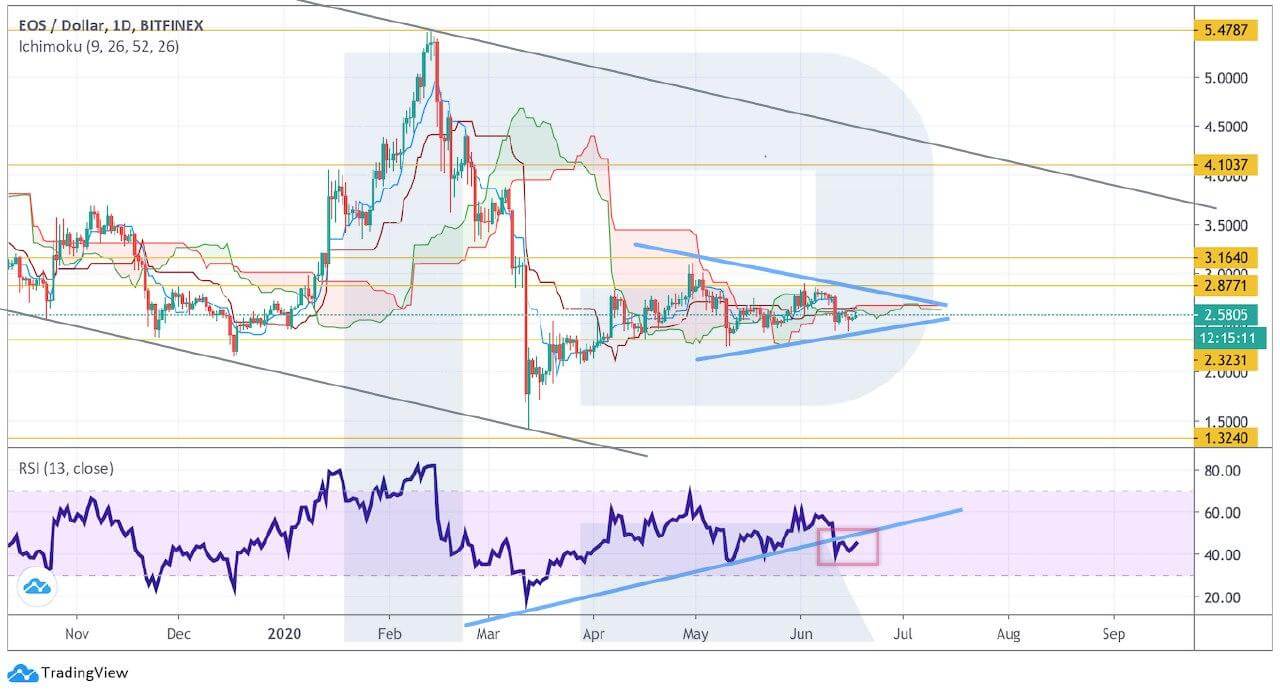
Photo: RoboForex / TradingView
As we can see in the H4 chart, EOS is rebounding from the Cloud’s downside border and it also confirms a bearish impulse. There are chances to see a rebound and a new decline towards the closest support at $2.40. A good signal in favor of this idea will be a rebound from the resistance line at the RSI. However, this scenario may be no longer valid if the instrument breaks the Cloud’s upside border at $2.65. In this case, the asset may resume moving upwards.
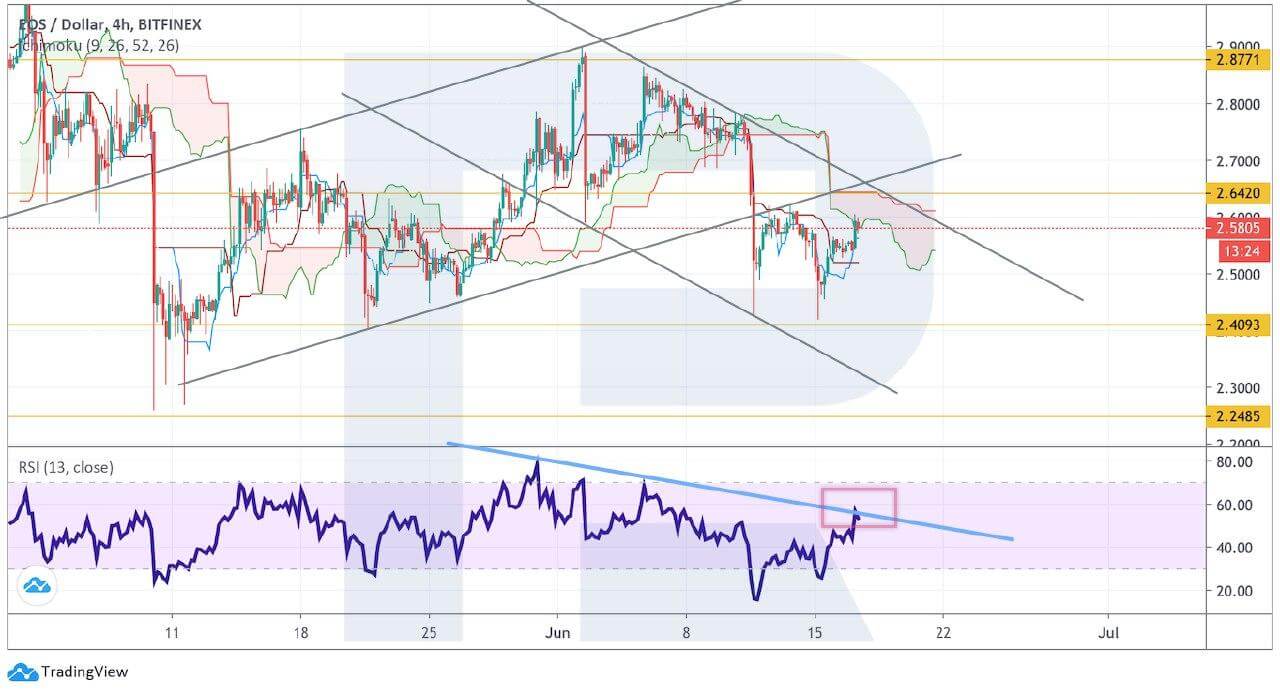
Photo: RoboForex / TradingView
Disclaimer: Any predictions contained herein are based on the authors' particular opinion. This analysis shall not be treated as trading advice. RoboForex shall not be held liable for the results of the trades arising from relying upon trading recommendations and reviews contained herein.

Dmitriy Gurkovskiy is a senior analyst at RoboForex, an award-winning European online foreign exchange forex broker.