Against Bitcoin, ETC may face weekly resistance at 0.0015SAT levelETC is following a bullish sentiment across trading pairsETC/USD: ETC Buyers Regroup Stronger Following The Break Above 2019 HighKey Resistance Levels: , Key Support Levels: , ETC/USD. Source: TradingViewAfter a weak correction to , Ethereum Classic bounced back with more than 50% gains in just three days of trading. Over the past few hours, ETC’s price has increased by 16.48% and now changing hands around .34 price level.Volatility has been quite significant so far in 2020. ETC is now stirring up for a long-term price explosion. Ethereum Classic is already going parabolic in the mid-term. At the moment, the 11th largest cryptocurrency is holding a market cap of .43 billion.Ethereum Classic Price
Topics:
Michael Fasogbon considers the following as important: ethereum classic, Price Analysis
This could be interesting, too:
CryptoVizArt writes ETH’s Path to K Involves Maintaining This Critical Support (Ethereum Price Analysis)
Duo Nine writes Crypto Price Analysis June-29: ETH, XRP, ADA, DOGE, and DOT
Duo Nine writes Crypto Price Analysis June-15: ETH, XRP, ADA, DOGE, and DOT
Duo Nine writes Why is the Shiba Inu (SHIB) Price Down Today?
- Against Bitcoin, ETC may face weekly resistance at 0.0015SAT level
- ETC is following a bullish sentiment across trading pairs
ETC/USD: ETC Buyers Regroup Stronger Following The Break Above 2019 High
Key Resistance Levels: $16, $20
Key Support Levels: $10, $8
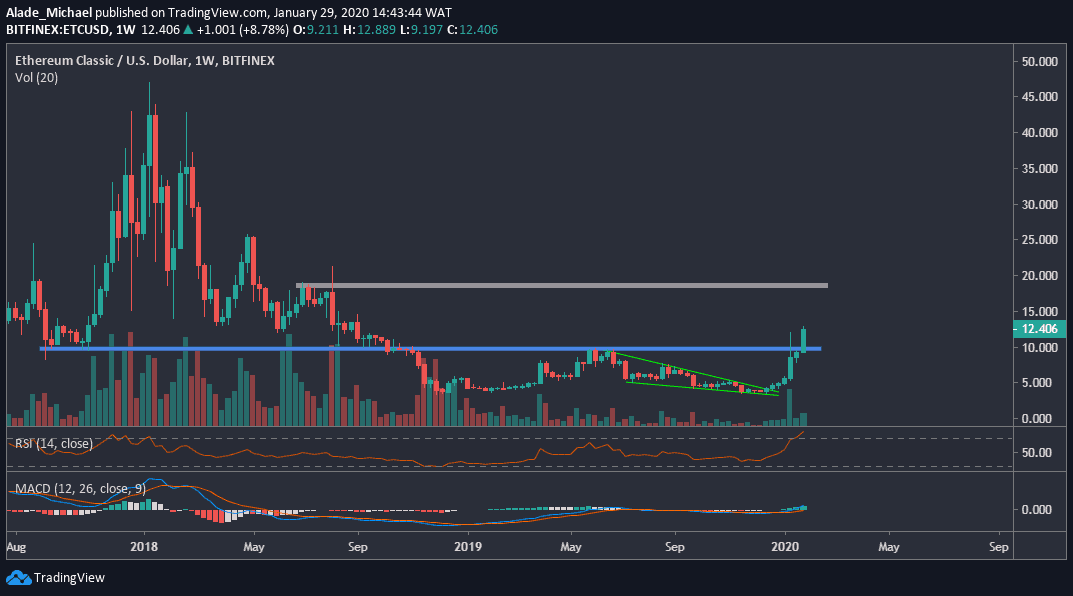
After a weak correction to $8, Ethereum Classic bounced back with more than 50% gains in just three days of trading. Over the past few hours, ETC’s price has increased by 16.48% and now changing hands around $12.34 price level.
Volatility has been quite significant so far in 2020. ETC is now stirring up for a long-term price explosion. Ethereum Classic is already going parabolic in the mid-term. At the moment, the 11th largest cryptocurrency is holding a market cap of $1.43 billion.
Ethereum Classic Price Analysis
ETC has laid a big egg on the weekly chart following the recent break above blue zone – the 2019 high of $10. This break has signaled a long-term growth for ETC. As shown on the price chart, ETC next target is $16 and $20. Meanwhile, the price increase was noticeable after breaking from a small descending triangle in late 2019.
More importantly, the recent break on the blue line has confirmed a double-bottom pattern, accompanied by a complete weekly reversal. This might be the beginning of a bull-run.
Adding to this, ETC is overbought on the weekly RSI, although the bullish momentum is just about to start on the weekly MACD. However, if the price drops from the RSI’s overbought region, ETC may retest $10 support. An extension of this drop could slump the price to $8.
ETC/BTC: ETC is Just Coming Up, Waiting For a Bullish Confirmation
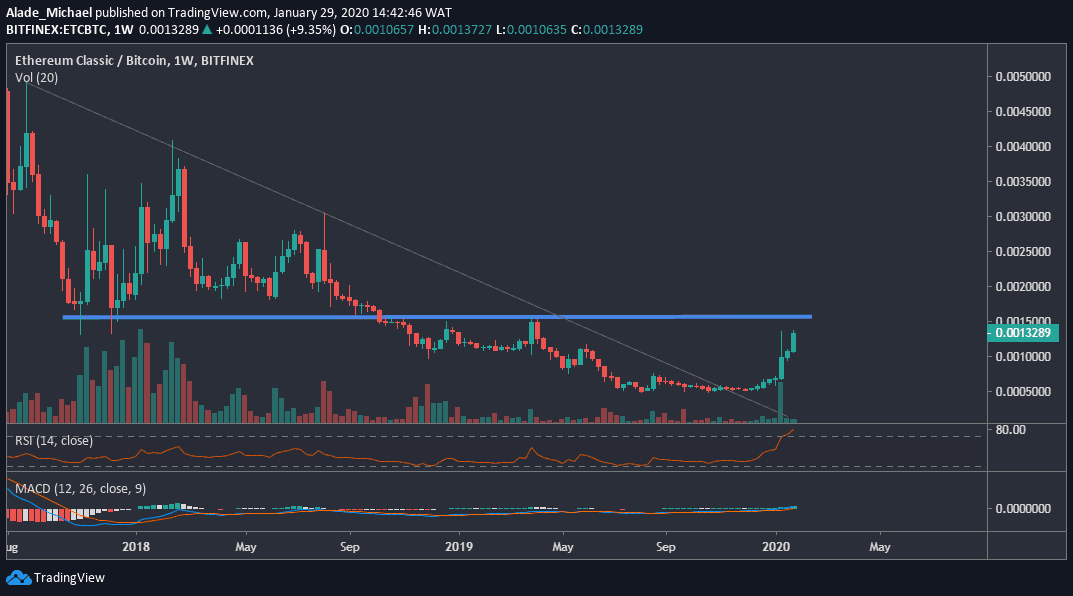
Ethereum Classic continued to show strength over the past few weeks now. Following an 8.01% gains under 24-hours, ETC is currently trading around 0.001328SAT level against Bitcoin. The price is now approaching a critical resistance level after witnessing significant volume since the monthly opening. Due to this, ETC momentum is getting stronger by the day.
Ethereum Classic Price Analysis
Ethereum Classic is just coming up on the weekly time frame, although the cross above the grey descending line has positioned the market for a long-term bullish trend. But ETC is yet to overcome an important resistance that could pose a threat to buyers in the future. This important resistance is located at 0.0015SAT level – the blue area on the chart. Notwithstanding, ETC has shown strength over the past weeks.
Following the increase, characterized by three weekly candles, ETC may advance higher to the resistance mentioned above. If it breaks, the price is most likely to double at immediate resistance of 0.0030SAT level. Meanwhile, the market is holding support at 0.0005SAT level.
Paying attention to the technical indicators, the price of ETC is currently overstretched on the weekly RSI – suggesting a potential drop. The weekly MACD is moving sideways to indicate indecisiveness in the market. The bullish confirmation would trigger once MACD produces a positive cross.