XRP/USD: Ripple Waiting For Next MoveKey Resistance Levels: $0.6, $0.678, $0.78Key Support Levels: $0.50, $0.437, $0.33XRP/USD. Source: TradingViewAfter breaking out of a crucial resistance on Wednesday, Ripple touched $0.68 and pulled back to where it’s now consolidating at $0.577. Volatility is low at the moment but it could resume its bullish momentum as soon as it finds key support. While the market remains indecisive, it has still gained 12% in the past week.Considering the mid-week breakout, the market seems likely to go in favor of the bulls. For this to happen, though, the buying volume needs to increase a lot compared to its current levels.XRP-USD: Resistance and Support LevelsAs we wait for the next major movement, the important level to watch is the $0.6 resistance. This is
Read More »Articles by Michael Fasogbon
Crypto Price Analysis & Overview December 18th: Bitcoin, Ethereum, Ripple, Litecoin, and Bitcoin Cash
December 18, 2020The last week saw the entire cryptocurrency market painted in green. Interestingly enough, Litecoin is the major altcoin that gained the most, with BTC following in second place. Unfortunately for XRP bulls, it failed to realize any substantial profits over the past seven days. BitcoinBitcoin saw an impressive growth over the past few days, resuming its long-term bullish trend with full speed. From around the $17,100 correction level, the leading cryptocurrency bounced back with roughly 25% gains to break above the $20,000 mark. It later registered a new ATH around $23800 yesterday, but the price has dropped to $22,690 at the time of this writing.Since Bitcoin registered a new high, it has managed to hold the $22,200 level as support. The trend is still looking strong on the daily chart.
Read More »ETH Skyrockets 12% To Highest Level Since May 2018, Is $700 Incoming? (Ethereum Price Analysis)
December 17, 2020ETH/USD: Ethereum Resumes Bullish RunKey Resistance Levels: $700, $720, $750Key Support Levels: $636, $600, $538ETH/USD. Source: TradingViewFollowing Bitcoin, Ethereum finally resumed its bullish run after recording a substantial 18% increase in the past 7 days. It broke to a new yearly high (where it now trades around $666) with a 12% gains overnight. Because of this, its market cap is now up to roughly $75 billion, at the time of writing. This is also the highest price for ETH since May 2018.Considering the above, it’s important to note that bulls are now taking charge of the market. The price is breaking away from the ascending channel to indicate that a fresh rally is underway. The price is likely to create more highs if this surge continues.ETH-USD: Resistance and Support LevelsShould
Read More »Ripple Price Analysis: XRP Skyrockets 10%, Will The $0.5 Support Hold?
December 16, 2020XRP/USD: Ripple Bounces BackKey Resistance Levels: $0.52, $0.6, $0.7Key Support Levels: $0.458, $0.4, $0.33XRP/USD. Source: TradingViewOver the past few hours, XRP saw a quick 10% recovery to where it’s trading around $0.50 at the time of writing. This follows the most recent BTC rally to a new all-time high above $20,000.Looking at the current market structure, the bearish bias still appears strong on the 4-hours chart. Although, a strong recovery may come into play once bulls show further interest. As can be seen on the chart, XRP has found temporary support above $0.45 inside the green zone.XRP-USD: Resistance and Support LevelsA clear break above the current levels can push the price further to $0.6 and $0.7 levels. It may revisit $0.73 resistance if the price continues to increase.If
Read More »Chainlink Price Analysis: LINK Sideways Action Might See A Huge Move Soon
December 15, 2020LINK/USD: Link Bounces Back SlightlyKey Resistance Levels: $14, $16, $17.34Key Support Levels: $11.2, $9.6, $7.29LINK/USD Chart. Source: TradingViewChainlink increased by a small 1.3% today due to the slight recovery in the entire crypto market since last Friday. It’s now priced at $12.6. Despite the latest corrections, LINK still appears bullish on the daily chart. It recently found support on the ascending trend line drawn from September’s low.Looking at the 4-hours chart, LINK is yet to confirm a fresh increase. However, the interesting thing here is that buyers have shown interest during the last couple of days. A positive move can be anticipated shortly. But unfortunately, buying pressure is low at the moment.LINK-USD: Resistance and Support LevelsIf the ascending trend line continues
Read More »Can ETH Clear $600 And Reignite The Bullish Bias? (Ethereum Price Analysis)
December 15, 2020ETH/USD: Price Consolidates After A ReboundKey Resistance Levels: $600, $636, $700Key Support Levels: $530, $489, $450ETH/USD. Source: TradingViewEthereum saw a 2% increase over the past hours following recovery from $530 over the weekend. These gains have pushed the second largest coin by market cap to its current price of $586. ETH is likely to face critical resistance at $600.Volatility may be low at the moment but its bullish trend is still looking strong in the long-term. Meanwhile, the last 21-day correction still keeps the market in favor of the bears. However, to reactivate a fresh increase, the $600 remains a key psychological level for the bulls to clear.ETH/USD: Resistance and Support LevelsAs mentioned above, if the price climbs further and increases above $600, the next
Read More »Ripple Struggles At 50 Cents, More Downside Action? XRP Price Analysis
December 14, 2020XRP/USD: Sellers Remains In ChargeKey Resistance Levels: $0.59, $0.7 $0.78Key Support Levels: $0.5, $0.4, $0.33Despite the recent recovery in Bitcoin above $19,000, XRP continued to show weakness as it failed to reclaim the $0.5 support. As of now, it is trading around $0.495 with a daily 5% decrease.The trend is still looking bearish in the short-term following a series of rejections at the descending resistance forming since November. Both the 4-hours RSI and MACD indicators confirm that sellers are in charge. However, there’s hope for a long-term bullish continuation as long as the market remains well above the $0.3 level.XRP-USD: Resistance and Support LevelsFollowing the latest drops in price, the next support to keep an eye on is the November correctional level at $0.458. Below this,
Read More »Crypto Price Analysis & Overview December 11th: Bitcoin, Ethereum, Ripple, Cardano, and Chainlink
December 11, 2020This week had the entire cryptocurrency market painted in red as Bitcoin withdrew to a low of $17,650 before recovering to where it currently trades at. All of the altcoins followed suit, and as a result, they’ve charted substantial decreases over the course of the past seven days, as seen in the graph below.Bitcoin lost roughly 5.6% over the past 7 days now. Following the latest drops, the leading cryptocurrency is now floating around $18,000.However, its long-term bullish trajectory is still looking much valid on the current daily chart. However, considering a mid-term bearish movement, Bitcoin would need to drop off the ascending trend line forming since March. A short-term reversal would confirm if the weekly $16,235 support level fails to hold. The next key supports lie at $15,100 and
Read More »Ripple Price Analysis: Can XRP Bulls Break Out Prior to SPARK Airdrop?
December 10, 2020XRP/USD: XRP Looking For A BreakoutKey Resistance Levels: $0.6, $0.7 $0.8Key Support Levels: $0.5, $0.4, $0.3After yesterday’s $35 billion crash in the crypto market, XRP had managed to recovery with roughly 10% gains at the time of writing. Despite the low buying volumes, it is still trading around $0.57 price levels.Meanwhile, the third-largest coin by market cap is holding a correction in a symmetrical triangle for the past weeks. Although, a breakout could be expected soon. The RSI has found a bottom at 30, suggesting a reversal. However, the MACD is yet to confirm the bullish trend.XRP-USD: Resistance and Support LevelsLooking at the formed bull flag pattern in the above chart, if there’s an increase, it can be anticipated toward $0.8 levels in the coming days. The closest resistance
Read More »Ethereum Price Analysis: ETH Plunges 7% In 24-Hours, Will Critical Support Hold?
December 9, 2020ETH-USD: Ethereum Trapped In A TriangleKey Resistance Levels: $600, 625, $650Key Support Levels: $530, $494, $450ETH/USD. Source: TradingViewEthereum marked a daily 7% drop to $530 (today’s low) following the latest decline in Bitcoin’s price. However, just last Bitcoin, the second-largest cryptocurrency, had also seen a brief rebound of roughly 5%. Despite the recent plunge, the longer-term trend is still bullish.In the mid-term, as can be seen in the above 4-hours chart, Ethereum is currently trapped in a triangle pattern as it primes for a huge movement on a breakout.ETH-USD: Support and Resistance LevelsConsidering a triangle breakdown, especially below the daily support at $530, the price could collapse to around $490 before dropping further to $450 if the first doesn’t hold.However,
Read More »Bitcoin Cash Price Analysis: BCH Follows Suit With a Strong Move to $294
July 29, 2020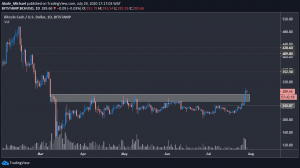
Following a steady recovery from $216, Bitcoin Cash pushed above the crucial $280 level with 25% gains in 7 days.
Against Bitcoin, the price continues to remain in a consolidation phase after three months decline.
BCH/USD: BCH Waiting After A Slight Breakout
Key Resistance Levels: $352, $409, $428
Key Support Levels: $280, $258, $245
BCH/USD. Source: TradingViewFollowing the massive surge in Bitcoin’s and Ethereum’s price, Bitcoin Cash has also seen decent growth over the past days now. BCH currently trades at around $290.
Bitcoin Cash started to show strength after pushing through $245 over the weekend with a nice break above the key supply area ($258 – $280), which suppressed bullish actions for the past four months. Considering this latest breakout to $298 (Bitstamp)
Chainlink Price Analysis: LINK Follows ETH’s Surge With Another Shot at $8
July 23, 2020
Link resumed its bullish trend after breaking above a crucial resistance line.Buyers may continue the trend if the price increases above the current monthly high.LINK/USD: Link Starts Fresh Increase From $7Key Resistance Levels: $8.2, $8.6, $8.9Key Support Levels: $7.6, $7.3, $7Last week, Chainlink almost hit $9 after breaking above a four-month high with over 90% gain in two weeks. But unfortunately for the bulls, the price got rejected with a weekly correction to near $7 – where it bounced back yesterday.Looking at the bigger picture on the hourly chart, the cryptocurrency is looking bullish again after breaking through an important resistance line earlier today. It is now trading well above the $7.6 resistance-turned-support after seeing nice 6% gains overnight.Chainlink Price
Read More »Chainlink Price Analysis: LINK Marines Hold Strong Support At $7.10 But Can They Push Higher?
July 21, 2020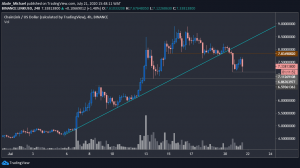
Chainlink’s price decreased by 7% overnight.It may resume the uptrend if the previous monthly breakout level can hold as support.LINK/USD: Price Holding Above $7.1Key Resistance Levels: $7.83, $8.2, $8.9Key Support Levels: $7.11, $6.86, $5.7LINK/USD. Source: TradingViewEarlier this month, Chainlink saw an impressive 95% surge to reach $8.9 on July 16 after finally claiming the crucial $5 resistance-turned-support level that suppressed bullish actions in the weeks before. Today, however, LINK lost over 6.10% of its value to reach the current trading price of $7.33.Following yesterday’s breakdown of the rising trend line – which confirmed the weekly reversal – LINK could head to the support at $6.8 (last week’s low) in the next couple of days.A break below this support could cause more pain
Read More »Chainlink Explodes To a New All-Time High: $10 Soon? (LINK Price Analysis)
July 15, 2020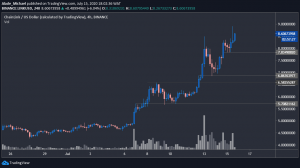
Chainlink continues its bullish sentiment after seeing some correction on Monday. Current ATH around $9The price is likely to reach $10 in case the bullish momentum proceeds.LINK/USD: Chainlink Resumes The Buy PressureKey Resistance Levels: $8.9 – $9, $9.5, $10Key Support Levels: $7.83, $6.86, $5.7After climbing above $5 earlier this month, Chainlink saw an impressive 70% increase to reach over $8.9 earlier today. The price couldn’t hold there, and of writing these lines, LINK is trading around the $8.5 mark.Looking at the current price actions, the 8th largest cryptocurrency by market cap is regaining momentum after correcting to around $6.86 on Monday.However, buyers are still aiming to push the price towards $9 level. A daily close above $9 can be a bullish sign for
Read More »Cardano Price Analysis: ADA Looks for Decision Around $0.13
July 14, 2020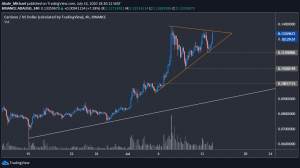
Cardano found support slightly above $0.12 after losing 8% in two days.Despite the bearishness, it remained bullish on a short-term perspective.ADA/USD: Cardano Trapped Inside A Triangle Key Resistance Levels: $0.133, $0.14, $0.16Key Support Levels: $0.121, $0.11, $0.1ADA/USD. Source: TradingViewCardano’s price has dropped by almost 6% following the last 24-hours decrease in the entire crypto market. Despite the bearishness, it is still looking bullish on a short-term perspective as the price remains trapped inside a triangle pattern, as spotted in the above chart.The bullish action is likely to continue if the buyers can push the price back, especially above the triangle. But if the bears step up again, the price could break below the triangle to find solid support for a rebound.The key
Read More »Tezos Price Analysis: XTZ Arrives To The Alt-Season Party After 22% 2-Day Surge
July 13, 2020Tezos’s recovery is quickly approaching the March level of $3.3 after gaining almost 33% in 7 days.It has resumed a mid-term bullish trend following a break above a crucial resistance line across trading pairs.XTZ/USD: Tezos Charging Towards June ResistanceKey Resistance Levels: $3.3, $3.5, 3.9Key Support Levels: $2.85, $2.75, $2.69XTZ/USD. Source: TradingViewAfter the June 6 recovery from around $2.2, Tezos established support around $2.4 and continued to show strength over the past days. The price is now charging back towards $3.14, following a massive 15.61% increase over the past 24-hours.It is currently changing hands around $3.1 against the US Dollar. Following the recent break above the 4-week resistance line – marked white – Tezos is currently maintaining a strong bullish trend on
Read More »Stellar Price Analysis: XLM Hits New Yearly High With 20% Daily Gains
July 9, 2020Stellar jumped above a 12-month high following 21% daily gains.Against Bitcoin, it’s currently trading just below 1000 SAT.XLM/USD: Stellar Facing Channel’s Resistance Key Resistance Levels: $0.1, $0.135Key Support Levels: $0.0864, $0.077XLM/USD. Source: TradingViewStellar saw impressive growth over the past four days, with almost 33% gains since the beginning of the month. Meanwhile, it started to show positive signs after exhausting June’s bearishness at around $0.057, which is now holding as monthly support.Following the massive weekly recovery, the price hit $0.099, with about a 20% increase today. But considering the test at the upper boundary of the channel, it may pullback briefly to June’s high of $0.0864 level before resuming the uptrend.The bull’s target still lies at the $0.1
Read More »Cardano Price Analysis: ADA Breaks Above 2019’s High Following 25% Daily Surge
July 8, 2020ADA is now trading above 2019’s high following a 58% growth in 7 days.The price is now approaching the 1500 SAT level with strong bullish momentum.ADA/USD: Cardano Surges 28% After Crossing $0.1 Key Resistance Levels: $0.16, $0.2Key Support Levels: $0.11, $0.094ADA/USD. Source: TradingViewThe second half of the year is again looking promising for Cardano as it starts a new increase above the $0.094 level. In fact, the price is now trading above 2019’s high following a 58% growth in 7 days.Looking at this increase from mid-June’s correction level – $0.0623, where the recovery started from, Cardano has gained over 100% in the last 21 days.There’s no doubt that the 7th best-performing cryptocurrency by market cap has again turned bullish for a mid-term rally, but it may provide a small
Read More »Dogecoin Price Analysis: DOGE Surges 20% in a Day, Trading at Its Highest Point Since Mid February
July 7, 2020The price broke a crucial resistance line after seeing a month-long downward correction to around $0.002274.After gaining 20% in less than 24-hours, DOGE is currently trading at $0.027.DOGE/USD: Pulling Back After Insane RallyKey Resistance Levels: $0.0029, $0.0030, $0.0035Key Support Levels: $0.00269, $0.00259, $0.0025DOGE/USD. Source: TradingViewThe latest surge in the price of Doge Coin has drawn a lot of attention to a potential bull run with almost 20% increases over the past 24 hours. The massive gain was characterized by six bullish candles after rising above the $0.0023 level.However, the buyers reached an exhaustion point at $0.0029 level and briefly lost control to sellers at $0.0027 at the time of writing. DOGE is expected to resume its uptrend as soon as buyers regroup.But
Read More »TRON Price Analysis: TRX Looking For More Gains After Surging 8% Today
July 6, 2020The price jumped to $0.0178, following a 6% growth over the last 24-hours.Against Bitcoin, TRX broke out and slowly gained momentum after staying bearish for five months.TRX/USD: Tron Charges Back At March’s Resistance Key Resistance Levels: $0.0186, $0.0215, $0.023Key Support Levels: $0.0168, $0.0149, $0.014TRX/USD. Source: TradingViewAfter establishing a three-weeks low around $0.015, Tron bounced back and started to show signs of strength again. The increase became noticeable as it breached a very important resistance levelThis recovery was later followed by a push above $0.0168 and $0.0173 resistance levels to where it is now priced at $0.0178 against the US Dollar. The price is now approaching another crucial area at $0.0186 – the March resistance – which could send TRX quickly to
Read More »Binance Coin Price Analysis: BNB Follows Bitcoin’s Downturn Despite 7-Days Recovery, Charts 3% Daily Loss
July 3, 2020Binance Coin lost 3% over the past hours following a quick drop in Bitcoin’s price.The price continues to face rejection at a crucial resistance line after seven days of recovery.After the breakout, BNB consolidated and dropped back inside a demand zone of 0.0165 BTCBNB/USD: BNB Rejects At Resistance LineKey Resistance Levels: $16, $16.7, $18Key Support Levels: $15, $14.7, $13.6BNB/USD. Source: TradingViewBinance Coin decreased by 2.80% overnight following yesterday’s drop in Bitcoin’s price, although the pressure is a bit calm at the time of writing. It is now changing hands around $15.34 after the rejection around the yellow resistance ($16) line forming since June.Looking at the market structure, BNB is technically bearish on the current 4-hours chart, but it is still trading within a
Read More »Cardano Price Analysis: ADA Surges 13% And Finally Conquers 1000 SAT
July 1, 2020Cardano starts the monthly opening on a bullish foot with a total of 13% gains over the past hours.The price is increasing following a huge daily buying volume.Against Bitcoin, ADA surged above last month’s high after seeing 11.11% gains today.ADA/USD: Cardano Signals Fresh Increase Key Resistance Levels: $0.095, $0.97, $0.1Key Support Levels: $0.082, $0.075, $0.064ADA/USD. Source: TradingViewThe price of Cardano is up by 12.50% over the past hours due to the weekly recovery in the entire crypto space. It started to regain strength since it wicked at $0.064 in mid-July – where the green arrows started to form.Followed by a steady push (the second green arrow) from around $0.075 – a crucial demand area – the price is now breaking out from a triangle pattern, which suppressed buying pressure
Read More »Chainlink Price Analysis: $5 Seems Less Likely As LINK’s Volume Fades
June 30, 2020The price slowly recovers after finding small support around $4.27.The daily decrease in volume shows that bears may be around the corner.LINK/USD: Trading Volume Is Fading AwayKey Resistance Levels: $4.9, $5, $5.5Key Support Levels: $4.27, $3.9, $3.5LINK/USD. Source: TradingViewChainlink’s performance has been quite impressive during the second quarter of 2020. The bulls are still trying to remain in control of the market.Looking at the volume on the daily chart – which reveals a consistent decrease in liquidity flow for the past months – buyers appeared weak, and they may lose control soon. However, the trend still looks bullish as the price remains trapped in an ascending channel.A strong bearish momentum could be considered if the price drops off this channel. At the moment, Link
Read More »Synthetix Network Token Price Analysis: DeFi Craze Slows Down As SNX Looks to Consolidate Around $1.8
June 29, 2020After witnessing a five-days correction, SNX recovered almost 6% over the last 48-hours trading.Sellers may resume pressure if the price fails to increase above the previous resistance.The trend is still looking bullish in the short-term despite the five-day selling.SNX/USD: It Maintains Lower High Lower High PatternKey Resistance Levels: $1.83, $1.92, $1.964Key Support Levels: $1.61, $1.56, $1.44SNX/USD. Source: TradingVIewSynthetix Network Token has been under a correction since the price touched $1.964 last week. Following a lower low and lower high pattern, it is now trading around $1.8 level, where sellers are likely to step back into the market.As can be seen on the 4-hours chart, it is looking for support at the white ascending trend line that was forming since June 3rd. The
Read More »Loopring Price Analysis: LRC Poised For More Gains Following 10% Daily Surge, DeFi Craze Continues
June 26, 2020After a two-week correction, LRC recently found a bottom and bounced back with 10% gains under 24 hours.It may start a new bullish cycle if the weekly low continues to hold as support.LRC/USD: Loopring Forming Bull Flag PatternKey Resistance Levels: $0.089, $0.95Key Support Levels: $0.72, $0.62LRC/USD. Source: TradingViewEarlier this year, Loopring started to gain momentum after dropping to around $0.02 in March. After witnessing a three-month surge to $0.1168 on June 10, the price corrected to $0.72 yesterday, but it is slowly bouncing back at the moment.It is technically following a bullish flag pattern on the daily chart. A continuation should be expected once the price breaks up this triangle.The reverse will be the case for Loopring if the price drops below the current daily low of
Read More »Crypto.com Price Analysis: CRO Pulls Back 3% On The Day, Looking for Consolidation
June 25, 2020The coin pulls back below $0.12 after increasing by 8% in a week.After a slight breakdown, sellers are now eyeing the 12000 SAT level.CRO remains bullish on the mid-term despite 4% drops overnight.CRO/USD: Price Consolidating After DropKey Resistance Levels: $0.1193, $0.126Key Support Levels: $0.113, $0.105CRO/USD. Source: TradingViewAfter breaking last week’s high at $0.1193, Crypto.com recorded a new high around $0.126 on Tuesday before the price dropped to where it’s currently changing hands near $0.113 support area – which may hold for a while before it breaks down or rebound.The price is currently down by 2%. Despite that, the bullish trend remains valid on a mid-term but it is important to note that the market appeared overbought on the daily chart.However, CRO is currently
Read More »Bancor Price Analysis: BNT Surges 15% in 24 Hours Despite Bitcoin’s Latest Drop
June 24, 2020Bancor regained momentum after rising above a two-week resistance with 42% gains in a week.It may pull back to the previous breakout level if buying volume starts to decrease.An increase above the current daily high may trigger more positive actions on a short-term perspective.BNT/USD: Bancor Trades Nicely Above $1Key Resistance Levels: $1.33, $1.5, $1.7Key Support Levels: $1.118, $1, $0.92BNT/USD. Source: TradingViewEarlier this year, Bancor traded as low as $0.17 due to insufficient trading volume in the market. But as of now, it’s already above $1 after rising by over tremendously over the past three months.Yesterday, the price broke above the $0.92 resistance-turned-support that suppressed bullish actions for over two weeks. The last 4-hour candle – evening star – suggests a small
Read More »DigiByte Price Analysis: DGB Skyrockets 35% After Being Listed on Binance, What’s Next?
June 23, 2020DigiByte increased by 35% following its listing on Binance.
The price is still trapped in a triangle pattern despite the latest surge.
The bullish sentiment remains valid across trading pairs.
DGB/USD: Digibyte Remains Trapped In a Triangle
Key Resistance Levels: $0.0244, $0.0267, $0.030
Key Support Levels: 0.0205, $0.016, $0.013
DGB/USD. Source: TradingVIewFollowing yesterday’s listing on the leading cryptocurrency exchange, Binance, the price of DigiByte increased by almost 35% to reach $0.0244, but it dropped a bit to where it’s currently trading around $0.0222. Still, the price is up by 23.4%.
Apart from the fundamental aspect of this surge, DGB is technically forming a triangle pattern on the daily chart to indicate a continuation of the past months’ bullish actions.
It’s also
Matic Price Analysis: MATIC Plotting a Recovery Despite Slight 4% Daily Loss
June 22, 2020Matic is trying to bounce back, but the buying volume is currently low.It is now holding a previous break level as support after losing almost 4% of its value overnight.The price is targeting $0.027 level in the next few days if Bitcoin continues to consolidate.MATIC/USD: Buyers Showing Interest After 3.12% DiscountKey Resistance Levels: $0.023, $0.025, $0.027Key Support Levels: $0.021, $0.020, $0.019MATIC/USD. Source: TradingVIewMatic is currently down by 3.12% overnight, but it is starting to show a bullish sign following the June 20 breakout above a three-week resistance line to reach $0.023. After pulling back to near $0.021, the price bounced back to where it’s trading around $0.0219 at the time of writing.On the current 4-hours chart, it appeared that buyers are stepping back into
Read More »VeChain Price Analysis: Bull Run Paused as VET Continues to Stagnate Around $0.0085
June 19, 2020After a slight weekly rebound, VET resumed selling pressure with 4% losses over the last 24-hours.A slip beneath the monthly low could cause more troubles for the 28th ranked crypto by market cap.The market is currently looking bearish on the hourly time frame.VET/USD: VeChain Trades At Crucial Support LineKey Resistance Levels: $0.0095, $0.0107, $0.011Key Support Levels: $0.0076, $0.0066, $0.0060VET/USD. Source: TradingVIewVeChain has lost a major chunk of its value over the last seven days after witnessing a short-term recovery to $0.0106. Despite the correction, the trend remains bullish on a higher time frame, but it is currently looking bearish on the lower time frame.Following the weekly bounce from $0.0076, VeChain’s price got rejected at $0.0095 and continued to drop to where it’s
Read More »