The price broke a crucial resistance line after seeing a month-long downward correction to around %excerpt%.002274.After gaining 20% in less than 24-hours, DOGE is currently trading at %excerpt%.027.DOGE/USD: Pulling Back After Insane RallyKey Resistance Levels: %excerpt%.0029, %excerpt%.0030, %excerpt%.0035Key Support Levels: %excerpt%.00269, %excerpt%.00259, %excerpt%.0025DOGE/USD. Source: TradingViewThe latest surge in the price of Doge Coin has drawn a lot of attention to a potential bull run with almost 20% increases over the past 24 hours. The massive gain was characterized by six bullish candles after rising above the %excerpt%.0023 level.However, the buyers reached an exhaustion point at %excerpt%.0029 level and briefly lost control to sellers at %excerpt%.0027 at the time of writing. DOGE is expected to resume its uptrend as soon as buyers regroup.But
Topics:
Michael Fasogbon considers the following as important: DOGEBTC, dogecoin, DOGEUSD, Price Analysis
This could be interesting, too:
Jordan Lyanchev writes Cardano (ADA) Surpasses Dogecoin After 55% Surge
Jordan Lyanchev writes Good News for Dogecoin (DOGE) Investors: Is %related_posts%.5 Still in Play?
Bitcoin Schweiz News writes Früh in Meme Coins einsteigen?
- The price broke a crucial resistance line after seeing a month-long downward correction to around $0.002274.
- After gaining 20% in less than 24-hours, DOGE is currently trading at $0.027.
DOGE/USD: Pulling Back After Insane Rally
Key Resistance Levels: $0.0029, $0.0030, $0.0035
Key Support Levels: $0.00269, $0.00259, $0.0025
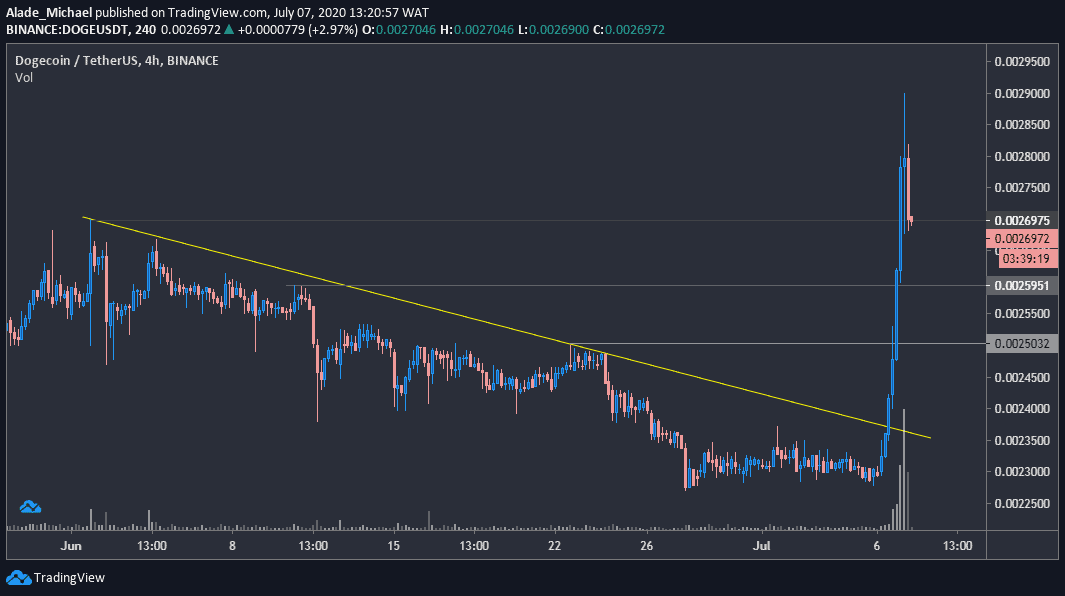
The latest surge in the price of Doge Coin has drawn a lot of attention to a potential bull run with almost 20% increases over the past 24 hours. The massive gain was characterized by six bullish candles after rising above the $0.0023 level.
However, the buyers reached an exhaustion point at $0.0029 level and briefly lost control to sellers at $0.0027 at the time of writing. DOGE is expected to resume its uptrend as soon as buyers regroup.
But looking at the bigger picture from a technical perspective, a nice retracement is needed for the strong and healthy growth of the 33rd largest cryptocurrency by market cap. Nonetheless, it is currently looking bullish on the 4-hours chart.
DOGE Price Analysis
Following the current bullish exhaustion at $0.0029, it is evident that the price is slowly falling on the intraday, which could be categorized as a healthy retracement.
The price is trading near $0.00269 support, the June high that got broken yesterday. The next retracement level to watch is $0.0259 and $0.0025. It is essential to keep an eye on the $0.002377 (the break level) if all these mentioned levels fail to produce a rebound.
For the next upswing, the buyers would need to reclaim the daily high of $0.0029 before breaking to around $0.003 and perhaps $0.0035 in the next couple of days.
DOGE/BTC: Doge Currently Facing 9-Month Resistance
Key Resistance Levels: 30 SAT, 33 SAT, 37 SAT
Key Support Levels: 27 SAT, 25 SAT, 23 SAT
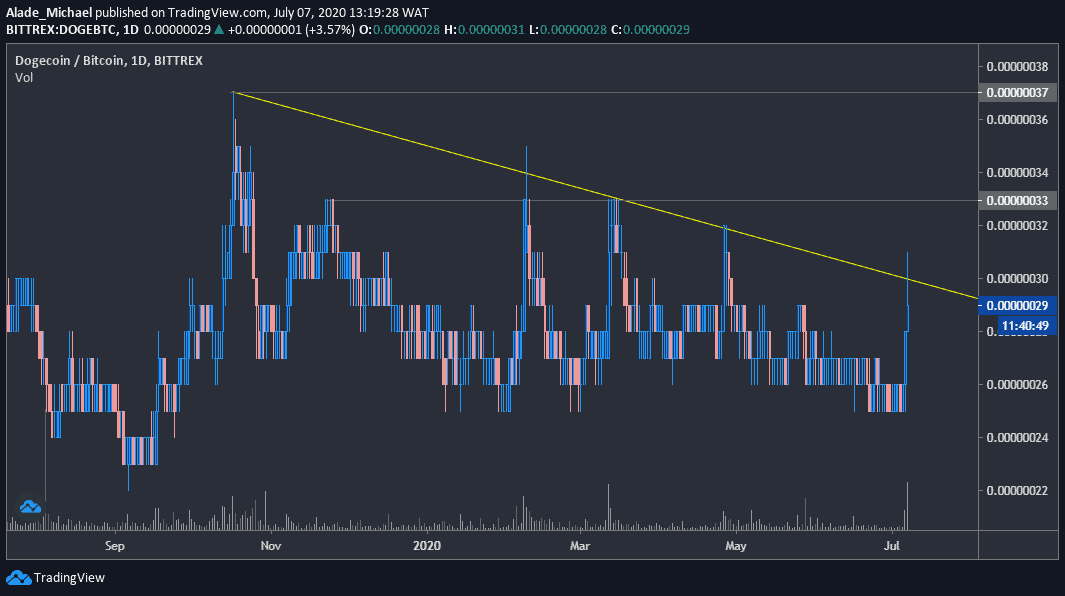
Against Bitcoin, DOGE is currently up by 17% today, but the price continued to face an important resistance line forming since October 2019. It is now changing hands around 30 SAT following a drop from the 31 SAT level.
The buyers are trying to break away from the 9-month downward correction, but the yellow resistance line is acting strong. Meanwhile, it has established base support at the 25 SAT level.
DOGE Price Analysis
A daily close above this crucial resistance line at 30 SAT could initiate a new increase towards the 33 SAT and 37 SAT resistance levels. A push above these levels could trigger an intense buy action for the coin.
On the other hand, it may remain in a perpetual bearish condition if the price continues to respect the 9-month resistance line, marked yellow on the chart. In this case, support to watch out for is 25 SAT and 23 SAT, which is holding for the past two years.
But if it can find a rebound around the 27 SAT level, the bulls are most likely to take control over the long-term trend.