Bancor regained momentum after rising above a two-week resistance with 42% gains in a week.It may pull back to the previous breakout level if buying volume starts to decrease.An increase above the current daily high may trigger more positive actions on a short-term perspective.BNT/USD: Bancor Trades Nicely Above Key Resistance Levels: .33, .5, .7Key Support Levels: .118, , %excerpt%.92BNT/USD. Source: TradingViewEarlier this year, Bancor traded as low as %excerpt%.17 due to insufficient trading volume in the market. But as of now, it’s already above after rising by over tremendously over the past three months.Yesterday, the price broke above the %excerpt%.92 resistance-turned-support that suppressed bullish actions for over two weeks. The last 4-hour candle – evening star – suggests a small
Topics:
Michael Fasogbon considers the following as important: Bancor Network, Price Analysis
This could be interesting, too:
CryptoVizArt writes ETH’s Path to K Involves Maintaining This Critical Support (Ethereum Price Analysis)
Duo Nine writes Crypto Price Analysis June-29: ETH, XRP, ADA, DOGE, and DOT
Duo Nine writes Crypto Price Analysis June-15: ETH, XRP, ADA, DOGE, and DOT
Duo Nine writes Why is the Shiba Inu (SHIB) Price Down Today?
- Bancor regained momentum after rising above a two-week resistance with 42% gains in a week.
- It may pull back to the previous breakout level if buying volume starts to decrease.
- An increase above the current daily high may trigger more positive actions on a short-term perspective.
BNT/USD: Bancor Trades Nicely Above $1
Key Resistance Levels: $1.33, $1.5, $1.7
Key Support Levels: $1.118, $1, $0.92

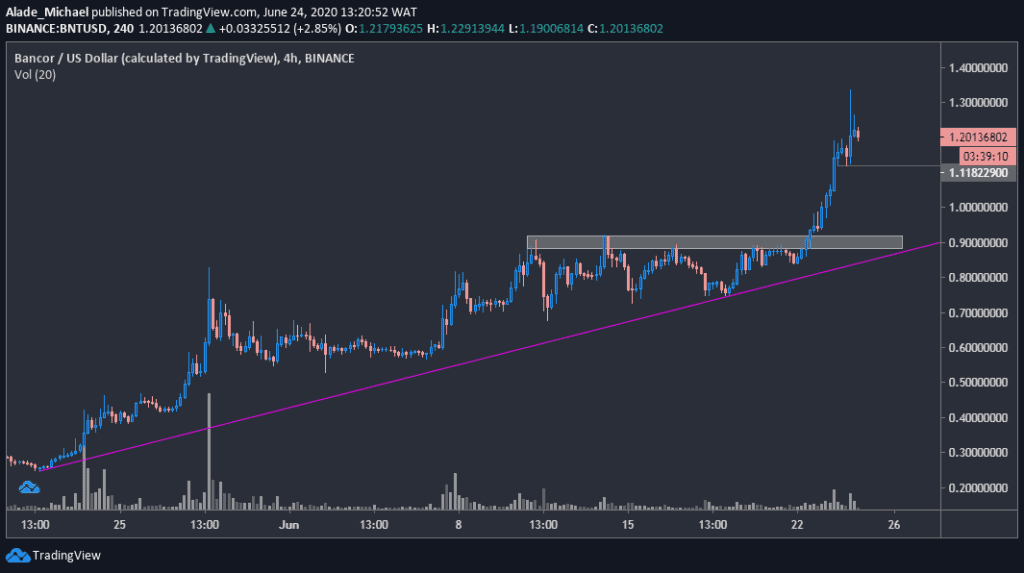
Earlier this year, Bancor traded as low as $0.17 due to insufficient trading volume in the market. But as of now, it’s already above $1 after rising by over tremendously over the past three months.
Yesterday, the price broke above the $0.92 resistance-turned-support that suppressed bullish actions for over two weeks. The last 4-hour candle – evening star – suggests a small weakness in buying as a pullback may come into play soon.
But looking at the current market structure, BNT is technically bullish on a short-term perspective. However, this may soon end with a major correction if one considers the second-quarter rally that printed a high at $1.33 a few hours ago. The price may keep rising if buyers continue to push stronger.
BNT Price Analysis
To keep the bullish momentum intact, the buyers would need to push the price above the current daily high of $1.33. After that, $1.5 is likely to come into play, followed by $1.7 level on the upside.
If the price drops below the last 24 hours’ low of $1.118, Bancor is likely to retest the previous break area (as pullback) of $0.92 – marked grey – before it bounces back. However, it may encounter a key psychological level at $1 if it can act as a rebound.
The only thing that could trigger bearish sentiment is if the price drops off the ascending trend line that supported bullish actions for over four weeks now.
BNT/BTC: Bancor Increased By 20.53%
Key Resistance Levels: 13848 SAT, 15000 SAT
Key Support Levels: 11640 SAT, 9750 SAT

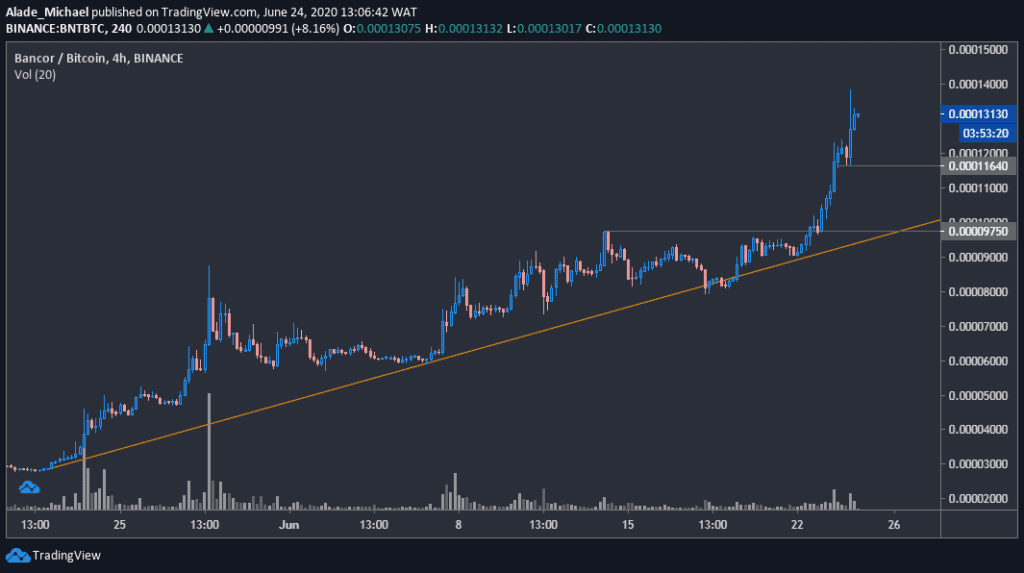
Against Bitcoin, Bancor trades at around 13150 SAT after witnessing an impressive 20.53% growth overnight. Meanwhile, this positive move was led by a three-day 35% surge, which made the 77th largest cryptocurrency by market cap to resume bullish movements above the crucial resistance level at 10000 SAT.
This 10000 SAT level is now acting as weekly support for BNT. Apart from that, it has further established small support at 11640 SAT – today’s low. If this support continues to hold, more positive actions are expected to play out.
But if this level fails, BNT may look for a rebound on the orange ascending line forming since late May. A reversal is likely if the price falls beneath the orange line. As of now, BNT is priced at around 13130 SAT.
BNT Price Analysis
As mentioned above, the orange trend is likely to produce a rebound if the price drops below the current holding level of 11640 SAT. The closest support to watch beneath this trend line is 9750 SAT (the weekly breakout level) in case of a breakdown. 9000 SAT and 8160 SAT would be next if the price dips further.
On the upside, buyers would need to clear the daily high of 13848 SAT level before advancing higher to 15000 SAT in the next few days.
