ADA is now trading above 2019’s high following a 58% growth in 7 days.The price is now approaching the 1500 SAT level with strong bullish momentum.ADA/USD: Cardano Surges 28% After Crossing %excerpt%.1 Key Resistance Levels: %excerpt%.16, %excerpt%.2Key Support Levels: %excerpt%.11, %excerpt%.094ADA/USD. Source: TradingViewThe second half of the year is again looking promising for Cardano as it starts a new increase above the %excerpt%.094 level. In fact, the price is now trading above 2019’s high following a 58% growth in 7 days.Looking at this increase from mid-June’s correction level – %excerpt%.0623, where the recovery started from, Cardano has gained over 100% in the last 21 days.There’s no doubt that the 7th best-performing cryptocurrency by market cap has again turned bullish for a mid-term rally, but it may provide a small
Topics:
Michael Fasogbon considers the following as important: ADABTC, ADAUSD, Cardano (ADA) Price, Price Analysis
This could be interesting, too:
Jordan Lyanchev writes Cardano (ADA) Surpasses Dogecoin After 55% Surge
Jordan Lyanchev writes Trump Confirms Work on Strategic Crypto Reserve: XRP, ADA, SOL Included
Dimitar Dzhondzhorov writes Millions of ADA Sold by Cardano Whales During Market Crash – Will the Decline Continue?
Jordan Lyanchev writes Here’s How Cardano’s 17% Weekly Correction Can Help ADA Hit This Cycle: Analyst
- ADA is now trading above 2019’s high following a 58% growth in 7 days.
- The price is now approaching the 1500 SAT level with strong bullish momentum.
ADA/USD: Cardano Surges 28% After Crossing $0.1
Key Resistance Levels: $0.16, $0.2
Key Support Levels: $0.11, $0.094

The second half of the year is again looking promising for Cardano as it starts a new increase above the $0.094 level. In fact, the price is now trading above 2019’s high following a 58% growth in 7 days.
Looking at this increase from mid-June’s correction level – $0.0623, where the recovery started from, Cardano has gained over 100% in the last 21 days.
There’s no doubt that the 7th best-performing cryptocurrency by market cap has again turned bullish for a mid-term rally, but it may provide a small discount to somewhere around $0.11 level if a retracement occurs. Still, the price is up by 24% against the US Dollar.
Cardano Price Analysis
Following the ongoing second wave in the market, Cardano’s price could target the July 2018 resistance of $0.2. Along the way, it may encounter resistance at $0.16.
There’s no much room for the bears at the moment. If the price drops below the mentioned key retracement level, the next major rebound level to watch is the $0.094 level that got breached on July 1st. But as of now, the bulls are in control.
ADA/BTC: Cardano Eyeing 2019 High
Key Resistance Levels: 1500 SAT, 1700SAT, 1944 SAT
Key Support Levels: 1243 SAT, 1045 SAT, 900 SAT
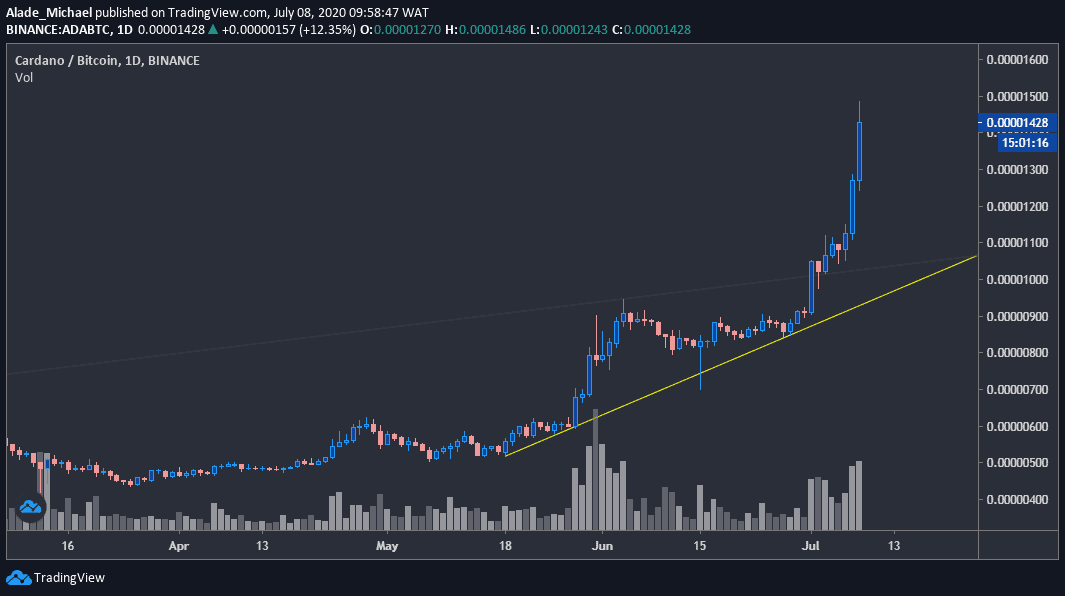
And while Bitcoin remains calm around $9300 since yesterday, the price of Cardano has increased by almost 25% over the past 24-hours trading. The price is now approaching the 1500 SAT level with strong bullish momentum.
As spotted on the daily chart, the latest surge was characterized by a full-body candle to indicate that buyers are stepping stronger into the market with a huge volume. One thing to keep in mind here is that such a move is commonly followed by a sharp decline.
However, the future still looks very bright and promising for Cardano as long as the buyers continue to sustain pressure. Otherwise, the price may drop a bit to find reliable support to refuel bullish actions. It is currently eyeing the 1500 SAT level against Bitcoin.
ADA Price Analysis
If Cardano can close well above 1500 SAT today, the next buying pressure is most likely to target 1700 SAT before rising further to the 2019 high of 1944 SAT.
In case of a drop, the current daily low of 1243 SAT can be considered as a level for a pullback. The second level to keep in mind is the weekly support at 1045 SAT – where the grey and orange trend lines confluence. The monthly opening price at 900 SAT remains the key holding support for the weekly top-gainer.