Cardano found support slightly above %excerpt%.12 after losing 8% in two days.Despite the bearishness, it remained bullish on a short-term perspective.ADA/USD: Cardano Trapped Inside A Triangle Key Resistance Levels: %excerpt%.133, %excerpt%.14, %excerpt%.16Key Support Levels: %excerpt%.121, %excerpt%.11, %excerpt%.1ADA/USD. Source: TradingViewCardano’s price has dropped by almost 6% following the last 24-hours decrease in the entire crypto market. Despite the bearishness, it is still looking bullish on a short-term perspective as the price remains trapped inside a triangle pattern, as spotted in the above chart.The bullish action is likely to continue if the buyers can push the price back, especially above the triangle. But if the bears step up again, the price could break below the triangle to find solid support for a rebound.The key
Topics:
Michael Fasogbon considers the following as important: ADABTC, ADAUSD, Cardano (ADA) Price, Price Analysis
This could be interesting, too:
Jordan Lyanchev writes Cardano (ADA) Surpasses Dogecoin After 55% Surge
Jordan Lyanchev writes Trump Confirms Work on Strategic Crypto Reserve: XRP, ADA, SOL Included
Dimitar Dzhondzhorov writes Millions of ADA Sold by Cardano Whales During Market Crash – Will the Decline Continue?
Jordan Lyanchev writes Here’s How Cardano’s 17% Weekly Correction Can Help ADA Hit This Cycle: Analyst
- Cardano found support slightly above $0.12 after losing 8% in two days.
- Despite the bearishness, it remained bullish on a short-term perspective.
ADA/USD: Cardano Trapped Inside A Triangle
Key Resistance Levels: $0.133, $0.14, $0.16
Key Support Levels: $0.121, $0.11, $0.1
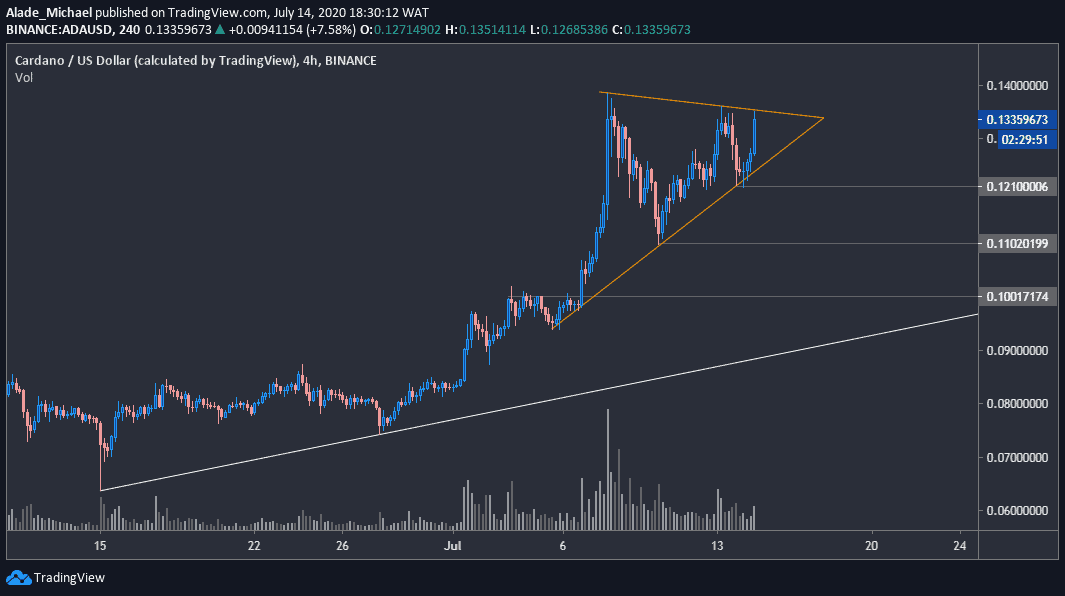
Cardano’s price has dropped by almost 6% following the last 24-hours decrease in the entire crypto market. Despite the bearishness, it is still looking bullish on a short-term perspective as the price remains trapped inside a triangle pattern, as spotted in the above chart.
The bullish action is likely to continue if the buyers can push the price back, especially above the triangle. But if the bears step up again, the price could break below the triangle to find solid support for a rebound.
The key level for such a rebound is likely on the white trend line forming since mid-June. As of now, Cardano is consolidating around $0.126 – deciding on the next major price direction.
Cardano Price Analysis
Looking at today’s reaction at $0.121 level, which is currently supporting the market over the past 12-hours, the price might increase slightly to somewhere around the triangle’s resistance at $0.133. A break above this triangle could trigger a fresh increase to $0.14 and $0.16.
But if the current $0.121 level fails to hold, the price may correct to straight to the $0.1 support – around the white ascending line – before it can regain momentum. The support to watch along the ways is $0.11.
ADA/BTC: Cardano Holding Above 1300 SAT
Key Resistance Levels: 1466 SAT, 1600 SAT, 1958 SAT
Key Support Levels: 1313 SAT, 1202 SAT, 1113 SAT
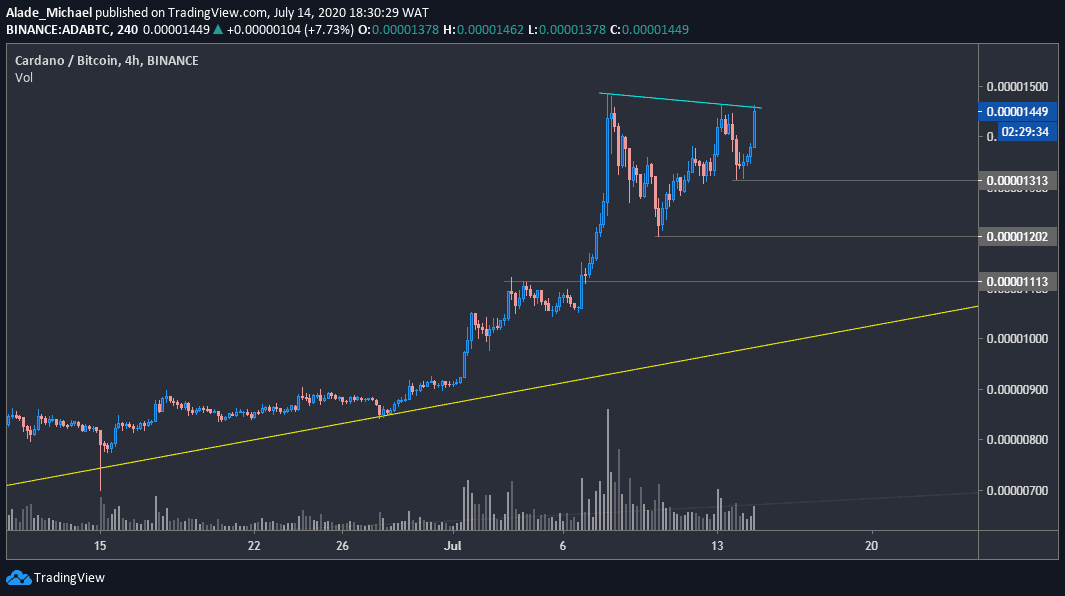
Against Bitcoin, Cardano is currently looking indecisive after losing almost 5% over the past hours trading. Although the price has managed to hold briefly above the 1313 SAT level since yesterday. A recovery is likely if this level holds.
Looking at the previous rejections at 1485 SAT and1466 SAT levels, where the red resistance line is now forming, the price might fall soon. Although, the trend remains bullish on the current 4-hours chart.
If the price continues to respect this red resistance line, Cardano may suspend bullish actions for a while before it can regain momentum. However, a correction below the yellow trend line may set a strong bearish tone for the cryptocurrency on a short-term perspective.
Cardano Price Analysis
If Cardano keeps holding the 1313 SAT level as daily support, it may push back to the previous high of 1466 SAT, followed by last week’s high of 1485 SAT. A new resistance above these levels may come around 1600 SAT and perhaps the 1958 SAT level.
A drop below the current daily support could lead to a serious selloff on the current 4-hours chart. If such a scenario occurs, the closest support to watch out for is the 1202 SAT level – last week’s low – before dropping further to 1113 SAT, where the yellow trend line lies.
As of now, the bulls are still gaining control of the market.