ETH-USD: Ethereum Trapped In A TriangleKey Resistance Levels: 0, 625, 0Key Support Levels: 0, 4, 0ETH/USD. Source: TradingViewEthereum marked a daily 7% drop to 0 (today’s low) following the latest decline in Bitcoin’s price. However, just last Bitcoin, the second-largest cryptocurrency, had also seen a brief rebound of roughly 5%. Despite the recent plunge, the longer-term trend is still bullish.In the mid-term, as can be seen in the above 4-hours chart, Ethereum is currently trapped in a triangle pattern as it primes for a huge movement on a breakout.ETH-USD: Support and Resistance LevelsConsidering a triangle breakdown, especially below the daily support at 0, the price could collapse to around 0 before dropping further to 0 if the first doesn’t hold.However,
Topics:
Michael Fasogbon considers the following as important: ETH Analysis, ETHBTC, Ethereum (ETH) Price, ethusd
This could be interesting, too:
Mandy Williams writes Ethereum Derivatives Metrics Signal Modest Downside Tail Risk Ahead: Nansen
Jordan Lyanchev writes Weekly Bitcoin, Ethereum ETF Recap: Light at the End of the Tunnel for BTC
CryptoVizArt writes Will Weak Momentum Drive ETH to .5K? (Ethereum Price Analysis)
Jordan Lyanchev writes Bybit Hack Fallout: Arthur Hayes, Samson Mow Push for Ethereum Rollback
ETH-USD: Ethereum Trapped In A Triangle
Key Resistance Levels: $600, 625, $650
Key Support Levels: $530, $494, $450
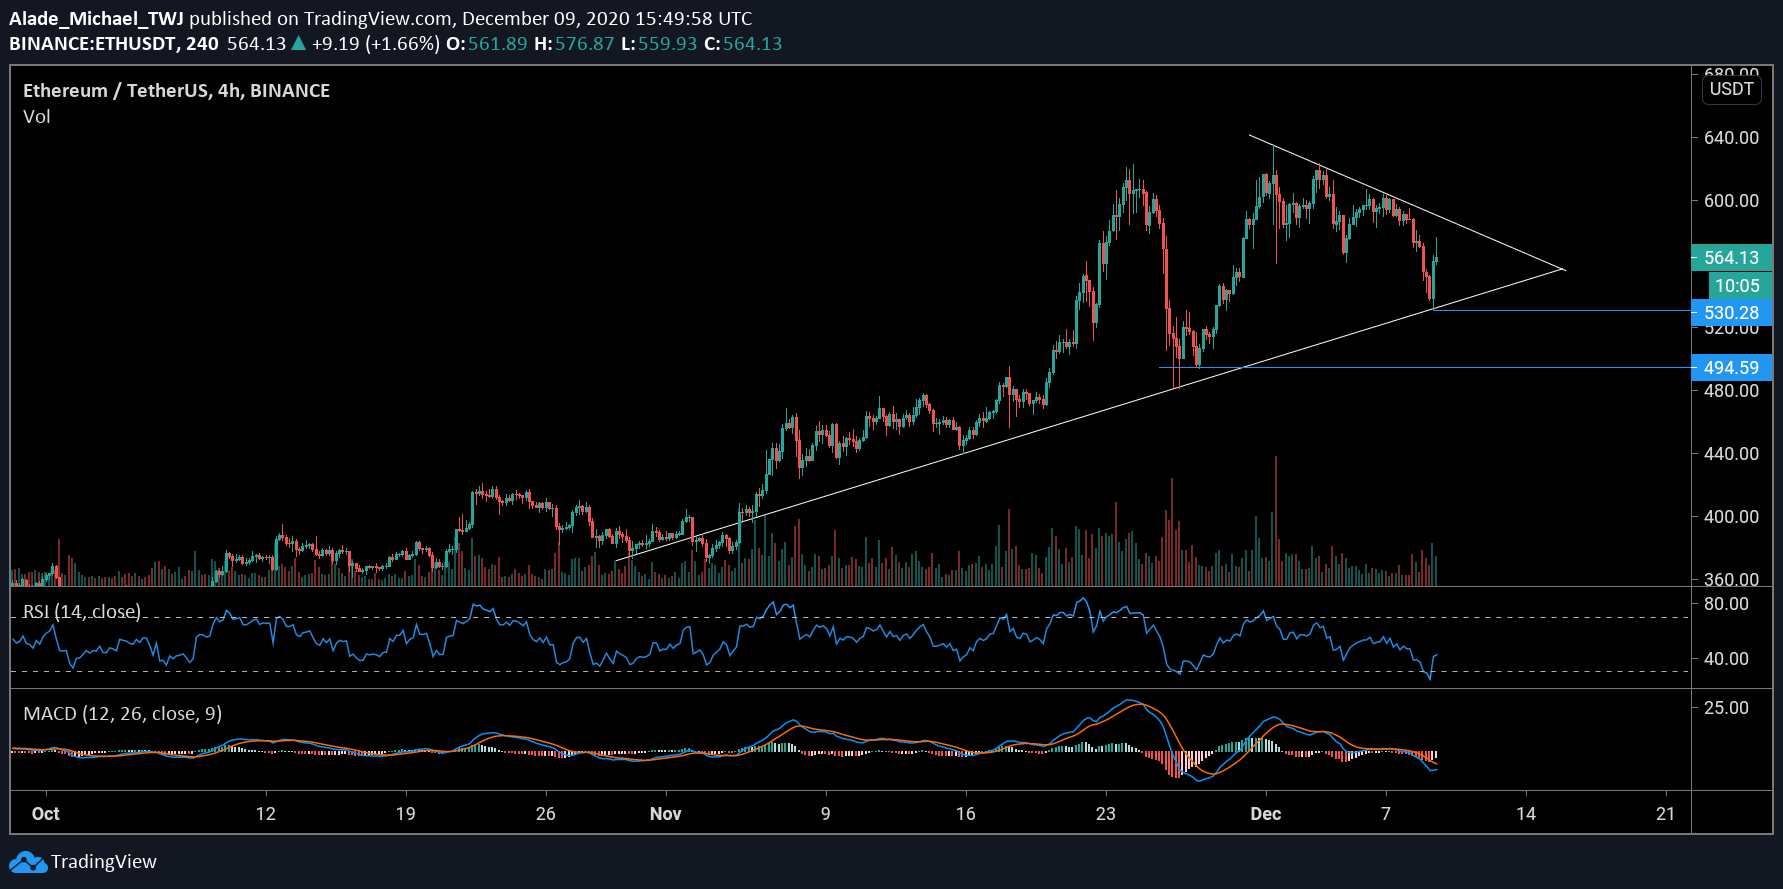
Ethereum marked a daily 7% drop to $530 (today’s low) following the latest decline in Bitcoin’s price. However, just last Bitcoin, the second-largest cryptocurrency, had also seen a brief rebound of roughly 5%. Despite the recent plunge, the longer-term trend is still bullish.
In the mid-term, as can be seen in the above 4-hours chart, Ethereum is currently trapped in a triangle pattern as it primes for a huge movement on a breakout.
ETH-USD: Support and Resistance Levels
Considering a triangle breakdown, especially below the daily support at $530, the price could collapse to around $490 before dropping further to $450 if the first doesn’t hold.
However, looking at the current RSI indicator at 40, the price is slowly gaining strength in favor of the bulls. The 4-hours MACD indicator shows that the market is still weak. To break above this triangle, the buyers would need to reclaim the key resistance level of $600.
ETH-BTC: Ether Slightly Recovers From Crucial Support
Key Resistance Levels: 0.032 BTC, 0.033 BTC, 0.040 BTC
Key Support Levels: 0.030 BTC, 0.029 BTC, 0.0263 BTC
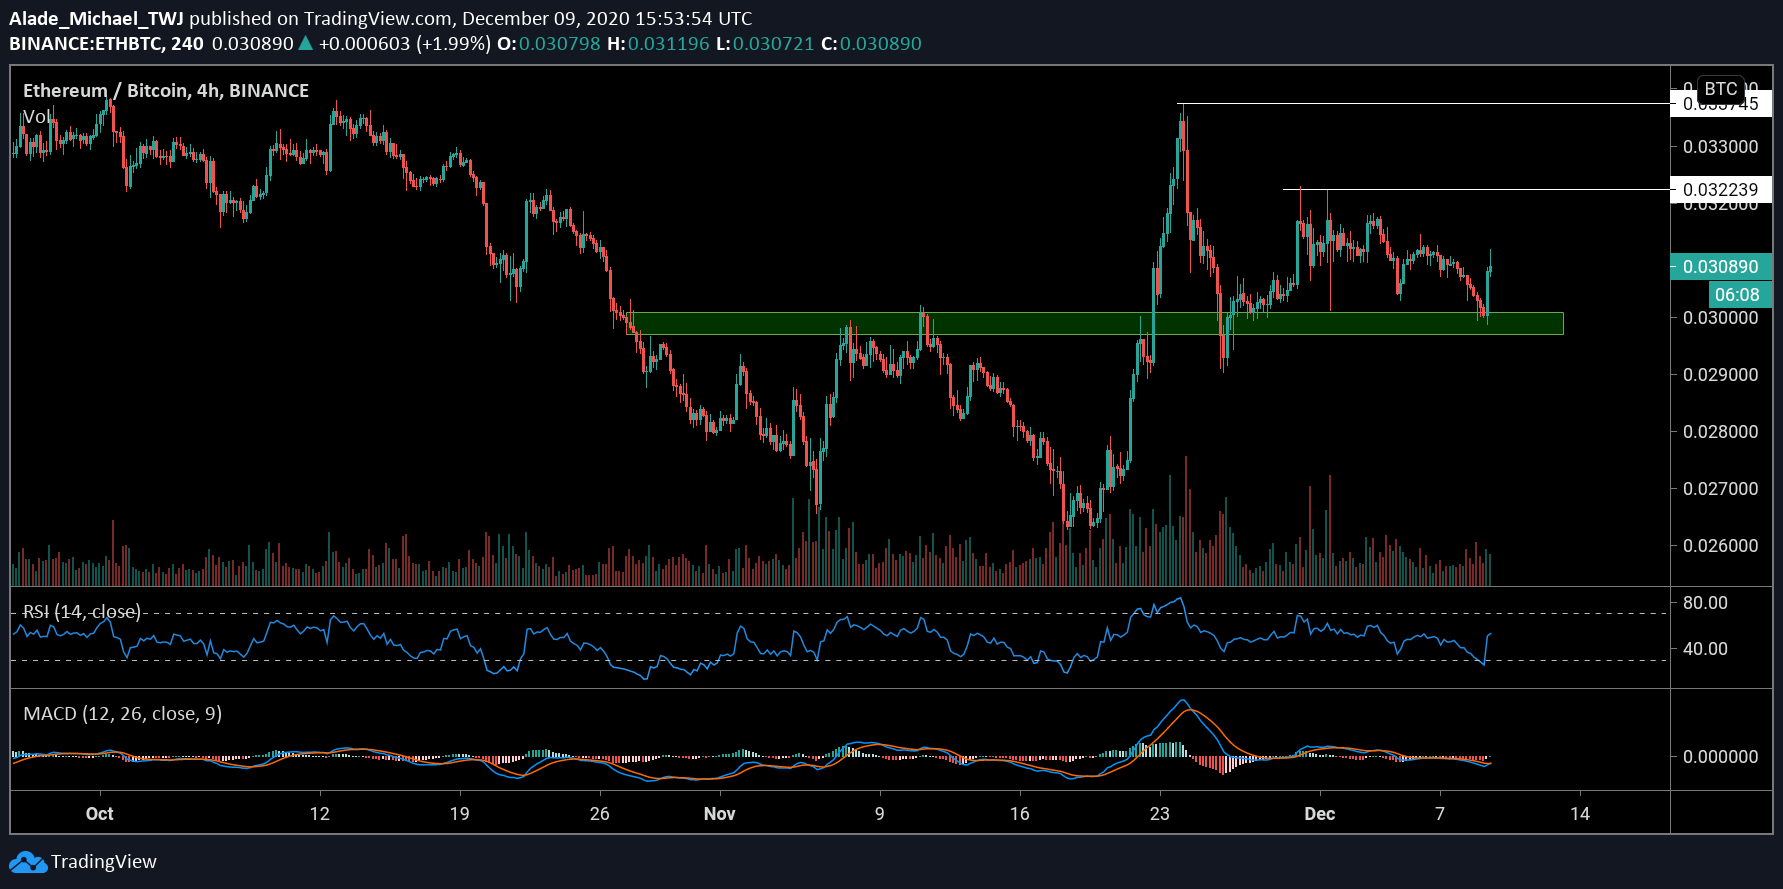
After losing almost 10% of its value in three days, Ethereum found key support around 0.03 BTC as it saw a quick recovery against Bitcoin. Following the latest gains, ETH currently trades at around 0.0305 BTC level.
Just like against its USD value, the price is still looking bearish from a short-term perspective. More bearish actions can be anticipated if the sellers resume pressure in the market. Considering the current buying volumes, it appears bulls might sustain for a while.
ETH-BTC: Support and Resistance Levels
If Bitcoin can remain ‘calm’ for a while, Ethereum could regain its recent losses, getting to the first resistance of 0.032 BTC. This is followed by 0.033 BTC resistance – the November high and 0.04 BTC.
On the other hand, if the price drops beneath the green support area of 0.030 BTC as indicated in the above chart, the next level to watch out for is 0.029 BTC. Support below lies at the 0.0263 BTC level, where the price reversed in November.
While the 4-hours RSI indicator poises for a positive move, the MACD remains negative, suggesting that sellers are still active in the market.