XRP/USD: Ripple Bounces BackKey Resistance Levels: %excerpt%.52, %excerpt%.6, %excerpt%.7Key Support Levels: %excerpt%.458, %excerpt%.4, %excerpt%.33XRP/USD. Source: TradingViewOver the past few hours, XRP saw a quick 10% recovery to where it’s trading around %excerpt%.50 at the time of writing. This follows the most recent BTC rally to a new all-time high above ,000.Looking at the current market structure, the bearish bias still appears strong on the 4-hours chart. Although, a strong recovery may come into play once bulls show further interest. As can be seen on the chart, XRP has found temporary support above %excerpt%.45 inside the green zone.XRP-USD: Resistance and Support LevelsA clear break above the current levels can push the price further to %excerpt%.6 and %excerpt%.7 levels. It may revisit %excerpt%.73 resistance if the price continues to increase.If
Topics:
Michael Fasogbon considers the following as important: Ripple (XRP) Price, XRP Analysis, xrpbtc, xrpusd
This could be interesting, too:
Jordan Lyanchev writes Ripple’s (XRP) Surge to Triggers Over Million in Short Liquidations
Jordan Lyanchev writes Trump Confirms Work on Strategic Crypto Reserve: XRP, ADA, SOL Included
Dimitar Dzhondzhorov writes Is a Major Ripple v. SEC Lawsuit Development Expected This Week? Here’s Why
Mandy Williams writes Ripple Releases Institutional DeFi Roadmap for XRP Ledger in 2025
XRP/USD: Ripple Bounces Back
Key Resistance Levels: $0.52, $0.6, $0.7
Key Support Levels: $0.458, $0.4, $0.33
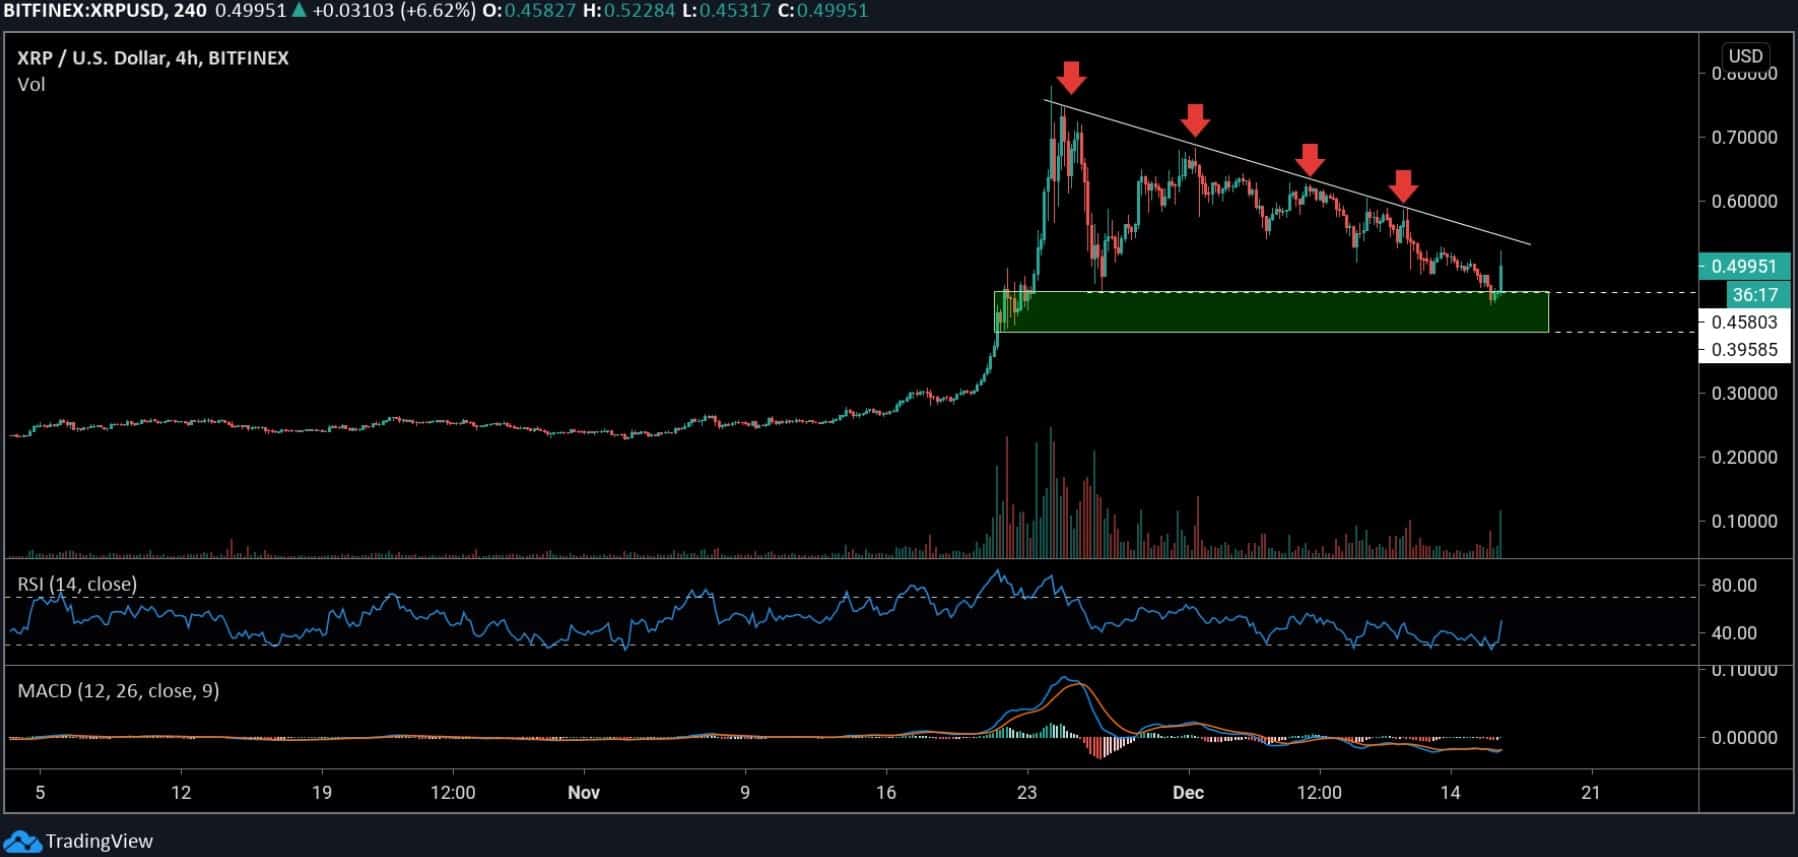
Over the past few hours, XRP saw a quick 10% recovery to where it’s trading around $0.50 at the time of writing. This follows the most recent BTC rally to a new all-time high above $20,000.
Looking at the current market structure, the bearish bias still appears strong on the 4-hours chart. Although, a strong recovery may come into play once bulls show further interest. As can be seen on the chart, XRP has found temporary support above $0.45 inside the green zone.
XRP-USD: Resistance and Support Levels
A clear break above the current levels can push the price further to $0.6 and $0.7 levels. It may revisit $0.73 resistance if the price continues to increase.
If XRP sees another selloff, it may slip to $0.458. A drop below this could send the price further to $0.4 and potentially $0.33, where it broke out in November. The RSI and MACD are currently low, suggesting bears are still present.
XRP/BTC: Ripple’s Correction Reaches Key Recovery Point
Key Resistance Levels: 2818 SAT, 3600 SAT, 4200 SAT
Key Support Levels: 2000 SAT, 1800 SAT, 1500 SAT
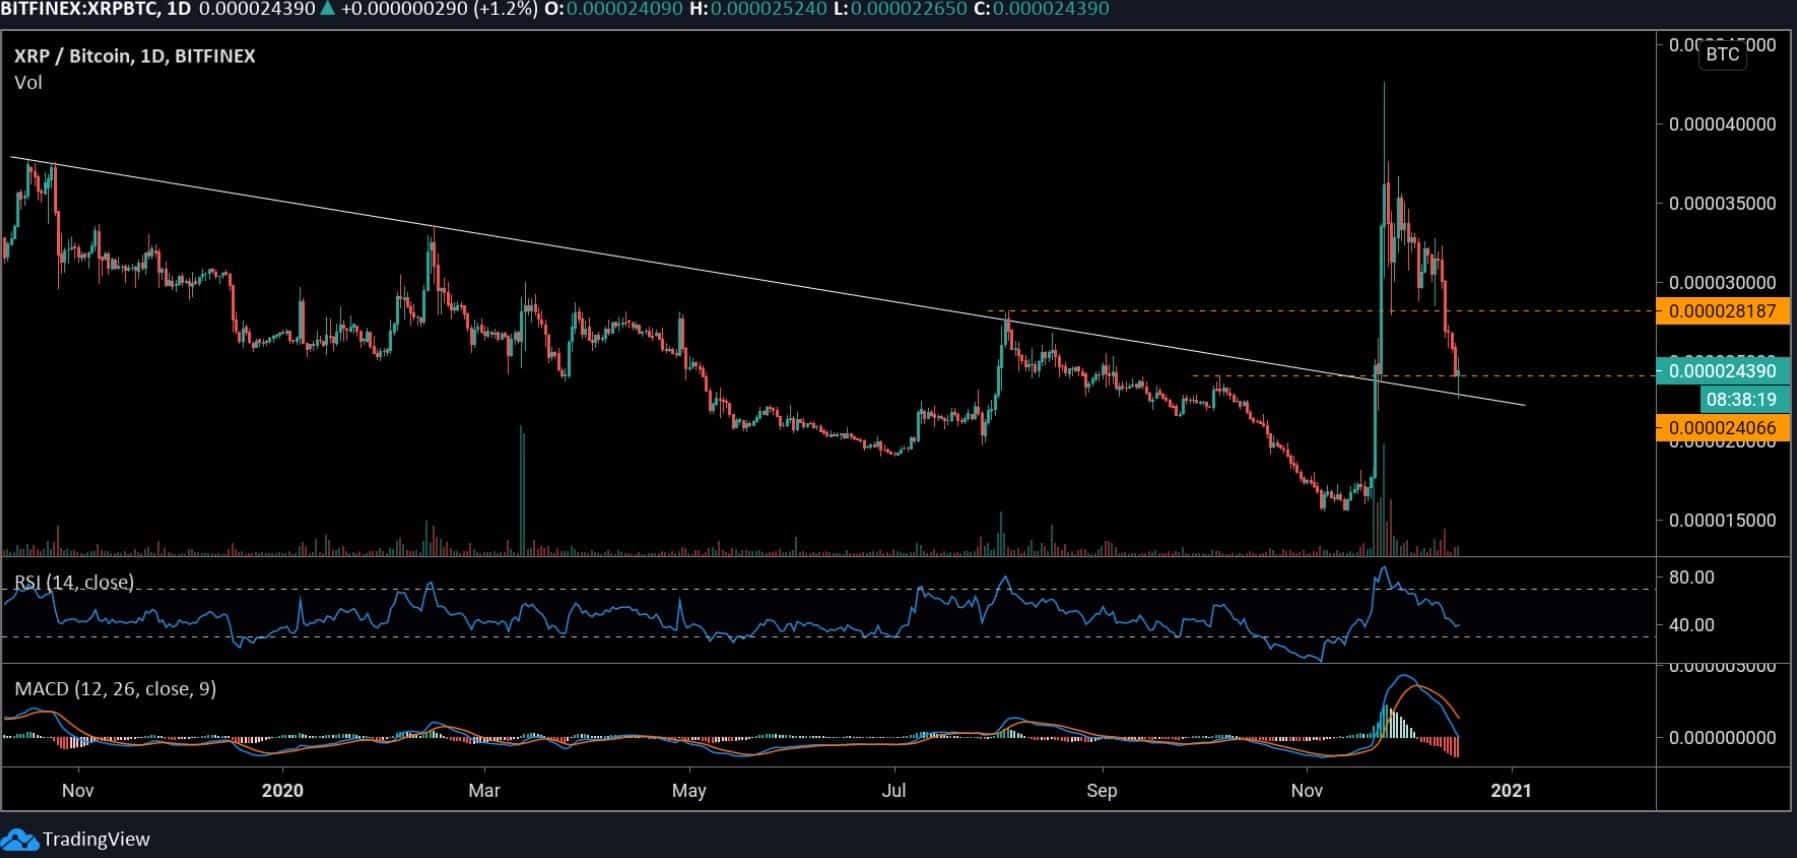
Against Bitcoin, Ripple’s correction has reached a key level for recovery. After retesting the crucial descending trend line today, XRP saw a sharp bounce to where it’s trading around 2400 SAT. The trend is still bearish on the daily chart, but it appears buyers are beginning to show commitment.
More positive actions are likely if the third-largest crypto by market cap can hold support above the daily RSI 30. It’s also important to keep an eye on the technical MACD indicator as it may find support above the current levels. However, more pain can be anticipated if these key indicator levels fail.
XRP-BTC: Resistance and Support Levels
Looking at the fresh increase above 2400 SAT, the first major resistance to keep in mind is 2818 SAT. The next resistance can be found at 3600 SAT and potentially 4200 SAT – the current yearly high.
If the price drops beneath the trend line, there’s a key psychological support at the 2000 SAT level. Following support is expected at 1800 SAT and 1500 SAT – where Ripple established a yearly low.