The price slowly recovers after finding small support around .27.The daily decrease in volume shows that bears may be around the corner.LINK/USD: Trading Volume Is Fading AwayKey Resistance Levels: .9, , .5Key Support Levels: .27, .9, .5LINK/USD. Source: TradingViewChainlink’s performance has been quite impressive during the second quarter of 2020. The bulls are still trying to remain in control of the market.Looking at the volume on the daily chart – which reveals a consistent decrease in liquidity flow for the past months – buyers appeared weak, and they may lose control soon. However, the trend still looks bullish as the price remains trapped in an ascending channel.A strong bearish momentum could be considered if the price drops off this channel. At the moment, Link
Topics:
Michael Fasogbon considers the following as important: Chainlink (LINK) Price, LINKBTC, LINKUSD, Price Analysis
This could be interesting, too:
Chayanika Deka writes Chainlink’s MVRV Ratio Signals Selling Exhaustion: What’s Next for LINK?
Chayanika Deka writes Whale and Shark Activity Pushes Chainlink (LINK) Past For the First Time in 37 Months
Martin Young writes Chainlink Partners With Major Finance Firms on AI, Oracles, and Blockchain Data Solution Project
Dimitar Dzhondzhorov writes Top 10 Cryptocurrencies by ‘Notable Development Activity’ (Santiment)
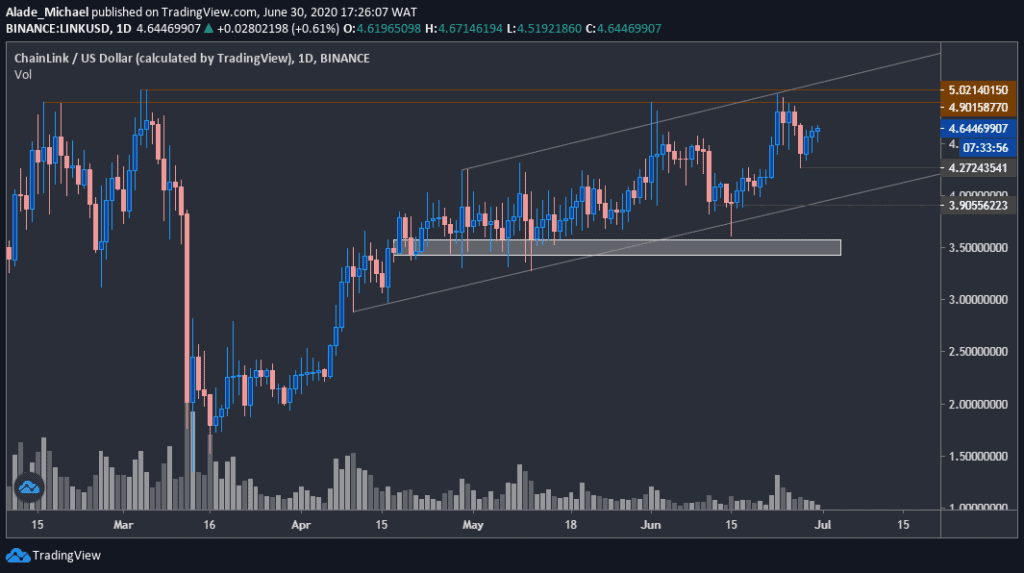
- The price slowly recovers after finding small support around $4.27.
- The daily decrease in volume shows that bears may be around the corner.
LINK/USD: Trading Volume Is Fading Away
Key Resistance Levels: $4.9, $5, $5.5
Key Support Levels: $4.27, $3.9, $3.5

Chainlink’s performance has been quite impressive during the second quarter of 2020. The bulls are still trying to remain in control of the market.
Looking at the volume on the daily chart – which reveals a consistent decrease in liquidity flow for the past months – buyers appeared weak, and they may lose control soon. However, the trend still looks bullish as the price remains trapped in an ascending channel.
A strong bearish momentum could be considered if the price drops off this channel. At the moment, Link trades around $4.60. The price may increase further if the bulls regroup.
Chainlink Price Analysis
Following the recent rejections at around $4.9 – $5 resistance levels, Link dropped to $4.27, but it is slowly bouncing back toward these levels. An increase above it could fuel more gains to $5.5.
If Chainlink initiates a sell from the current trading price, it would need to clear the current holding support at $4.27, followed by $3.9 before rolling straight into the grey demand area of $3.5. The next key support below this area is located at $3.
LINK/BTC: Buyers Are Plotting Another Move
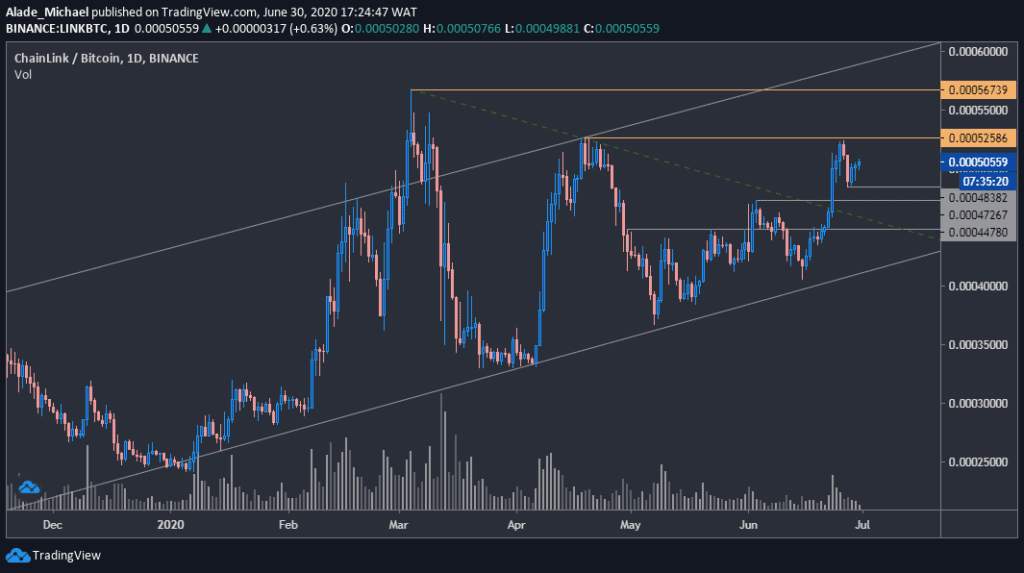
Key Resistance Levels: 52586 SAT, 56739 SAT, 60000 SAT
Key Support Levels: 48382 SAT, 47267 SAT, 44780 SAT

After three months of correction, Chainlink finally broke a crucial resistance line – (the green descending trend line in the above chart) that suppressed bullish actions since March. From around 40000 SAT, the price surged to about 52500 SAT last week before witnessing a slight drop to 50492 SAT at the time of writing.
While relying on the 48382 SAT level, the price is currently charging back at 52500 SAT, but the buying pressure is still low at the moment.
Chainlink Price Analysis
The key resistance to keep an eye on is the 52586 SAT level that was marked last week. Once it breaks, the next price targets for the bulls would be 56739 SAT before rising further to the channel’s resistance at 60000 SAT.
Below 48382 SAT, the critical level to watch is 47267 SAT. But if it fails to hold the selling pressure, Link could find a rebound at 44780 SAT level. A drop beneath this channel would set a bearish tone for the 13th largest cryptocurrency by market cap.
