XRP/USD: XRP Looking For A BreakoutKey Resistance Levels: %excerpt%.6, %excerpt%.7 %excerpt%.8Key Support Levels: %excerpt%.5, %excerpt%.4, %excerpt%.3After yesterday’s billion crash in the crypto market, XRP had managed to recovery with roughly 10% gains at the time of writing. Despite the low buying volumes, it is still trading around %excerpt%.57 price levels.Meanwhile, the third-largest coin by market cap is holding a correction in a symmetrical triangle for the past weeks. Although, a breakout could be expected soon. The RSI has found a bottom at 30, suggesting a reversal. However, the MACD is yet to confirm the bullish trend.XRP-USD: Resistance and Support LevelsLooking at the formed bull flag pattern in the above chart, if there’s an increase, it can be anticipated toward %excerpt%.8 levels in the coming days. The closest resistance
Topics:
Michael Fasogbon considers the following as important: Ripple (XRP) Price, XRP Analysis, xrpbtc, xrpusd
This could be interesting, too:
Jordan Lyanchev writes Ripple’s (XRP) Surge to Triggers Over Million in Short Liquidations
Jordan Lyanchev writes Trump Confirms Work on Strategic Crypto Reserve: XRP, ADA, SOL Included
Dimitar Dzhondzhorov writes Is a Major Ripple v. SEC Lawsuit Development Expected This Week? Here’s Why
Mandy Williams writes Ripple Releases Institutional DeFi Roadmap for XRP Ledger in 2025
XRP/USD: XRP Looking For A Breakout
Key Resistance Levels: $0.6, $0.7 $0.8
Key Support Levels: $0.5, $0.4, $0.3
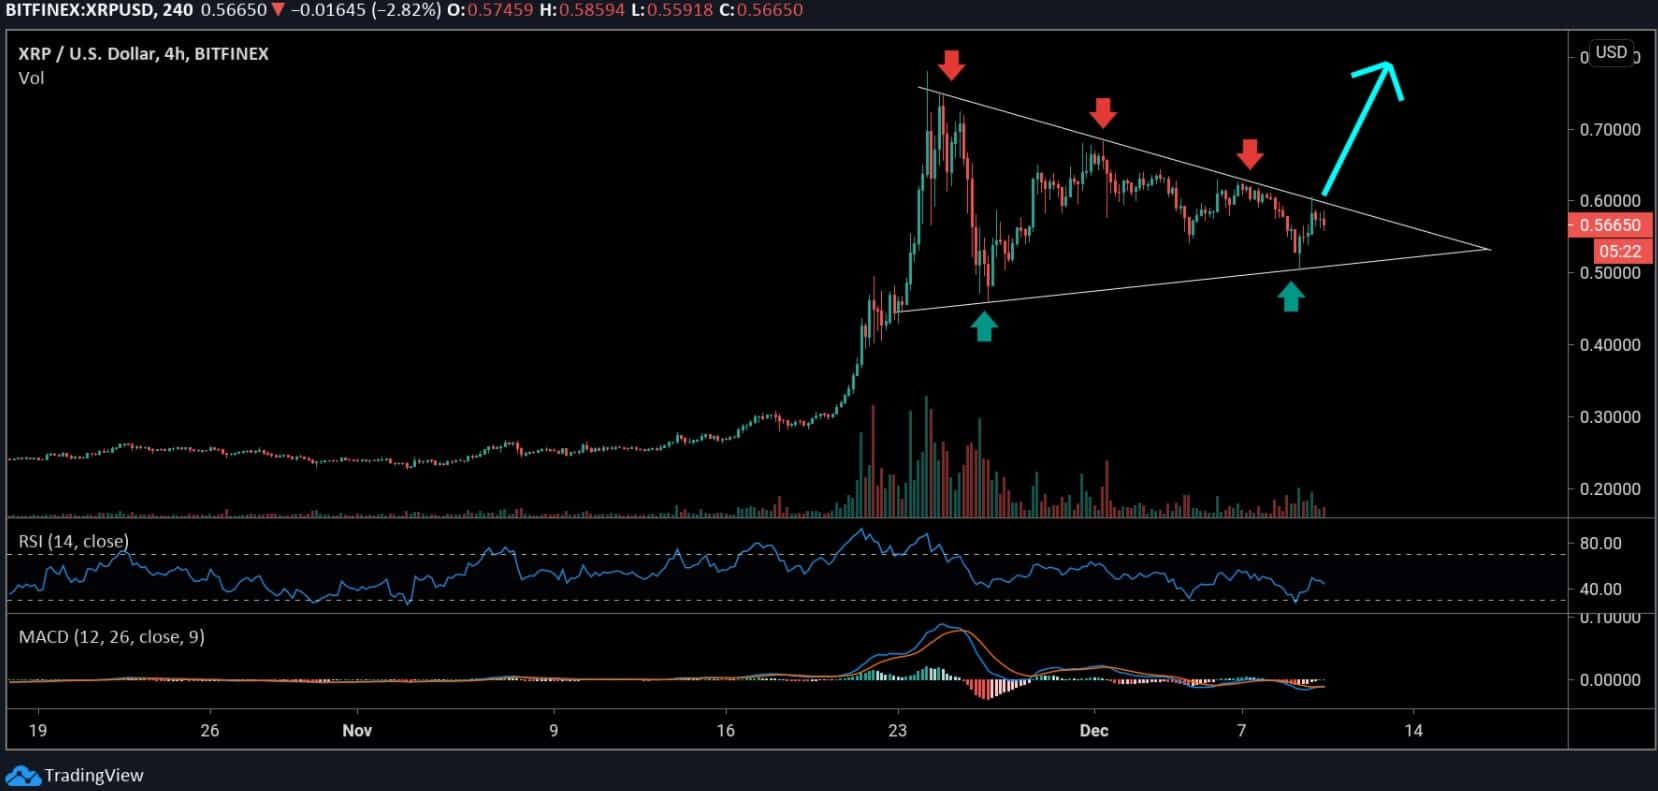
After yesterday’s $35 billion crash in the crypto market, XRP had managed to recovery with roughly 10% gains at the time of writing. Despite the low buying volumes, it is still trading around $0.57 price levels.
Meanwhile, the third-largest coin by market cap is holding a correction in a symmetrical triangle for the past weeks. Although, a breakout could be expected soon. The RSI has found a bottom at 30, suggesting a reversal. However, the MACD is yet to confirm the bullish trend.
XRP-USD: Resistance and Support Levels
Looking at the formed bull flag pattern in the above chart, if there’s an increase, it can be anticipated toward $0.8 levels in the coming days. The closest resistance to watch here are the $0.6 and then $0.7 levels.
If XRP gets rejected at the $0.6 resistance, a fresh drop could send the price back to $0.5 support – yesterday low. The following support levels lie at $0.4 and $0.3.
XRP/BTC: XRP Consolidates Though Gains Could be Expected
Key Resistance Levels: 3600 SAT, 4200 SAT, 4500 SAT
Key Support Levels: 2900 SAT, 2400 SAT, 2000 SAT
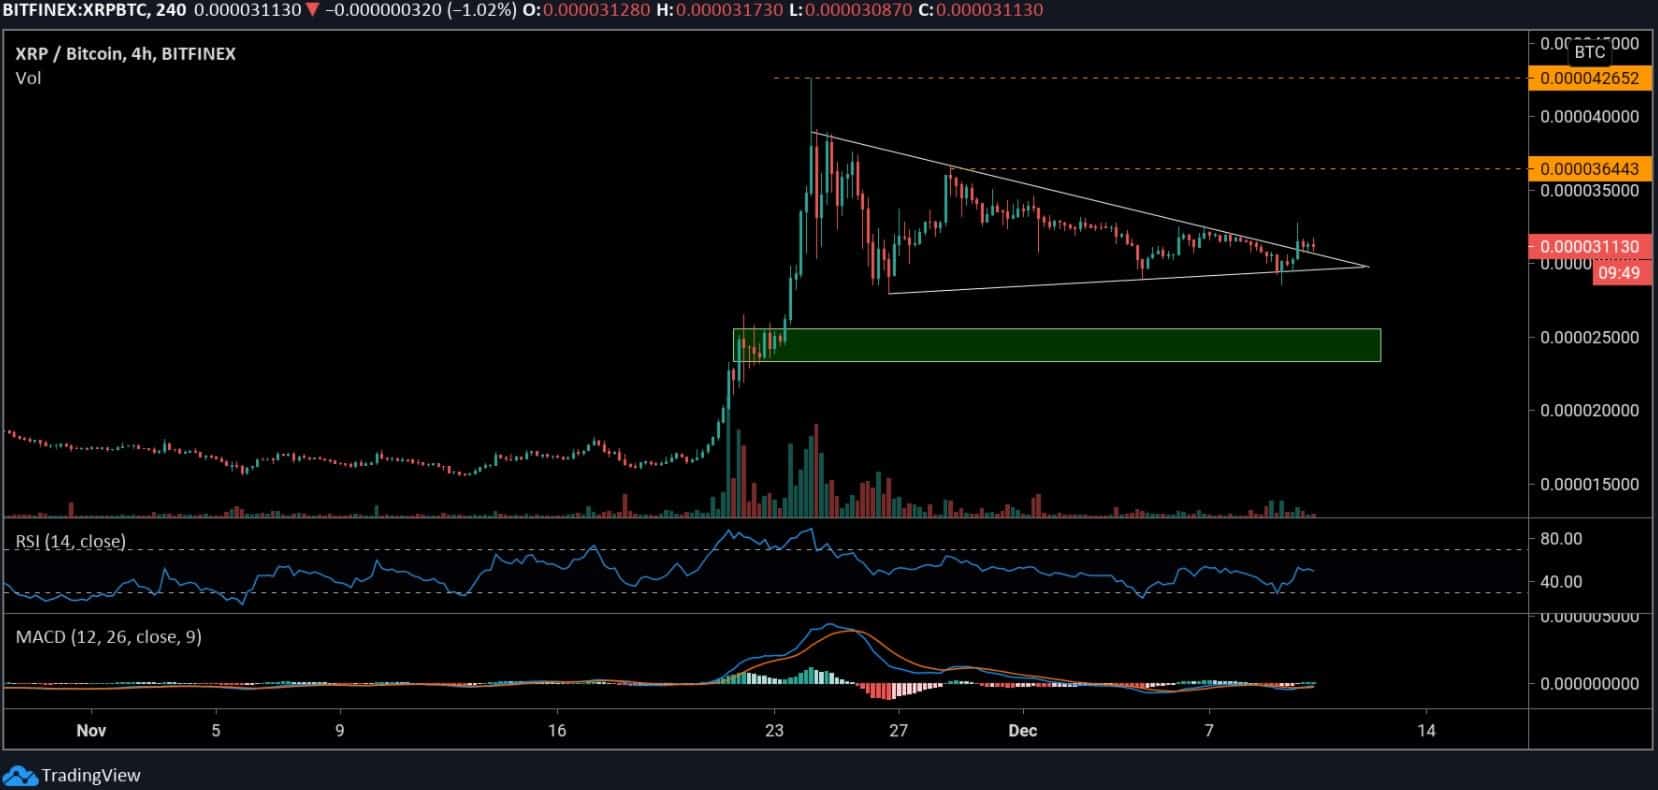
Against Bitcoin, XRP saw a bounce after testing the triangle’s support at 2900 SAT level yesterday. The price is currently consolidating at around 3130 SAT following a slight break above the descending triangle forming since late November. However, this breakout is yet to validate strong bullish actions.
Considering the RSI double-bottom, a huge price movement could be expected shortly. The 4-hours MACD indicator is slightly negative but it’s poised for a bullish crossover.
XRP-BTC: Resistance and Support Levels
If the price continues to increase well above the 3000 SAT level, the key resistance to keep in mind is 3660 SAT. The next major resistance can be found at 4200 SAT before breaking higher.
The 2900 SAT level is currently holding as weekly support. In case of a breakdown, the immediate support to watch out for is 2400 SAT, marked green on the chart. The next key support is the 2000 SAT level.