Stellar jumped above a 12-month high following 21% daily gains.Against Bitcoin, it’s currently trading just below 1000 SAT.XLM/USD: Stellar Facing Channel’s Resistance Key Resistance Levels: %excerpt%.1, %excerpt%.135Key Support Levels: %excerpt%.0864, %excerpt%.077XLM/USD. Source: TradingViewStellar saw impressive growth over the past four days, with almost 33% gains since the beginning of the month. Meanwhile, it started to show positive signs after exhausting June’s bearishness at around %excerpt%.057, which is now holding as monthly support.Following the massive weekly recovery, the price hit %excerpt%.099, with about a 20% increase today. But considering the test at the upper boundary of the channel, it may pullback briefly to June’s high of %excerpt%.0864 level before resuming the uptrend.The bull’s target still lies at the %excerpt%.1
Topics:
Michael Fasogbon considers the following as important: Price Analysis, Stellar (XLM) Price, XLMBTC, XLMUSD
This could be interesting, too:
Jordan Lyanchev writes Stellar (XLM) Explodes by 30% in 2 Days, Bitcoin (BTC) Stable at K (Weekend Watch)
CryptoVizArt writes ETH’s Path to K Involves Maintaining This Critical Support (Ethereum Price Analysis)
Duo Nine writes Crypto Price Analysis June-29: ETH, XRP, ADA, DOGE, and DOT
Duo Nine writes Crypto Price Analysis June-15: ETH, XRP, ADA, DOGE, and DOT
- Stellar jumped above a 12-month high following 21% daily gains.
- Against Bitcoin, it’s currently trading just below 1000 SAT.
XLM/USD: Stellar Facing Channel’s Resistance
Key Resistance Levels: $0.1, $0.135
Key Support Levels: $0.0864, $0.077
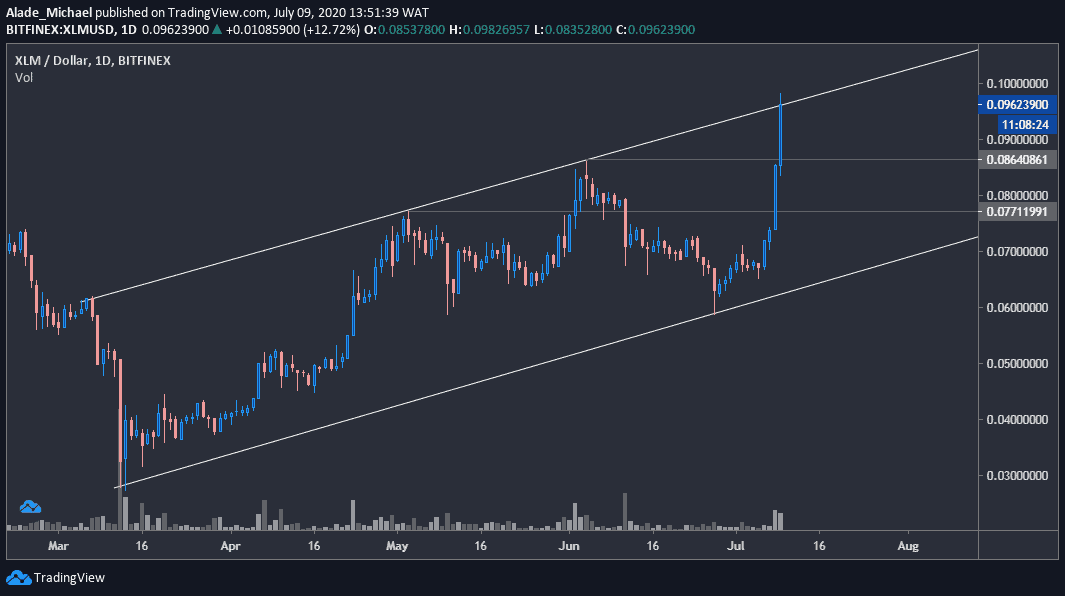
Stellar saw impressive growth over the past four days, with almost 33% gains since the beginning of the month. Meanwhile, it started to show positive signs after exhausting June’s bearishness at around $0.057, which is now holding as monthly support.
Following the massive weekly recovery, the price hit $0.099, with about a 20% increase today. But considering the test at the upper boundary of the channel, it may pullback briefly to June’s high of $0.0864 level before resuming the uptrend.
The bull’s target still lies at the $0.1 level. If they successfully sustain pressure above this psychological level, with a weekly close, a massive price movement could take place in the coming weeks. Stellar currently trades around $0.093 as more positive expectations lie ahead.
XLM Price Analysis
Looking at the current daily bull candle, it shows signs of rejection around the channel’s resistance. If the price drops and fails to find support at the mentioned level of $0.0864, it may dip further to $0.077 before it takes off again.
But if Stellar’s price keeps rising, especially above the critical psychological level of $0.1, the next move would target March’s 2019 resistance at $0.135, followed by $0.15. However, the price would remain trapped in this ascending channel if the breakout fails.
XLM/BTC: Stellar Jumped Above Crucial Supply Zone
Key Resistance Levels: 1046 SAT, 1200 SAT, 1600 SAT
Key Support Levels: 900 SAT, 844 SAT, 739 SAT
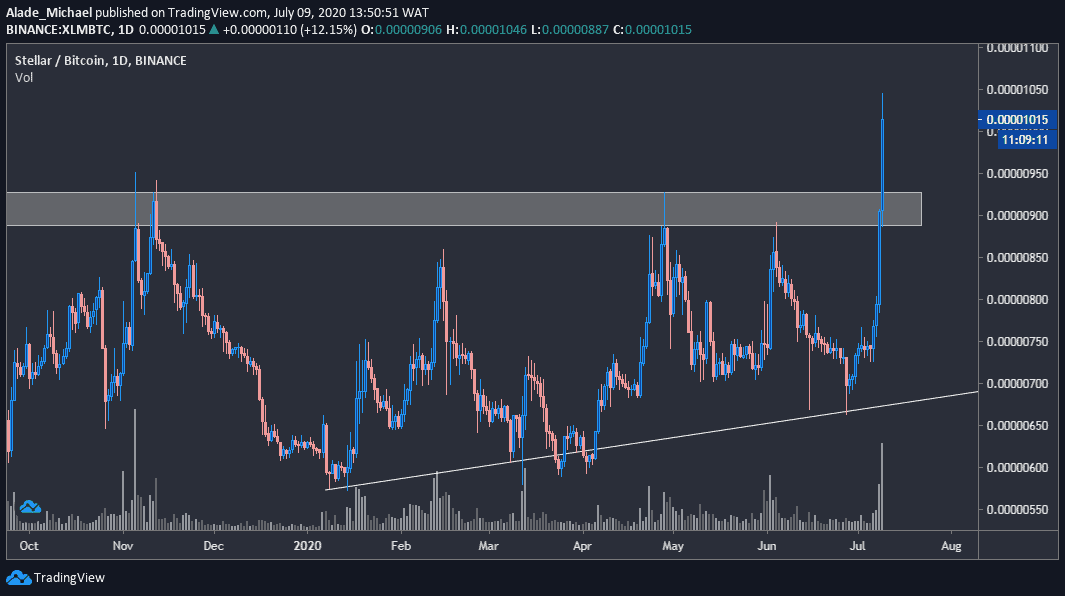
Against Bitcoin, Stellar finally broke out from a long-term bearish zone after facing heavy supply at 900 SAT since mid–2019. Following quick rejection from the 1046 SAT level, it is now changing hands at around 1013 SAT with a daily surge of 18%.
The bullish actions started with a higher high and a higher low pattern from around 573 SAT in mid-January, where the ascending trend line started to form. If Stellar continues to follow this pattern, the current rejection from the 1046 SAT level could lead to a serious selloff in the coming weeks.
If not, it is likely to hold the grey supply zone of 900 SAT – that got broken today – as a critical demand zone to start a new increase to 1600 SAT in the near term.
XLM Price Analysis
Steller is currently looking bullish on the intraday trading charts. A continuous increase above the current daily high of 1046 SAT could send the 14th largest coin by market cap straight to 1200 SAT in no time. The key resistance to watch above this level is 1600 SAT if it advances higher.
900 SAT would be considered as a rebound level if the price keeps dropping. Below this lies 844 SAT, and 739 SAT should a strong retracement occurs. But as it stands now, the bulls are trying to sustain momentum above the key breakout level.