Binance Coin lost 3% over the past hours following a quick drop in Bitcoin’s price.The price continues to face rejection at a crucial resistance line after seven days of recovery.After the breakout, BNB consolidated and dropped back inside a demand zone of 0.0165 BTCBNB/USD: BNB Rejects At Resistance LineKey Resistance Levels: , .7, Key Support Levels: , .7, .6BNB/USD. Source: TradingViewBinance Coin decreased by 2.80% overnight following yesterday’s drop in Bitcoin’s price, although the pressure is a bit calm at the time of writing. It is now changing hands around .34 after the rejection around the yellow resistance () line forming since June.Looking at the market structure, BNB is technically bearish on the current 4-hours chart, but it is still trading within a
Topics:
Michael Fasogbon considers the following as important: Binance Coin (BNB) Price, BNBBTC, bnbusd, Price Analysis
This could be interesting, too:
Chayanika Deka writes Osprey Funds Launches First US Publicly Quoted BNB Trust
Chayanika Deka writes BNB Overtakes Solana to Secure 5th Spot by Market Cap After Historic Rally
CryptoVizArt writes ETH’s Path to K Involves Maintaining This Critical Support (Ethereum Price Analysis)
Dimitar Dzhondzhorov writes Binance to Temporarily Suspend Deposits and Withdrawals on BNB Smart Chain Soon: Here’s Why
- Binance Coin lost 3% over the past hours following a quick drop in Bitcoin’s price.
- The price continues to face rejection at a crucial resistance line after seven days of recovery.
- After the breakout, BNB consolidated and dropped back inside a demand zone of 0.0165 BTC
BNB/USD: BNB Rejects At Resistance Line
Key Resistance Levels: $16, $16.7, $18
Key Support Levels: $15, $14.7, $13.6
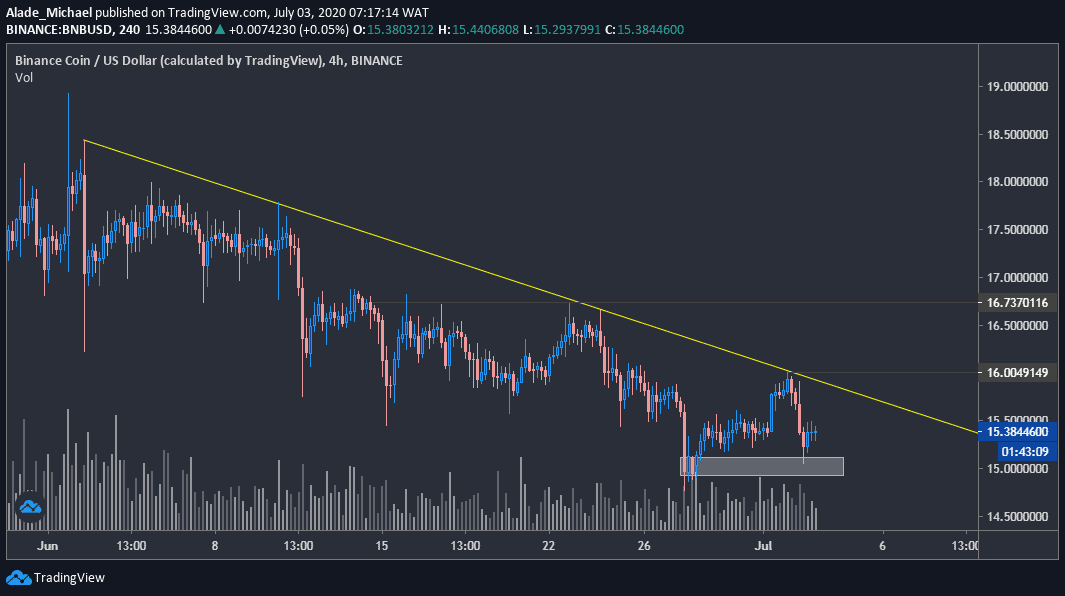
Binance Coin decreased by 2.80% overnight following yesterday’s drop in Bitcoin’s price, although the pressure is a bit calm at the time of writing. It is now changing hands around $15.34 after the rejection around the yellow resistance ($16) line forming since June.
Looking at the market structure, BNB is technically bearish on the current 4-hours chart, but it is still trading within a bullish zone on the daily chart. Once the price drops below $14, intense bearish action would be considered.
But if the price manages to climb back above the falling resistance line – marked yellow – the mid-term bullishness is likely to resume. As it stands now, the bears are gaining control over a short-term perspective.
Binance Price Analysis
Even though the price climbed above this resistance line, Binance Coin would still need to push above the previous rejection level of $16 before confirming a further move to $16.7. The resistances above this level lies at $18 and $19.1 – the current yearly high.
After recovering from the grey-marked demand – $15, the BNB/USD pair paused bearish actions around $15.3 as it decides on the next significant move. The bears are slowly stepping back into the market. Meanwhile, it is currently relying on the support at $14.7. A break below this target could trigger a massive sell to around $13.6.
BNB/BTC: BNB Fakes-Out Reversal
Key Resistance Levels: 0.00173 BTC, 0.001754 BTC, 0.00178 BTC
Key Support Levels: 0.001666 BTC, 0.0015 BTC, 0.0014 BTC
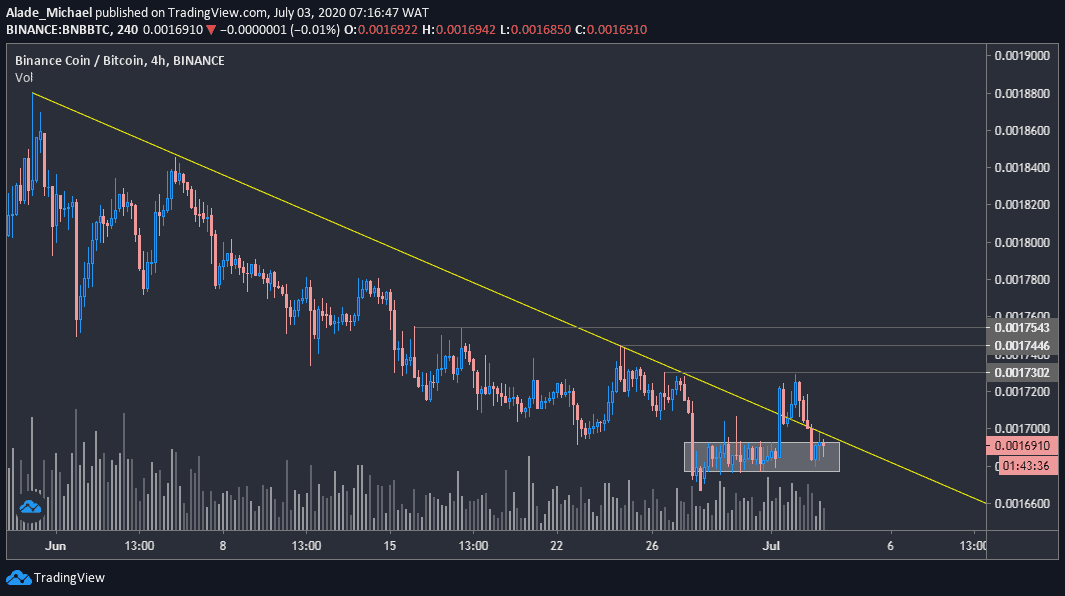
Binance coin is looking bearish on the 4-hours time frame, but the recent surge (fake out) above the white resistance line seems to have trapped a lot of buyers due to the latest losses in the entire crypto space.
However, the 9th largest cryptocurrency by market cap is trading around a demand area of 0.00169 BTC, and at the same time approaching weekly support established at around 0.00166 BTC. This support is likely to break if sellers continue to mount pressure.
On the other hand, a bullish action can be expected if the price recovers, especially above the grey horizontal lines, which is likely to set a reversal on the 4-hours chart. Inversely, the price would need to drop below the mentioned 0.00166 BTC support before a strong sell can be confirmed.
Binance Coin Price Analysis
The current price setup reveals that the sellers are showing interest again. But if the grey demand area can suppress selling actions, to form a W pattern, a new increase could send price straight to 0.0018 BTC in the coming days, after surpassing the 0.00173 BTC, 0.001744 BTC and 0.0001754 BTC levels simultaneously.
However, if the price slips below the 0.00166 BTC level, 0.0015 BTC and 0.0014 BTC are likely to hold as new support for the market. Binance Coin is currently subdued with choppy price actions, although it appeared that bulls are plotting a significant move against Bitcoin.