The bulls are eyeing 6 resistance, but they could get trapped if a double-top pattern comes into play.Ethereum is currently looking bullish across its trading pair after rising by 11% in 7 days.Against Bitcoin, Ethereum is starting to show strength after finding support around 0.021BTC.ETH/USD: Ethereum Eyeing 6 Key Resistance Levels: 7, 6.8, 6Key Support Levels: 1, 6, 2.6ETH/USD. Source: TradingViewA few days back, Ethereum saw a sharp correction to 5 after marking a 2-month high at 6 in late April. But now, the second-largest cryptocurrency is regaining momentum. In fact, it is now trading well above 0 over the last 24-hours.Ethereum is charging towards the 6 resistance with a double-top formation, which could result in a massive drop if this bearish
Topics:
Michael Fasogbon considers the following as important: ETH Analysis, ETHBTC, Ethereum (ETH) Price, ethusd
This could be interesting, too:
W. E. Messamore writes Ethereum Killers Are Rallying: Is Ether (ETH) K Still in the Cards?
Mandy Williams writes Retail Investors Persist in Holding ETH Despite Asset’s Recent Surge: CryptoQuant
Martin Young writes Ethereum’s Modular Strategy: Short-Term Pain, Long-Term Gain, Says Research
Chayanika Deka writes Ethereum Foundation Resumes ETH Selling Amid Price Rally
- The bulls are eyeing $226 resistance, but they could get trapped if a double-top pattern comes into play.
- Ethereum is currently looking bullish across its trading pair after rising by 11% in 7 days.
- Against Bitcoin, Ethereum is starting to show strength after finding support around 0.021BTC.
ETH/USD: Ethereum Eyeing $226
Key Resistance Levels: $217, $226.8, $246
Key Support Levels: $191, $176, $152.6
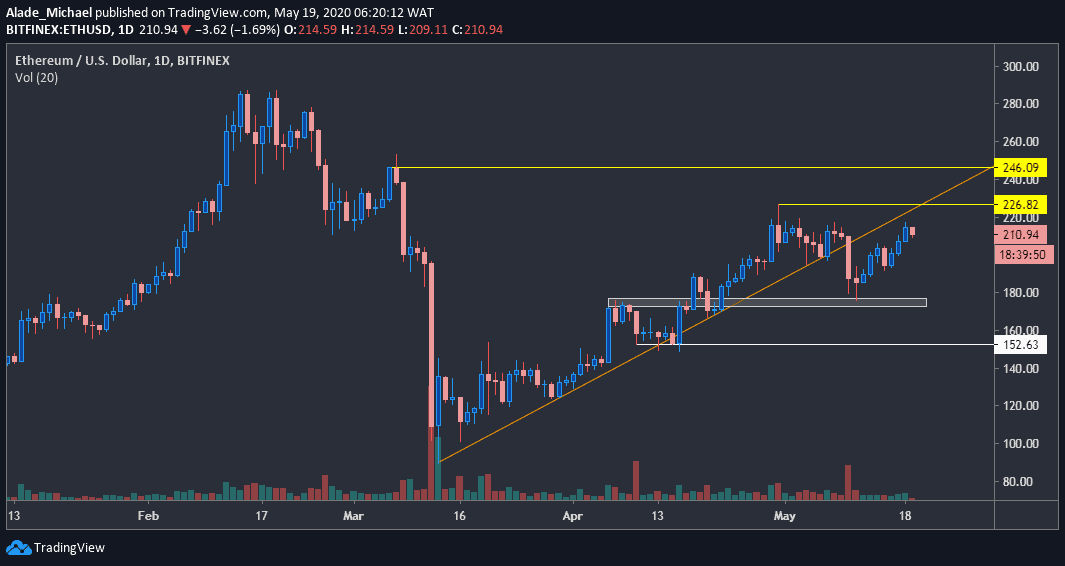
A few days back, Ethereum saw a sharp correction to $175 after marking a 2-month high at $226 in late April. But now, the second-largest cryptocurrency is regaining momentum. In fact, it is now trading well above $200 over the last 24-hours.
Ethereum is charging towards the $226 resistance with a double-top formation, which could result in a massive drop if this bearish pattern plays out. Notwithstanding, the price is down 2% at the time of writing.
Another thing that is likely to stop the ongoing bull action is the orange ascending trend line that got broke down on May 8. However, if the buyers successfully push the price above these confluence resistance areas, a fresh bullish phase might come into play.
Ethereum Price Analysis
In the meantime, Ethereum would be considered bullish as long as the price remains above $200. An increase above yesterday’s high of $217 should attract more buying pressure to $226 resistance.
In case of a break, the March 7 opening price of $246 would be the next buying target for ETH.
But if the $226 resistance rejects the price, along with the orange rising line, a double-top pattern could initiate a huge selloff to the $152.6 support, marked white on the price chart. For now, the closest support to pay attention to is $191 and $176 – the grey spot.
ETH/BTC: Ethereum Is Slowly Regaining Momentum
Key Resistance Levels: 0.0222 BTC, 0.023 BTC, 0.0241 BTC
Key Support Levels: 0.0215 BTC, 0.021 BTC, 0.0205 BTC
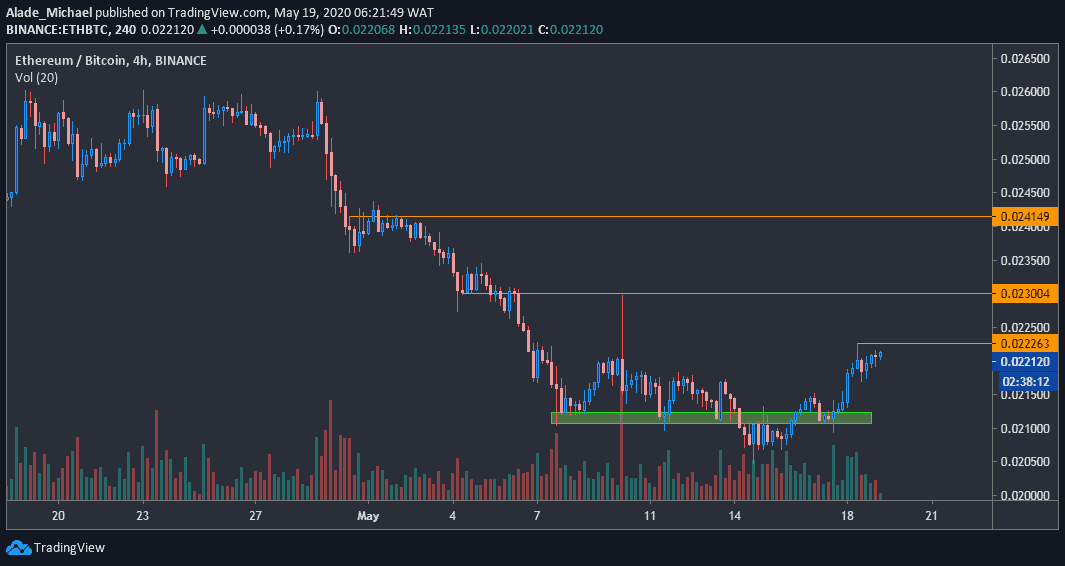
Against Bitcoin, ETH bounced back after dropping slightly below 0.021 BTC level last week. This price area is now serving as base support following a 3-week steady decline from the 0.026 BTC resistance level.
The recent recovery has brought the current trading price to 0.022BTC. However, Ethereum is now preparing for another increase after providing a discount at around 0.0217 BTC yesterday. As can be seen on the 4-hours chart, the price is slowly rising near yesterday’s high of 0.0222 BTC level, which is an essential level for a potential bullish continuation.
However, more positive actions can be expected once ETH finds a break above the 0.0222 BTC resistance. The only condition for a negative action is if the price drops significantly below the 0.020 BTC.
From a technical perspective, Ethereum is starting to show signs of recovery as buyers could gain control if the setups become significant.
Ethereum Price Analysis
If Ethereum fails to surpass yesterday’s high of 0.0222BTC level, the price could roll back to the green support area of 0.021 BTC. Support below this area lies at 0.0205 BTC (last week’s bottom). However, close support at 0.0215 BTC could serve as a short rebound level if buyers can act upon it.
On the other hand, ETH would need to clear the mentioned 0.0222 BTC before it can continue to bring more gains towards the 0.023 BTC and 0.0241 BTC resistance levels, marked orange on the price chart. So far, the price has been in favor of the bulls for the past four days now.