Litecoin is currently facing monthly resistance, but the future looks very promising for the bullsAgainst Bitcoin, the price continued to follow a bearish sentiment on a short-term perspectiveIf a rebound fails at the 0.005575 BTC support level, Litecoin may roll back to March lowLTC/USD: Litecoin Stuck At ResistanceKey Resistance Levels: .68, , Key Support Levels: .5, .4, .6LTC/USD. Source: TradingViewWhile most top cryptocurrency recently created a fresh monthly high, Litecoin, the 7th largest cryptocurrency by market cap, is yet to find a clean crossover. The price is currently trading at key resistance of .68 after seeing a 7% surge under 24-hours.Litecoin might be facing hurdles at this monthly resistance, but the future looks promising for buyers if the price
Topics:
Michael Fasogbon considers the following as important: Litecoin (LTC) Price, LTCBTC, ltcusd, Price Analysis
This could be interesting, too:
Chayanika Deka writes Bitcoin Ends Week with 5M Inflows as Multi-Asset Products Face 1M in Losses
Chayanika Deka writes Litecoin Network Activity Surges, Reaching 401,000 Daily Active Addresses
CryptoVizArt writes ETH’s Path to K Involves Maintaining This Critical Support (Ethereum Price Analysis)
Chayanika Deka writes Small Litecoin (LTC) Fishes Are ‘Jumping Ship,’ Here’s What it Means
- Litecoin is currently facing monthly resistance, but the future looks very promising for the bulls
- Against Bitcoin, the price continued to follow a bearish sentiment on a short-term perspective
- If a rebound fails at the 0.005575 BTC support level, Litecoin may roll back to March low
LTC/USD: Litecoin Stuck At Resistance
Key Resistance Levels: $47.68, $51, $55
Key Support Levels: $45.5, $43.4, $39.6
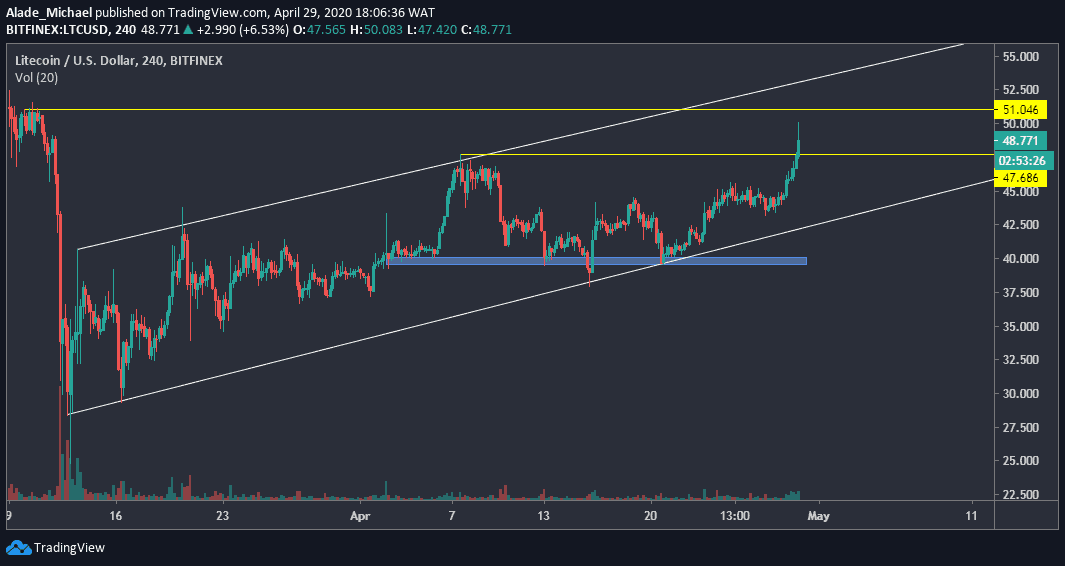
While most top cryptocurrency recently created a fresh monthly high, Litecoin, the 7th largest cryptocurrency by market cap, is yet to find a clean crossover. The price is currently trading at key resistance of $47.68 after seeing a 7% surge under 24-hours.
Litecoin might be facing hurdles at this monthly resistance, but the future looks promising for buyers if the price breaks through.
As can be seen on the 4-hours chart, $39.6 LTC is aiming at the upper boundary of the channel following a sharp rebound from the channel’s support of $39.6 on April 20.
Once Litecoin overcomes this current resistance, the price is expected to rally upward. However, Litecoin may pull back to the channel’s support if this resistance continues to pose a threat to the bulls.
Litecoin Price Analysis
A clear cross above the immediate yellow resistance at $47.68 should confirm a strong buying pressure to the next yellow resistance at $51. The resistance above this level is located at $55, around the channel’s upper boundary.
If the price continues to struggle under this holding resistance, Litecoin may look for close support around $45.5 (last week’s high).
If this support fails to provide a rebound level, the price may drop lower to $43.4 – the weekly low. The next support after this can be found at the blue demand area of $39.6, right beneath the channel.
LTC/BTC: Litecoin Continues Losing Momentum
Key Resistance Levels: 0.0060 BTC, 0.006375 BTC
Key Support Levels: 0.005575 BTC, 0.00511 BTC
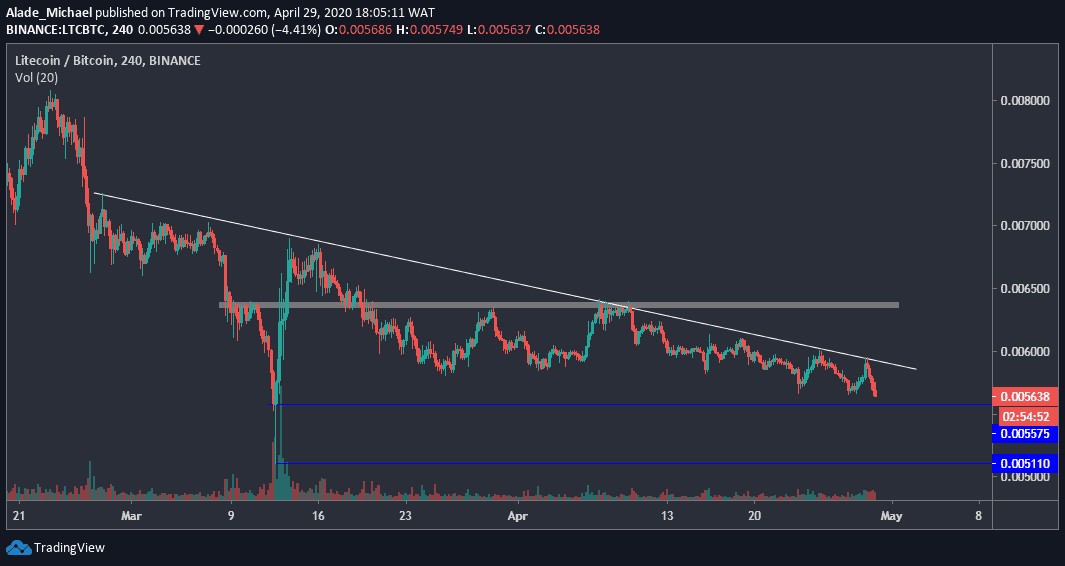
Against Bitcoin, LTC continued to trend in a downward spiral after losing momentum in February, leading to a huge market crash in March. In fact, the price is trading near a key support level at 0.005575 BTC at the moment.
At this support, Litecoin is likely to recover if the bulls can act on this level. If not, the price may fall more in the hands of the bears as March low may come into play once more.
Meanwhile, the ongoing bearish sentiment is still much respecting the white regression line that is forming since February 27. A break above it would signal a bullish action in the market.
Litecoin Price Analysis
Litecoin is currently trading around 0.00564 BTC. The closest support level to watch is 0.005575 BTC in case of a drop. Below this support lies at 0.00511 BTC, where the price wicked on March 12.
From above, LTC recently got rejected around a daily resistance at 0.005951 BTC, accompanied by the white regression line. If a breakout occurs, especially above 0.006 BTC, the next resistance to watch would be at the 0.006375 BTC area, marked grey on the 4-hours chart.
As it appeared now, there’s no sign of bullish actions in the market as the sentiment remains bearish on the short-term trend.