With 4.08% growth under 24-hours, Tezos remains the 12th largest cryptocurrency by market cap.Tezos is stuck under 24000SAT level as buyers appeared weak against Bitcoin.Notwithstanding, XTZ is technically bullish across trading pairs.Key Resistance Levels: .3, .5Key Support Levels: .05, .90General OverviewSince our previous price analysis, XTZ surged to reach .25 earlier today. The substantial growth has brought an increase of about 30% since the monthly opening.The interesting thing is that Tezos has remained the 12th largest cryptocurrency by market cap for some days now. Following the latest market sentiment, XTZ is trading around .15 against the US Dollar with 1.45% gains over the past few hours.While correcting loss at -2.18%, Tezos is currently valued at 21996SAT level
Topics:
Michael Fasogbon considers the following as important: Price Analysis, Tezos (XTZ) Price
This could be interesting, too:
CryptoVizArt writes ETH’s Path to K Involves Maintaining This Critical Support (Ethereum Price Analysis)
Duo Nine writes Crypto Price Analysis June-29: ETH, XRP, ADA, DOGE, and DOT
Duo Nine writes Crypto Price Analysis June-15: ETH, XRP, ADA, DOGE, and DOT
Duo Nine writes Why is the Shiba Inu (SHIB) Price Down Today?
- With 4.08% growth under 24-hours, Tezos remains the 12th largest cryptocurrency by market cap.
- Tezos is stuck under 24000SAT level as buyers appeared weak against Bitcoin.
- Notwithstanding, XTZ is technically bullish across trading pairs.
Key Resistance Levels: $2.3, $2.5
Key Support Levels: $2.05, $1.90
General Overview
Since our previous price analysis, XTZ surged to reach $2.25 earlier today. The substantial growth has brought an increase of about 30% since the monthly opening.
The interesting thing is that Tezos has remained the 12th largest cryptocurrency by market cap for some days now. Following the latest market sentiment, XTZ is trading around $2.15 against the US Dollar with 1.45% gains over the past few hours.
While correcting loss at -2.18%, Tezos is currently valued at 21996SAT level against Bitcoin. Although, the XTZ market is still cumulatively up by 4.08%. However, the overall market is keeping a bullish trend. The current slight drop in price is just a reflection of bearish reactions.
We can expect Tezos to keep growing until the bullish momentum is exhausted. As of now, Tezos is up more gains against the US Dollar. Considering the recent price rejection on the daily chart, the XTZ/BTC pair may drop a bit before resuming upward movement.
Tezos Price Analysis
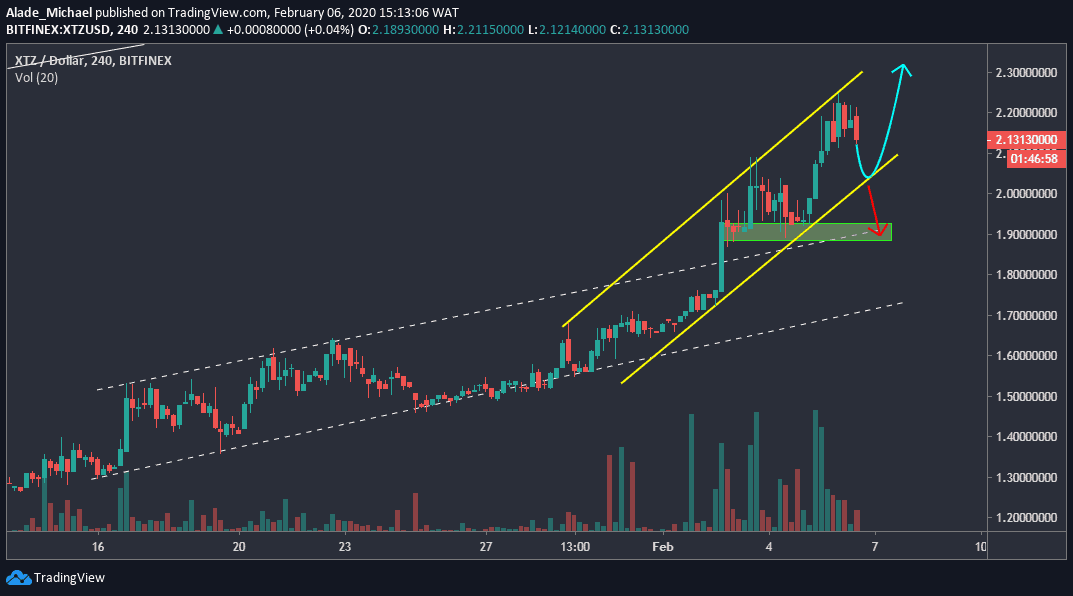
Against the USD, XTZ is positioned in an upward range against the US Dollar pair. XTX has shown a lot of strength following the price break from the white channel to the yellow channel, as depicted on the price chart. Tezos consolidated after reaching the yellow channel’s resistance around $2.25 today but is now displaying a sign of weakness.
Though the bullish pattern is still valid as XTZ is could correct down a bit to this channel’s support at $2.05 – from where Tezos could bounce back to $2.3 and perhaps $2.5 in the next rally.
If a bounce fails at $2.05 support, the price may drop into the green support zone of $1.9. XTZ may roll back in the white-dotted channel if the mentioned zone breaks. Notwithstanding, the volume is rising by the day.
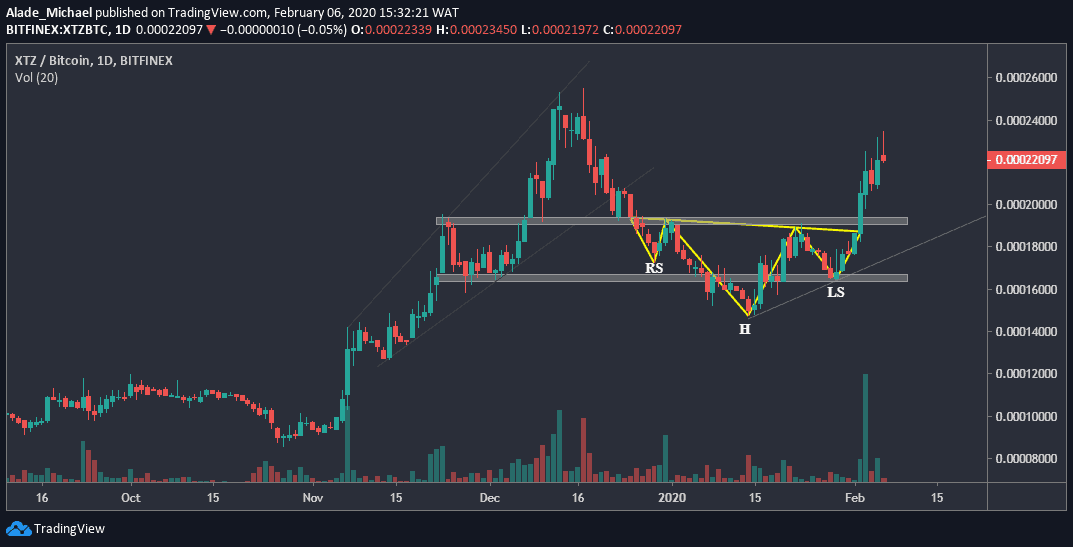
After resuming bullish with an inverse head-and-shoulder breakout, Tezos remained technically strong on the daily chart. But now, the bullish scenario seems to be getting weak. Since yesterday, Tezos has been showing a sign of weakness as price struggles under 24000SAT level.
Currently, Tezos is slowly forming an inverse hammer candle which suggests a potential reversal pattern. Though, it cannot be defined as a bearish signal at the moment. If this candle is followed by a bearish move, the market may reverse back to the grey support area of 19200SAT to test the neckline that got broken a few days ago. There’s near support at the 16500SAT level.
In case the buyers continue to push the price higher, the next key resistance to watch is 24000SAT level, followed by 28700SAT level – the December 2019 high. A break above this level would allow a massive buying pressure in the market. At the moment, the trading volume is still moderate. Huge volatility should be expected once volume becomes significant in this market.