History is not an indicator for future performance, but it’s definitely interesting looking at it, especially when it comes to bitcoin’s price and how it performed in the past.A similarity brought up by a popular crypto proponent, and chartist shows a compelling bullish cycle where BTC’s price is far from having reached its peak just yet.Bitcoin Price: 2013 vs. NowWell-known cryptocurrency advocate CryptoBull brought up an interesting comparison between the price performance of bitcoin from the end of 2013 when BTC reached an all-time high of around ,160 and when it reached the current high of around ,000 in December 2017.What’s interesting is the period after those peaks.BTC/USD. Source: TwitterAs seen in the above chart, after 2013’s peak, BTC went into a prolonged decline, which
Topics:
George Georgiev considers the following as important: AA News, Bitcoin (BTC) Price, BTCEUR, BTCGBP, btcusd, btcusdt
This could be interesting, too:
Chayanika Deka writes Yuga Labs Secures Major Win as SEC Closes Investigation Without Charges
Andrew Throuvalas writes Bitcoin Soars Back To ,000 After BlackRock CEO Says “Buy The Dip”
Chayanika Deka writes XRP, SOL, and ADA Inclusion in US Crypto Reserve Pushes Traders on Edge
Chayanika Deka writes Why Arthur Hayes Is Bullish on Bitcoin Under Trump’s Economic Strategy
History is not an indicator for future performance, but it’s definitely interesting looking at it, especially when it comes to bitcoin’s price and how it performed in the past.
A similarity brought up by a popular crypto proponent, and chartist shows a compelling bullish cycle where BTC’s price is far from having reached its peak just yet.
Bitcoin Price: 2013 vs. Now
Well-known cryptocurrency advocate CryptoBull brought up an interesting comparison between the price performance of bitcoin from the end of 2013 when BTC reached an all-time high of around $1,160 and when it reached the current high of around $20,000 in December 2017.
What’s interesting is the period after those peaks.
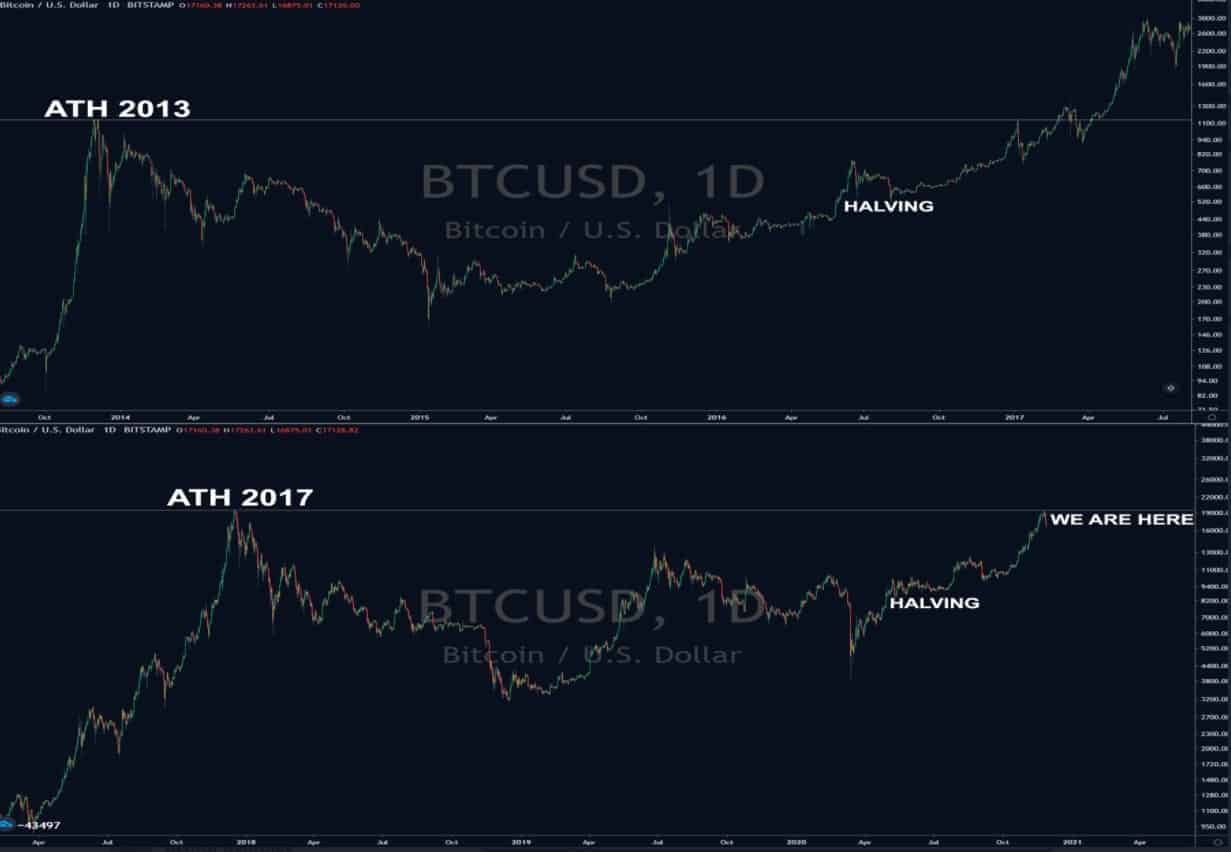
As seen in the above chart, after 2013’s peak, BTC went into a prolonged decline, which lasted for over a year. The price was continuously decreasing until January 2015, when it seemed to have found some sort of a bottom and traded in a relatively tight range until September that year. This was when the market reversed, and BTC started increasing. This move culminated about a year after that when in June 2016, BTC reached a high of $780 before retracing. Ultimately, though, despite the multitude of ups and downs along the way, BTC reached its current ATH in December 2017.
From then on, it was, like back in 2014, a prolonged bear market that lasted well over a year. The price had dropped to about $3,100 in December 2017, and the second quarter of the following year prompted a reversal in the bearish trend.
Bitcoin reached a high of around $14,000 in June 2019 – just like it had reached the high back in 2016 and started declining – again, in a similar manner. Now, if this historical outlook is to serve as an indicator for future developments, it would suggest that the current bullish rally is nowhere near its end.
In fact, given that we are only a few months after the last halving, the charts pose that the current bull run could extend in the following year and greatly surpass the current all-time high.
A Magnitude of Variables
It’s worth noting that all of the above takes into account nothing but price performance and that many factors come into play when it comes to justifying this behavior.
One thing that is particularly different this time around compared to back in the days is the overall awareness of investigators and the involvement of institutions and larger players in the market.
The current consensus is that the ongoing rally is driven largely by institutional investors rather than retail involvement. The fundamental difference between the so-called “smart money” and regular people buying Bitcoin is that the former tend to invest with a clear vision as compared to the latter.
This could, in theory, extend the rally, but it’s also very important to consider the hyper volatility of bitcoin that’s historically a defining factor.
All things considered, it’s interesting to see how the price will develop in the future and whether or not the most recent increases were just the beginning.