Over the past three days, Bitcoin was trading sideways between 00 from above and 50 from below.After getting rejected yesterday at the K resistance, along with the descending yellow trend-line as marked on the following 4-hour chart, BTC had dropped down to Sunday’s low around the 50 support line (as mentioned on our yesterday’s price analysis).However, the support line held firmly, and during the past hours’ Bitcoin started a mini bull-run climbing up and surpassing the 00.From there, the same yellow trend-line got broken above, followed by a massive 0 candle to a current daily high at 00.This is not a coincidence: The 00 – 00 was the strong support from last week and had become a strong resistance over the weekend. Once Bitcoin failed to break it, we saw the
Topics:
Yuval Gov considers the following as important: Bitcoin (BTC) Price, BTC Analysis, btcusd, btcusdt
This could be interesting, too:
Mandy Williams writes Bitcoin ETFs Record Over .6B in Outflows in the Past 2 Weeks
Chayanika Deka writes Bitcoin Whales Offload 6,813 BTC as Selling Pressure Mounts
Wayne Jones writes Bitcoin Sentiment Hits 2022 Lows as Fear & Greed Index Falls to 10
Jordan Lyanchev writes Bitcoin Falls Below K for the First Time in 3 Months, How Much Lower Can It Go?
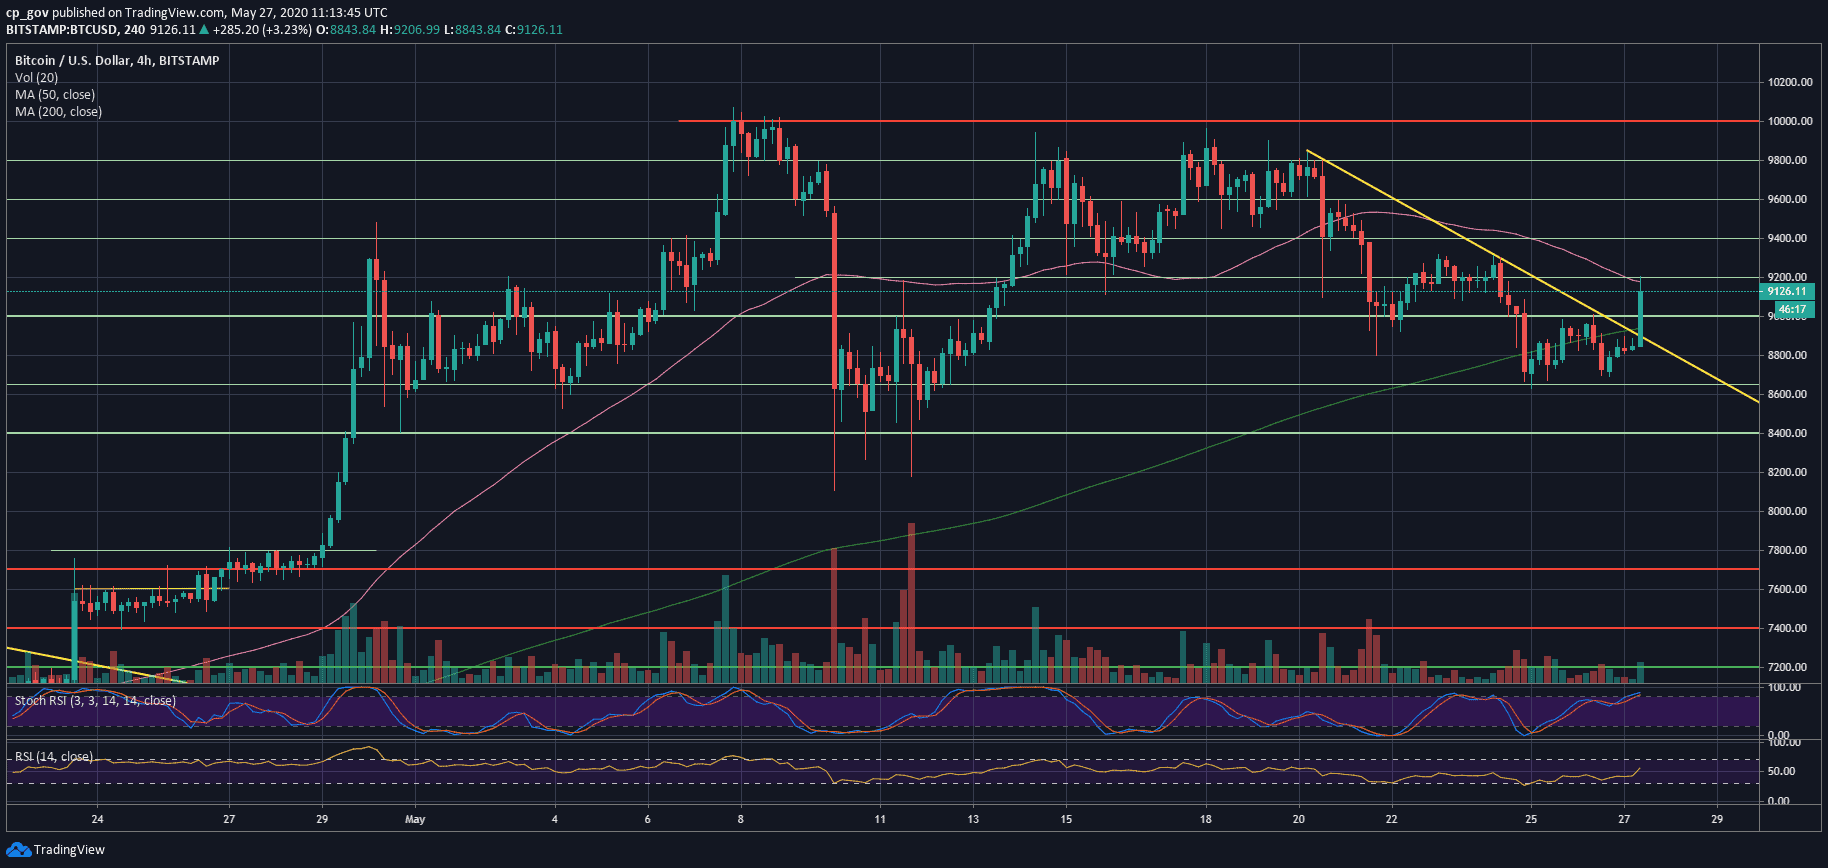
Over the past three days, Bitcoin was trading sideways between $9000 from above and $8650 from below.
After getting rejected yesterday at the $9K resistance, along with the descending yellow trend-line as marked on the following 4-hour chart, BTC had dropped down to Sunday’s low around the $8650 support line (as mentioned on our yesterday’s price analysis).
However, the support line held firmly, and during the past hours’ Bitcoin started a mini bull-run climbing up and surpassing the $8800.
From there, the same yellow trend-line got broken above, followed by a massive $400 candle to a current daily high at $9200.
This is not a coincidence: The $9200 – $9300 was the strong support from last week and had become a strong resistance over the weekend. Once Bitcoin failed to break it, we saw the huge drop to $8650 on Sunday.
BTC/USD BitStamp 4-Hour Chart
The Real Test
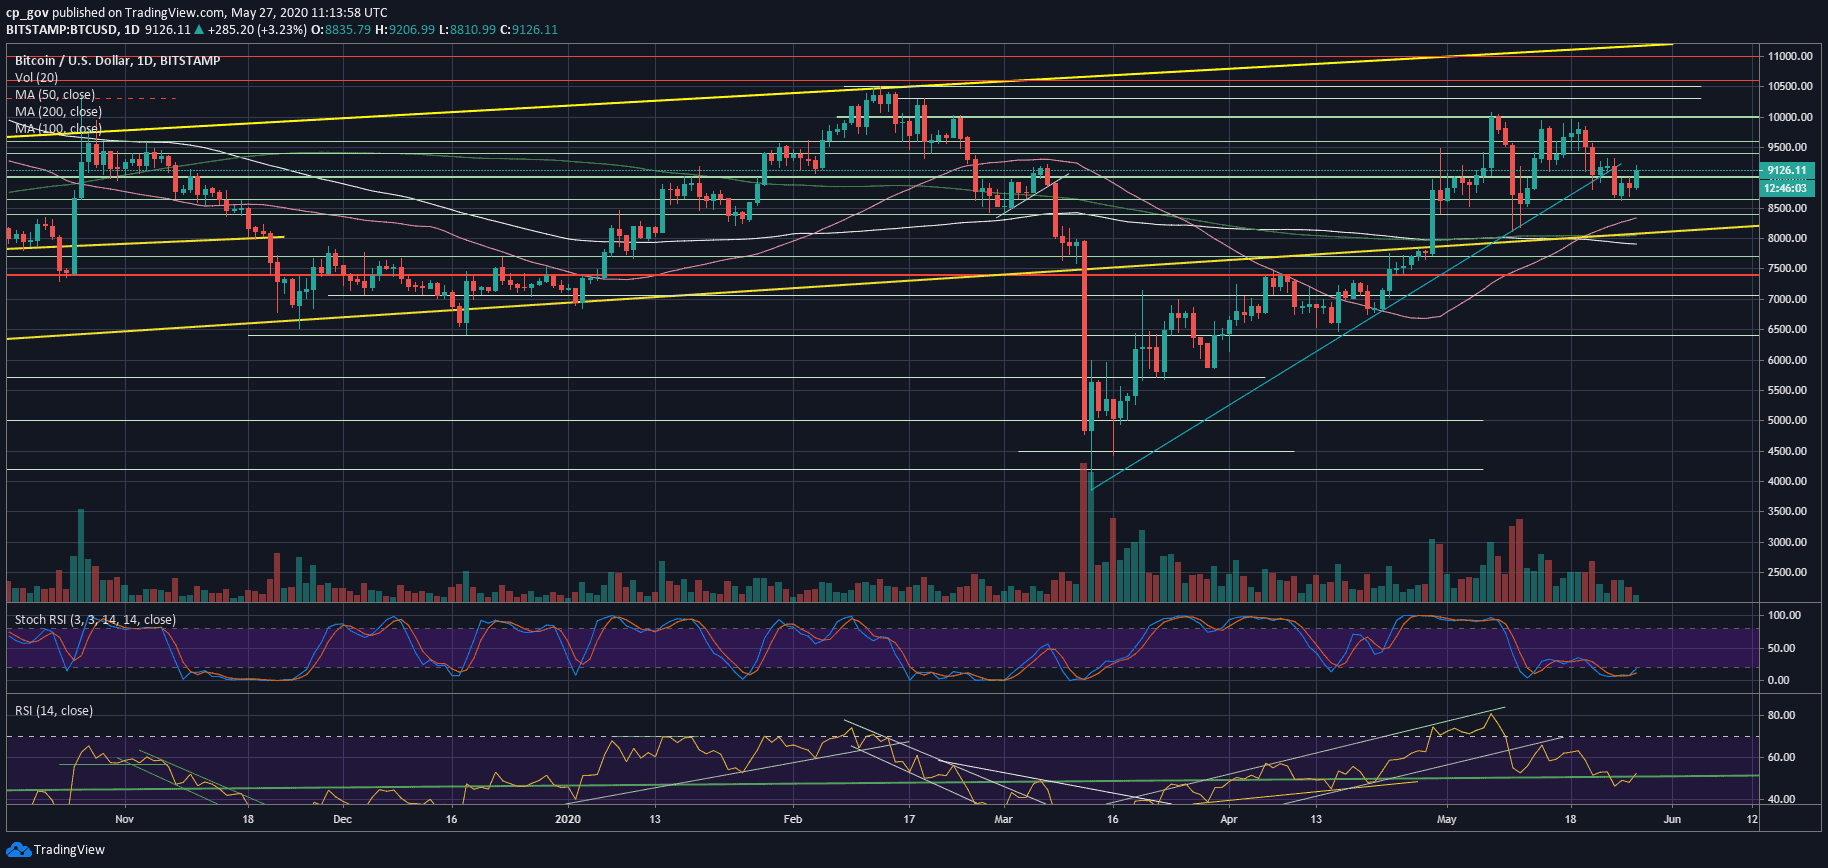
Looking at the bigger timeframe, a confirmation of a bullish trend will be made once $9200 – $9300 is breached, and a new higher-low will be produced upon this level.
As can be seen on the following charts, the above-mentioned zone was the most recent local high and as we know, a healthy bullish trajectory is only when the lows are higher over time.
Looking at the RSI indicator, we can see that it crossed the 50 level, currently around 52. This also might add to the bullishness; however, we still need to see it holding above the 50-line as well as crossing the most recent high around 53-54.
Bitcoin Short-term Support and Resistance Key Levels
As of writing these lines, Bitcoin is facing $9200 – $9300 as the first level of resistance. In case Bitcoin breaks up, then the next target would be $9400, followed by $9600.
From below, the first level of support now becomes the $9000 area. In case Bitcoin breaks down, the $8800 is also possible support, followed by yesterday’s high at $8650. However, another weekly visit to the $8650 would probably end up in a breakdown of that level.
Total Market Cap: $255 billion
Bitcoin Market Cap: $167.8 billion
BTC Dominance Index: 65.8%
*Data by CoinGecko
BTC/USD BitStamp 1-Day Chart