Solana is one of this year’s hottest topics, surging in value, popularity, and overall usage. The cryptocurrency itself is up over 13,000% so far in 2021 and this comes on the back of over $14 billion in value locked in the various decentralized protocols built on Solana.
This growth drew the community’s attention and Solana quickly became one of the most commonly discussed blockchains.
We met Yakovenko on the second day of Lisbon’s Breakpoint 2021 – a 3-day conference dedicated to the Solana ecosystem. Yakovenko must have definitely been happy and proud to see the thousands of attendees and projects, presenting all sorts of dApps and protocols on Solana.
Prior to the conference, Solana held its hackathon, which resulted in more than 500 projects getting $5 million in
Articles by Yuval Gov
Kevin O’Leary: Nothing Will Replace Bitcoin (Exclusive Interview)
June 7, 2021Kevin O’Leary, who recently allocated 3% of his portfolio in BTC, has no plans to sell his coins anytime soon, the millionaire told CryptoPotato in a recent exclusive interview.
He also noted that 2021 is a pivotal year for Bitcoin as more and more institutions are looking to enter the space but are wary of energy consumption concerns.
Kevin O’Leary during Bitcoin 2021 Conference. Image by: CryptopotatoO’Leary In Bitcoin For The Long Run
The 66-year old O’Leary is a businessman, author, politician, and perhaps best known for his participation as one of the hosts in the reality TV show Shark Tank. The millionaire has recently changed his mind on bitcoin and allocated 3% of his portfolio to the primary cryptocurrency.
During Bitcoin 2021 conference in Miami, which became the
Bitcoin Price Analysis: BTC Soars $3,500 in Hours, Now Facing Critical Resistance
March 29, 2021After a calm and stable weekend, Bitcoin starts the new week following exciting news about Visa accepting payments in USDC.Over the past week, BTC recorded its lowest price in 2.5 weeks. This happened on Thursday.However, Bitcoin showed strength, finding support on top of the 50-day moving average line (marked pink as can be seen on the following chart) and maintaining this critical support area (around $51k) on a daily timeframe.Over the following days, the strong momentum continued as Bitcoin was trading primarily around $54-55K with candle wicks and daily closings above $55k. This tells us that there is a high demand below the $55k price area.Today, a short while before writing up this update, Bitcoin saw a huge price increase, which allowed the cryptocurrency to break above the
Read More »Bitcoin Skyrockets $5K In Hours, Trading Above $37K: Is The Correction Over? (BTC Price Analysis)
January 13, 2021After Bitcoin price recorded an all-time high last Friday at $42K, the primary cryptocurrency finally went down for the anticipated correction following the enormous 3-month rally.BTC price soared from $10,500 to $42,000 without going through any significant correction. During the previous parabolic bull-run of 2017, there were several corrections of 30% on average.The correction, which started on Sunday, saw a two-day plunge starting from the $41K level down to $30K at its lowest. Yesterday, the bulls tried to get control; however, most of the crypto Twitter community insisted that the correction is not over yet, and Bitcoin will likely retest below $30K.But, Bitcoin has its own plans. As of writing these lines, the primary cryptocurrency had seen a $5K price increase only today,
Read More »Bitcoin Just Recorded Another All-Time High: Is $25K Incoming? (BTC Price Analysis)
December 25, 2020As the world is celebrating Christmas, the primary cryptocurrency has its own private celebration.Two days ago, following Ripple’s SEC lawsuit, it seemed like Bitcoin would rather be testing its prior resistance turned support at $20K before continuing higher. Yesterday’s low was $22,700.However, Bitcoin has its own plans. The BTC price had increased $2,000 over the past two days, surpassing the previous all-time high from last Sunday set at $24,370 (Bitstamp). As of writing these lines, Bitcoin’s daily high, which is the new ATH, is $24,660, according to Bitstamp.Together with the new ATH, Bitcoin is also elevating its pace dominating the crypto markets. According to CoinMarketCap, the Bitcoin Dominance metric is set to 69%, which is the highest level recorded since January 2020.BTC
Read More »Today Bitcoin Can Break a Record From October 2013: BTC Price Analysis
December 20, 2020Yesterday, bitcoin’s price set another all-time high, this time at $24,200 (Bitstamp). Nine days ago, the daily low was $17,565. Since hitting that level, the primary cryptocurrency had gone through a fantastic journey of eight consecutive daily green candles.This is the longest period of consecutive daily green candles since June 2019’s bull run (8 candles). If today’s candle will close above $23,840, though a green candle, this will become the longest period since October 2013.Back then, Bitcoin had gone through ten green days where the price increased from $121 to $147.This fact can just emphasize how impressive this bull run is. Not many people expected a new all-time high even before 2021.BTC Support and Resistance Levels To WatchWhile bitcoin had entered a price discovery territory,
Read More »After BTC’s $2K Crash in Two Days, Will This Level Stop the Bloodbath? (Bitcoin Price Analysis)
December 9, 2020After last week’s excitement of a brand-new Bitcoin all-time high, the bulls forgot about the strong resistance at the key level of $20,000.According to the basics of technical analysis, just as in soccer, if you do not break above – you lose force and regress. This is exactly what we see over the past two days, following another failed attempt at the $19,500 – $20K zone.Since then, the Bitcoin price is going through a blood bath. The primary cryptocurrency had lost almost $2000 off its value over the 48 hours, as of writing these lines.BTC Support and Resistance Levels To WatchLooking at the following 4-hour chart, we can identify that since losing the critical support line at $18,700, Bitcoin’s price started plunging.As of now, the 4-hour chart’s MA-200 line (marked light green), along
Read More »Bitcoin Breaks $14K As US Elections Results Incoming: New 2020 High Or Bearish Double-Top? (Price Analysis)
November 4, 2020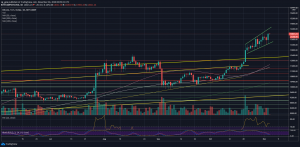
After breaking June 2019’s 15-month high just four days ago, Bitcoin is getting closer to the hot zone once again, seeking a new high since January 2018.
As of writing these lines, the first U.S. elections results are incoming shortly, and so far, Bitcoin is repeating its behavior from four years ago – surging 3% over the past 24 hours.
Currently, Bitcoin is trading around the $14K mark, after increasing over $400 in the past two hours alone.
Same Set-up As Of Elections 2016?
The U.S elections data is only starting to accumulate, and we already see what was expected – that the most volatile asset will justify its title.
As a reminder, in 2016, as Donald Trump got elected, the Bitcoin price surged while the Asian stock markets crashed. Now the situation is different;
Bitcoin Just Marked New 2020 High, But This Indicator Signals Correction Incoming (BTC Price Analysis)
October 25, 2020Starting by looking at the bigger picture, Bitcoin price had made a remarkable run since October began, gaining almost $3000 to its value.
Looking at the following long-term weekly chart, we can see this week’s greenish candle that will be closed later today. From a technical point of view, as long as the candle close price is above the $12,500 area (previous high) – we can safely say that BTC is on a healthy uptrend.
BTC/USD weekly. Chart by TradingViewThe Good and The Bad: New 2020 High but Bearish Divergence
Just a few hours ago, Bitcoin price recorded a new 2020 high close to $13,400 (on Binance Futures); however, the primary cryptocurrency could not hold there, and quickly slumped to $12,700 in a matter of one hour.
Looking at the shorter-term chart, the 4-hour, we
Bitcoin Price Analysis: Only $1K To 2020 High – Can BTC Reclaim $12,500 Soon?
October 10, 2020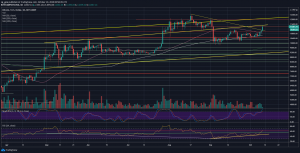
Bitcoin took a break from trading during the month of September, with relatively low volatility. As shown on the following 4-hour chart, the marked symmetrical triangle was basically the story of September: Started with a massive dump and a slow consolidation, since then, around $10,600.
As can be seen below, Thursday signaled a breakout – in favor of the Bulls. Since breaking the triangle at $10.8K, we saw a healthy consolidation and finally a breakout of the $11-11.2K area, which was the most recent high.
So far, as writing these lines, today’s daily candle marked $11,500 as the daily high. This is the first resistance to watch.
However, after three consecutive green days, Bitcoin might rest a bit. In case of a correction, the $11,000 – $11,2000 support would consider a
Bitcoin Still Holds Crucial Support At $10.5K, But Eyes On The White House (BTC Price Analysis)
October 4, 2020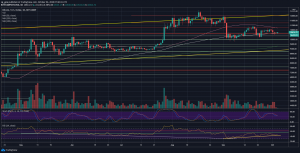
For the past month, BTC’s volatility had decreased compared to the previous months. The primary cryptocurrency had mainly traded inside a $1K range between $10,000 and $11,000.
Over the past week, Bitcoin reached the upper boundary of that range at $11K; however, the news coming from BitMEX charged by CFTC, along with President Trump’s hospitalization, sent Bitcoin to $10.4K last Thursday, which marked the weekly lowest price.
So far, this weekend had been slightly positive, as BTC reclaimed $10,500. The latter is a significant key level in the 2020 bull-market. $10,500 was the previous high for most of this year, and since breached, the level became a critical support line.
Despite the above, we do expect Bitcoin’s price to follow once Wall Street Futures get into play.
Failure To Break Above $11K Could Send Bitcoin To Monthly Lows: BTC Weekend Price Analysis
September 20, 2020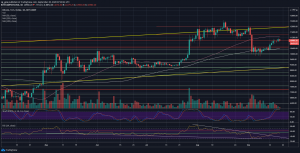
Even though the past week was positive for Bitcoin, the recent price action could raise some question marks for the bulls.
After starting the week below $10,500, Bitcoin was able to break above the old tough resistance and reach back to the $11,000 area.
However, while BTC gained 5% over the past week, most of the leading cryptocurrencies lost market cap. LINK at -18% and even Ethereum at -2% are only two examples. The trending DeFi tokens suffered even harder.
This tells us that some or at least part of BTC’s price gains were coming from the altcoins sell-off, and not from funds entering crypto – just like in a healthy bull market.
Double-Top On the 4-Hour?
Looking at the following 4-hour chart, we can see a double top formation around $11,100, which is textbook
Bitcoin Fights For $10,000: Is The Sell-Off Over? Updated BTC Price Analysis
September 5, 2020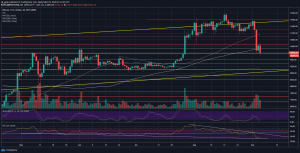
Just four days ago, one Bitcoin was trading for over $12,000. However, the cryptocurrency markets followed the global markets, and as of writing these lines Bitcoin fights to close the daily candle above $10,000.If the bad blood coming from the equity markets was not enough, then came the SUSHI sell-off by its creator. This led the defi tokens, mainly Ethereum, to severe drops, which did not skip Bitcoin as the primary cryptocurrency.As of now, Bitcoin marks $9850 as of today’s low, which is an intraday loss of $600. $9850 is also the lowest BTC price recorded since July 26, 2020.Key Support and Resistance For Bitcoin’s Short-termThe critical level here is $10,000. There is not much time left for the daily close, and Bitcoin will look to finish today and tomorrow’s candle (the weekly)
Read More »Bitcoin Facing Huge Resistance Expecting Major Price Move Soon (BTC Analysis)
August 30, 2020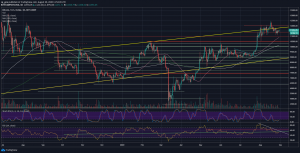
As another week comes to its end, let’s start from the bottom line: Bitcoin price ends the week exactly where it started it, hovering around the $10,600 mark.It wasn’t a remarkable week for Bitcoin, unlike the other cryptocurrencies, especially the DeFi ones, that saw triple-digit gains.Looking at the shorter timeframe, which is seen on the following 4-hour chart, Bitcoin had formed a double-bottom around $11,100. The latter is considered to be a bullish pattern unless the bottom is broken below.Shortly after, and for the past three days, Bitcoin was locked again inside the tight range between $11,400 and $11,600. As long as Bitcoin is stagnant, we can assume that the alt-season or the defi-season will continue higher.However, a declining amount of trading volume, along with the stability
Read More »Bitcoin Eyes $10,500 After Losing Crucial Support Line: BTC Price Analysis
August 22, 2020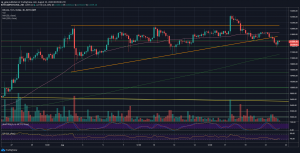
Bitcoin’s price had seen a four-day decline of over $1150, while the altcoins suffered even harder.Despite that Bitcoin is currently trading around the consolidation range from a week ago, we cannot ignore this week’s false breakout to $12,500. This turned to be a fake-out, and the bearishness that came out of this is clearly seen on the following days.As can be seen on the 4-hour chart, BTC was forming a bullish triangle ($12K as an upper angle), and even after the above mention false breakout, the formation was kept until yesterday.The triangle pattern got broken around $11700, sled down to the $11600 support, retested the triangle (this time as resistance): From there, the way to another leg down was quick.BTC/USD 4-hour chart. Source: TradingViewAs of writing these lines, Bitcoin found
Read More »Bitcoin Price Analysis: Failure To Break $12,100 Can Result In Massive Plunge
August 10, 2020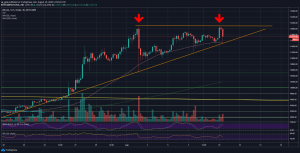
Bitcoin price continues to breathe the highs, as the coin is currently trading slightly below $12K, following a few days of consolidation between $11,600 and $11,800.However, over the recent hours, we saw Bitcoin’s second attempt to breach the $12,100 resistance, which is the 2020 high from a week ago (August 2nd).Despite a decent price surge, Bitcoin couldn’t hold more than several hours above the $12K prefix and tumbled to $11,500 before recovering slightly, as of writing these lines.The good news is that the dip to $11,500 quickly got bought by the Bulls, and the ascending trend-line on the 4-hour chart (the orange diagonal line) was kept steady.The bad news is that unless Bitcoin price would break $12,100, this can possibly result in a Double Top formation, which is textbook bearish
Read More »Bitcoin Plunged $700 Away From $12K, But There Is Good News (BTC Price Analysis)
August 8, 2020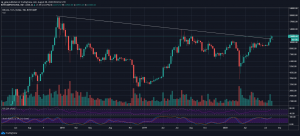
The past week was incredible for Bitcoin. During the previous weekend, the primary cryptocurrency saw its price touching above $12K and dumping to $10,500. A loss of $1600 in a matter of minutes.However, throughout the past week, the price slowly recovered towards the $12K mark once again. On Thursday, when it seemed that a new 2020 record is coming up, we warned here following a second failure to break the $12,000 resistance mark.Yesterday Bitcoin plunged to as low as $11,200 (prior resistance turned support) on Bitstamp before the bulls bought the dip, and we’re back at the familiar price area of $11,500 – $11,600 (as of now).BTC/USD weekly chart. Source: TradingViewBut There Is Good News: Key Levels To WatchA bull-run with no corrections – which is a parabolic run – is likely to end in
Read More »After Bitcoin’s $1500 Immediate Plunge, Is The 2020 Bull-Run Over? BTC Price Analysis
August 2, 2020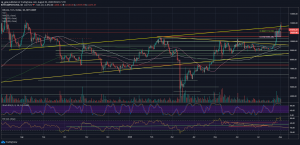
The past ten days, which were the last days of July, were a blessing for the price of Bitcoin.Right after breaking out above the blue-marked trend line at $9200 on July 21st, Bitcoin started to fire its engines, and yesterday – following ten magic days – BTC price recorded a fresh 2020 high above $12,100. An incredible 31% increase.And then it came: Immediately after recording the new high, we got the first significant correction since the 2020 parabolic run had started. And what a correction it was.Only yesterday, we warned here:“keep in mind that when possible price corrections come – it will hurt. Also, the indicators are overextended. The daily RSI is at its highest level since June 2019.”Back To The $10,500 Prior HighAnd it did hurt. In a matter of minutes, billions of long positions
Read More »Bitcoin Just Broke To New 2020 High: Those Are The Next Price Targets To Watch
August 1, 2020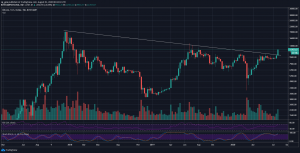
Today is the first day of August, and this means that a few hours ago, the monthly candle of July closed.A surprising fact is that only once in its history, Bitcoin had recorded a monthly close higher than yesterday’s – and that was during December 2017 – the peak of the bubble.After two months of dull price action, while Bitcoin was mostly traded at around $9200, there came the breakout. And what a breakout it was.Looking at the following weekly chart, we can clearly see that the current bullish move started upon breaking $9200, and most importantly, was breaking above the descending trend-line. Yes, the line that begun forming during December 2017 – Bitcoin’s all-time high near $20,000.There are still two days to this impressive weekly candle; however, as of now, it is hard to believe
Read More »Bitcoin Price Analysis: BTC Now At Crucial Resistance – $9,200 Or $10K Next?
July 25, 2020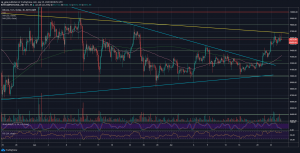
Quick recap: after almost a month of dull price action around the $9200 mark, Bitcoin finally managed to break out.Last Tuesday, we saw a mini-rally in BTC, while the price went up to the next marked resistance at the descending yellow line (shown on both charts below), which is also the $9650 resistance – mentioned in our previous price analysis from the past days.Two great signs for the crypto ecosystem following the mini-rally: first, the total crypto market cap went up together with Bitcoin – new money is entering the ecosystem, and not rotating between Bitcoin and other cryptocurrencies.The other breakthrough is the fact that this rally was taking place while the global markets were tumbling during Thursday and Friday trading days. Decoupling? At least now, it seems so.What we expect
Read More »Bitcoin Price Analysis: 3 Reasons Why A Wild BTC Move Is Anticipated Very Soon
July 12, 2020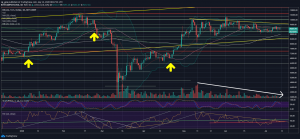
Unlike Bitcoin’s stability, the altcoins are celebrating in their own party. Bitcoin dominance recently reached its yearly-low areas after dropping below 62.5% over the past few hours.Wild Move Upcoming?From a technical point of view, Bitcoin’s stability period like this usually ends with a wild move. The indicator we mainly use to measure volatility is the Bollinger Bands.Those are the three lines following the price action’s candlesticks on the following daily chart. Whenever the upper and lower bands are close to each other, there is likely a huge price move upcoming.The last occurrences are marked by yellow arrows. As can be seen, since 2020 had begun, three times the bands were tight, although not as tight as today. In two occurrences the following move was to the bullish side, while
Read More »Bitcoin Price Analysis: BTC Anticipates Huge Upcoming Move To End This Uncommon Stability
July 5, 2020
For the past ten days, the Bitcoin price was trading mostly inside a $200 range between $9000 and $9200.This behavior is very uncommon to a volatile asset such as Bitcoin. Some technical signs point on an end to this saga very soon, probably as the new week starts.Bitcoin Recent Price ActionAs can be seen on the following 4-hour chart, Bitcoin is trading inside a symmetrical triangle pattern.While yesterday BTC was about to break it down from its lowest angle, Bitcoin found support and produced a quick $150 price movement. Guess where? Accurately the top of the mentioned range at $9200.As can be seen below, this candle ended with a massive wick to the upside, no breakout, and as of writing theses lines, Bitcoin price is testing the same lower angle (blue) of the triangle once again.The
Read More »Bitcoin Price Analysis: BTC Bears Eye $8,600 As RSI Divergence Grows
July 1, 2020
On the 1D BTC/USD chart, we can see that the leading crypto-asset remains range-bound between the daily $8,600 and $10,000 levels.Rumors earlier in the week regarding PayPal possibly adding support for Bitcoin and other cryptocurrencies on its platform, sparked a small rally but failed to fuel a much-needed breakout above a key resistance level at $9,780.The pump was subsequently followed by a sharp sell-off below the previous weekly open at $9,300 (white line on the following chart), which will now likely act as a difficult ceiling for bullish traders to break going into the rest of this week.This will be a vital level to watch in the short-term and should provide a good indication of how confident buyers are in the market right now.BTC/USDT Binance Daily ChartBTC/USDT Binance 4-Hour
Read More »Bitcoin Price Analysis: The Worrying Sign That Can Send BTC To New Lows Very Soon
June 30, 2020
During the past two days, the Bitcoin price was trading under a tight range between $9000 and $9200.This untypical stability by Bitcoin is just showing how indecisive the primary cryptocurrency is. What is for sure is that a wild price move is likely to take place over the next few days.Following the Saturday’s price plunge, reaching out to a new 30-days low, we expected a price pullback. On our recent price analysis, we predicted such pull-back, telling by the oversold RSI levels and the declining number of sellers.The pull-back reached approximately $9200, which was more than $400 correction since Saturday’s low. Not surprisingly, the $9200 is also the 38.2% Fib retracement level of the past week’s drop.This level now becomes the most critical level to watch for the short-term of
Read More »Bitcoin Price Analysis: Crucial Battle Over $9000 – Here Are The Good and The Bad News
June 28, 2020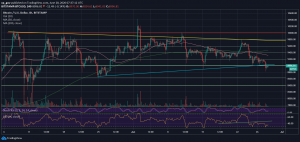
So far, this weekend hadn’t been the best for the price of Bitcoin. The primary cryptocurrency recorded its lowest level over the last 30 days.Trading for $9800 just six days ago, Bitcoin dropped as of yesterday to nearly $8800 on most leading exchanges.The Good and The Bad NewsAs of writing these lines, Bitcoin is trading around the $9K mark, mostly below it. From a technical point of view, a strong support level that got broken down immediately becomes a huge resistance level.As can be seen on the following 4-hour chart, once Bitcoin broke the critical blue ascending trend-line as support, it is now retesting it as resistance, and, as expected, it is an easy battle for BTC.If Bitcoin fails here, and cannot regain possession above the $9K, we can expect a further drop to new monthly lows.
Read More »Bloody Weekend: Bitcoin Price Tumbles Below $9K – Recording $1000 Loss In 5-Days
June 27, 2020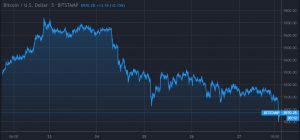
The crypto investors suffer from hard days recently, as the primary cryptocurrency tumbled approximately $1000 over the past five days.After a long battle to maintain the $9K mark, Bitcoin finally lost, and immediately plunged to $8816 on Binance Futures exchange, which is the current daily low, as of writing these lines.Aside from a quick glitch on June 15, the last time the price of Bitcoin was trading below the $9000 mark was exactly a month ago, on May 27, 2020.Wall Street NightmaresYesterday, the USA recorded its highest daily number of new COVID19 cases. The global fear from a second wave had sent the markets for a deep dive on Friday.U.S. major indices finished the Friday trading session with an average decline of 2.5%, while Facebook (FB) stock dropped more than 8%. Unfortunately
Read More »Bitcoin Price Analysis: Will The 2015 Historic Support Line Save BTC From a Crash To $7000 – $8000?
June 27, 2020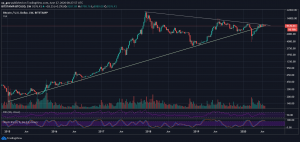
Only five days ago, the price of Bitcoin touched $9800, followed by another failure to break up the critical descending trend-line (marked yellow on the following daily chart).Since then, the primary cryptocurrency had been correlating with the plunging global markets, and as of writing these lines, Bitcoin is trading slightly above $9000.The Micro and Macro LevelIf we look at the micro-level, which is the following 4-hour chart, we can see that Bitcoin so-far holds the supporting blue line. As mentioned here two days ago, the $8900 – $9000 support level is the most crucial for the short term.In case of a break-down, the bullish higher-lows trajectory will be invalidated.From the macro level, the weekly candle (as can be seen on the following chart) touched the long-term descending
Read More »Bitcoin Price Analysis: BTC’s Plunge To $9000 On Markets Collapse – Now This Level Becomes The Most Critical
June 25, 2020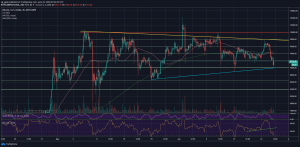
Two days ago, when everyone was bullish watching Bitcoin’s astonishing move breaking above the $9400 towards the $9800 in a matter of hours, we mentioned the importance of the $9800 level.That level created another touch in the descending trend-line, which is marked yellow on both charts below. This was the ninth (!) attempt to break that tough resistance. Guess what? Nine attempts – zero success (aside from the fake-out on June 1st).When you don’t score, the other team will. And when Bitcoin did not break, the way back down was just a matter of time.Global Markets’ Wednesday CollapseYes, we are back in the days when Bitcoin price and the markets go side by side. No decoupling at this moment.Yesterday, Wall Street’s major indices crashed 2-3%, while Bitcoin crashed from the $9600 region,
Read More »Bitcoin Price Analysis: Now Comes The Line BTC Had Failed To Break 9 Times Already
June 23, 2020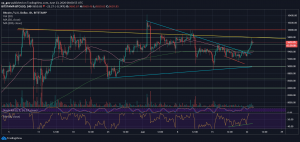
A quick recap: over the past week, we mentioned the dull static price action of Bitcoin between the tight range of $9200 to $9500, forming a 30-days long symmetrical triangle.As we anticipated a breakout of the triangle – that will be followed by a massive price move – yesterday it did happen. Bitcoin price broke the triangle’s upper boundary, along with the $9400 level (along with the MA-50 line), surpassing the next resistance at $9600 – touching $9800 along with the yellow-marked descending line on both attached charts.At this point and as of writing these lines, Bitcoin was not able to breach the critical yellow line while confirming old resistance at $9600 as new support.What’s Next For BTC?As can be seen, the $9600 becomes the new baseline for Bitcoin, and it will look to maintain it
Read More »Bitcoin Price Analysis: Decision Time Facing Now Huge Resistance Area – Hidden Divergence?
June 21, 2020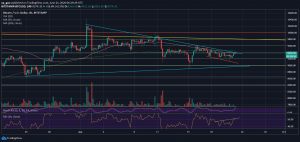
Over the past two days, Bitcoin (BTC) price maintained the same $9200 – $9500 trading area that followed its price action for quite some time.Bitcoin is known for its volatility and does not tend to stay at one place for long, or trade at a tight range of 3-4% for days already.As we can see on the following 4-hour chart, the Bitcoin price is forming a giant symmetrical triangle for almost a month. This triangle apex is expected sometime in the next week; however, a breakout can occur at any time, usually before the apex itself.Anyways, a decision has soon to be made, also judging by the declining amount of trading volume.What’s Next?Symmetrical triangles have chances to break either way. However, we need to keep in mind that Bitcoin is now facing the top angle of the triangle as
Read More »