Quick recap: after almost a month of dull price action around the 00 mark, Bitcoin finally managed to break out.Last Tuesday, we saw a mini-rally in BTC, while the price went up to the next marked resistance at the descending yellow line (shown on both charts below), which is also the 50 resistance – mentioned in our previous price analysis from the past days.Two great signs for the crypto ecosystem following the mini-rally: first, the total crypto market cap went up together with Bitcoin – new money is entering the ecosystem, and not rotating between Bitcoin and other cryptocurrencies.The other breakthrough is the fact that this rally was taking place while the global markets were tumbling during Thursday and Friday trading days. Decoupling? At least now, it seems so.What we expect
Topics:
Yuval Gov considers the following as important: Bitcoin (BTC) Price, BTC Analysis, btcusd, btcusdt
This could be interesting, too:
Chayanika Deka writes XRP, SOL, and ADA Inclusion in US Crypto Reserve Pushes Traders on Edge
Chayanika Deka writes Why Arthur Hayes Is Bullish on Bitcoin Under Trump’s Economic Strategy
Mandy Williams writes Why the Bitcoin Market Is Stuck—and the Key Metric That Could Change It: CryptoQuant CEO
Wayne Jones writes Metaplanet Acquires 156 BTC, Bringing Total Holdings to 2,391
Quick recap: after almost a month of dull price action around the $9200 mark, Bitcoin finally managed to break out.
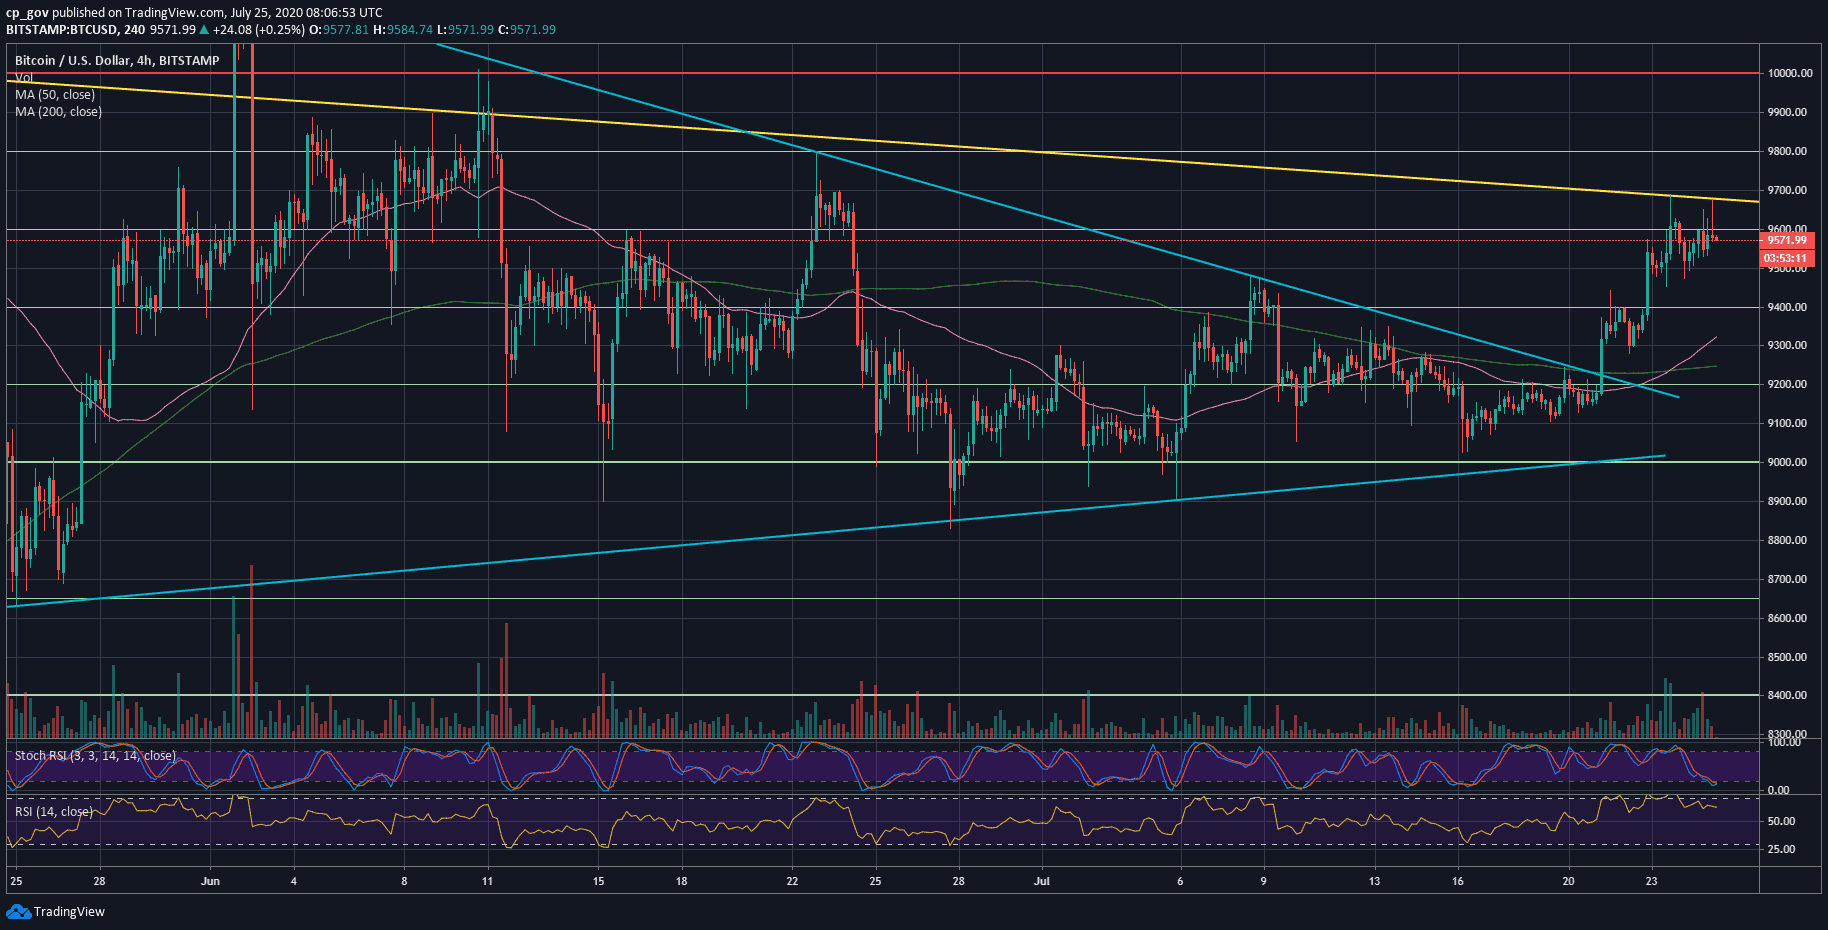
Last Tuesday, we saw a mini-rally in BTC, while the price went up to the next marked resistance at the descending yellow line (shown on both charts below), which is also the $9650 resistance – mentioned in our previous price analysis from the past days.
Two great signs for the crypto ecosystem following the mini-rally: first, the total crypto market cap went up together with Bitcoin – new money is entering the ecosystem, and not rotating between Bitcoin and other cryptocurrencies.
The other breakthrough is the fact that this rally was taking place while the global markets were tumbling during Thursday and Friday trading days. Decoupling? At least now, it seems so.
What we expect from here
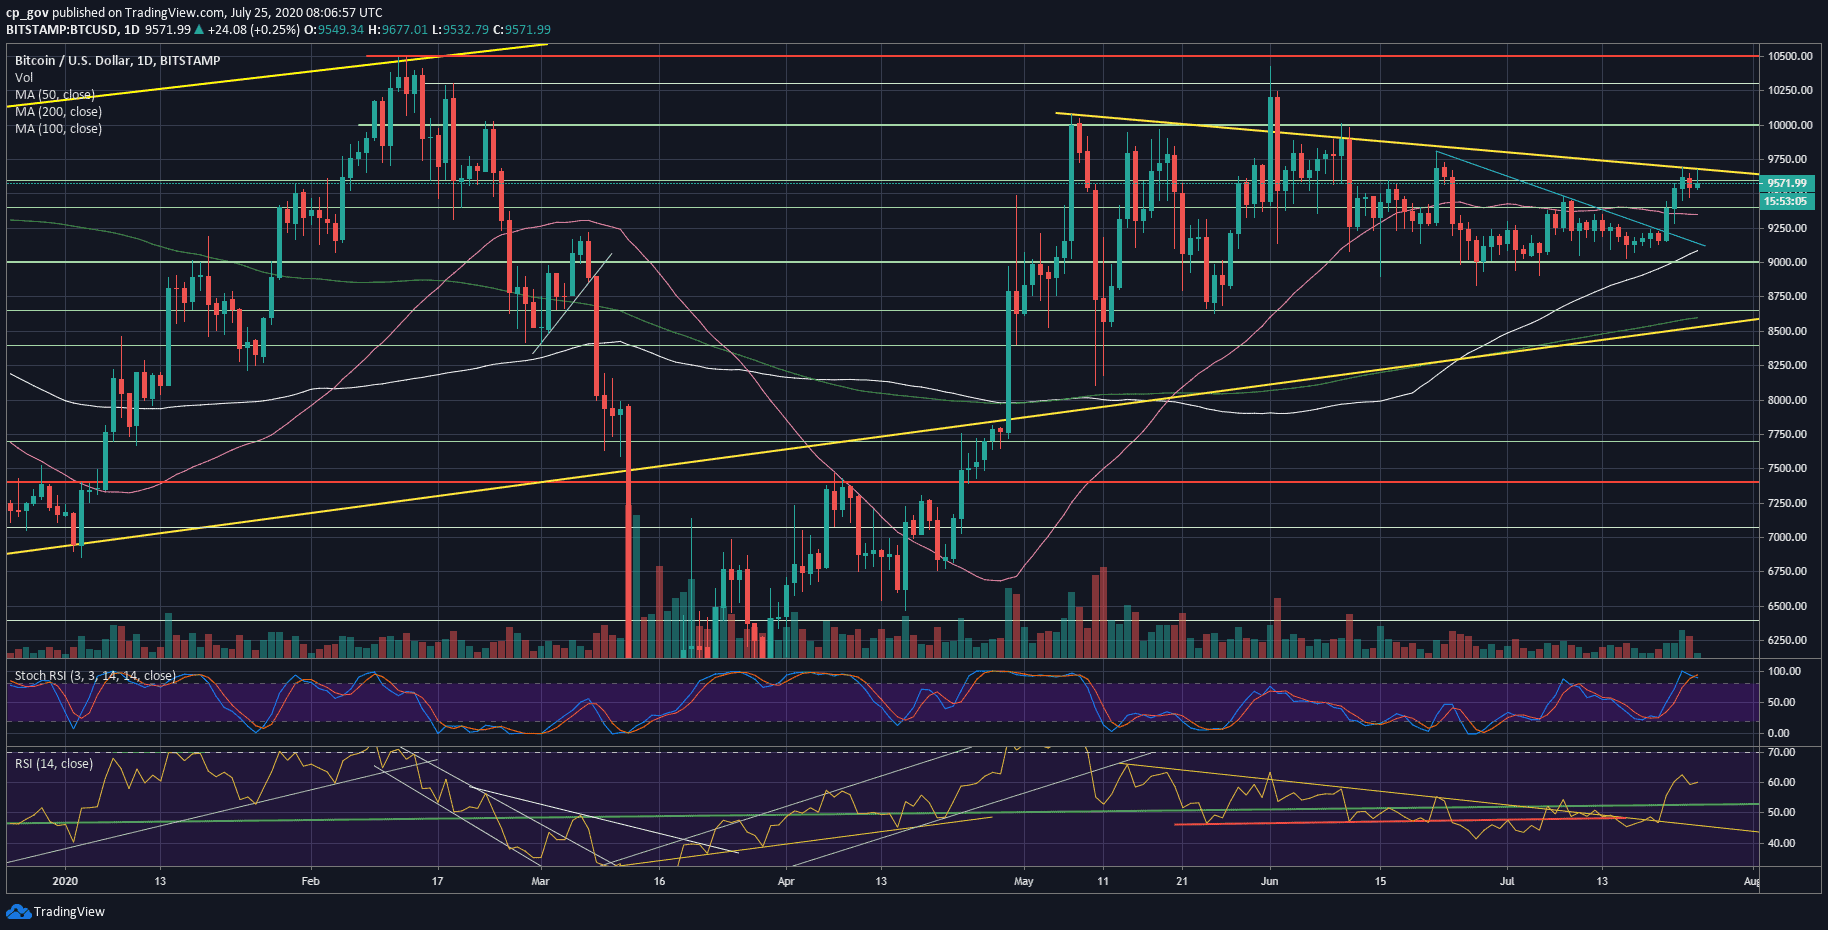
As of writing these lines, Bitcoin is struggling around the $9600 resistance, along with the marked descending yellow line.
In case of a breakout – we are likely to witness Bitcoin retesting $9800 and possibly $10,000 in the next few days (if not later this weekend).
At the macro level, $10,500 – which is the 2020 high – is still the major resistance area Bitcoin will have to breach for a much bigger bull-run.
However, this current resistance shouldn’t be easy for Bitcoin, after two failed attempts to break-up the yellow line just the past three days.
In addition, the Stochastic RSI oscillator had produced a bearish cross-over at the overbought territory. This might be a sign that a correction is needed. Besides, the trading volume is still not significant, extremely far from May and June’s highest trading days.
In case a correction takes place, the first level of support lies at $9500, followed by the 50-days moving average line (pink line) currently around $9350. The latter would be a reasonable correction. In case of breaking down the $9200 mark – and the mid-term might turn bearish.
Total Market Cap: $289 billion
Bitcoin Market Cap: $176.6 billion
BTC Dominance Index: 61%
*Data by CoinGecko
BTC/USD BitStamp 4-Hour Chart
BTC/USD BitStamp 1-Day Chart