After breaking June 2019’s 15-month high just four days ago, Bitcoin is getting closer to the hot zone once again, seeking a new high since January 2018. As of writing these lines, the first U.S. elections results are incoming shortly, and so far, Bitcoin is repeating its behavior from four years ago – surging 3% over the past 24 hours. Currently, Bitcoin is trading around the K mark, after increasing over 0 in the past two hours alone. Same Set-up As Of Elections 2016? The U.S elections data is only starting to accumulate, and we already see what was expected – that the most volatile asset will justify its title. As a reminder, in 2016, as Donald Trump got elected, the Bitcoin price surged while the Asian stock markets crashed. Now the situation is different;
Topics:
Yuval Gov considers the following as important: Bitcoin (BTC) Price, BTC Analysis, BTCEUR, BTCGBP, btcusd, btcusdt
This could be interesting, too:
Chayanika Deka writes XRP, SOL, and ADA Inclusion in US Crypto Reserve Pushes Traders on Edge
Chayanika Deka writes Why Arthur Hayes Is Bullish on Bitcoin Under Trump’s Economic Strategy
Mandy Williams writes Why the Bitcoin Market Is Stuck—and the Key Metric That Could Change It: CryptoQuant CEO
Wayne Jones writes Metaplanet Acquires 156 BTC, Bringing Total Holdings to 2,391
After breaking June 2019’s 15-month high just four days ago, Bitcoin is getting closer to the hot zone once again, seeking a new high since January 2018.
As of writing these lines, the first U.S. elections results are incoming shortly, and so far, Bitcoin is repeating its behavior from four years ago – surging 3% over the past 24 hours.
Currently, Bitcoin is trading around the $14K mark, after increasing over $400 in the past two hours alone.
Same Set-up As Of Elections 2016?
The U.S elections data is only starting to accumulate, and we already see what was expected – that the most volatile asset will justify its title.
As a reminder, in 2016, as Donald Trump got elected, the Bitcoin price surged while the Asian stock markets crashed. Now the situation is different; however, volatility to both sides can be expected.
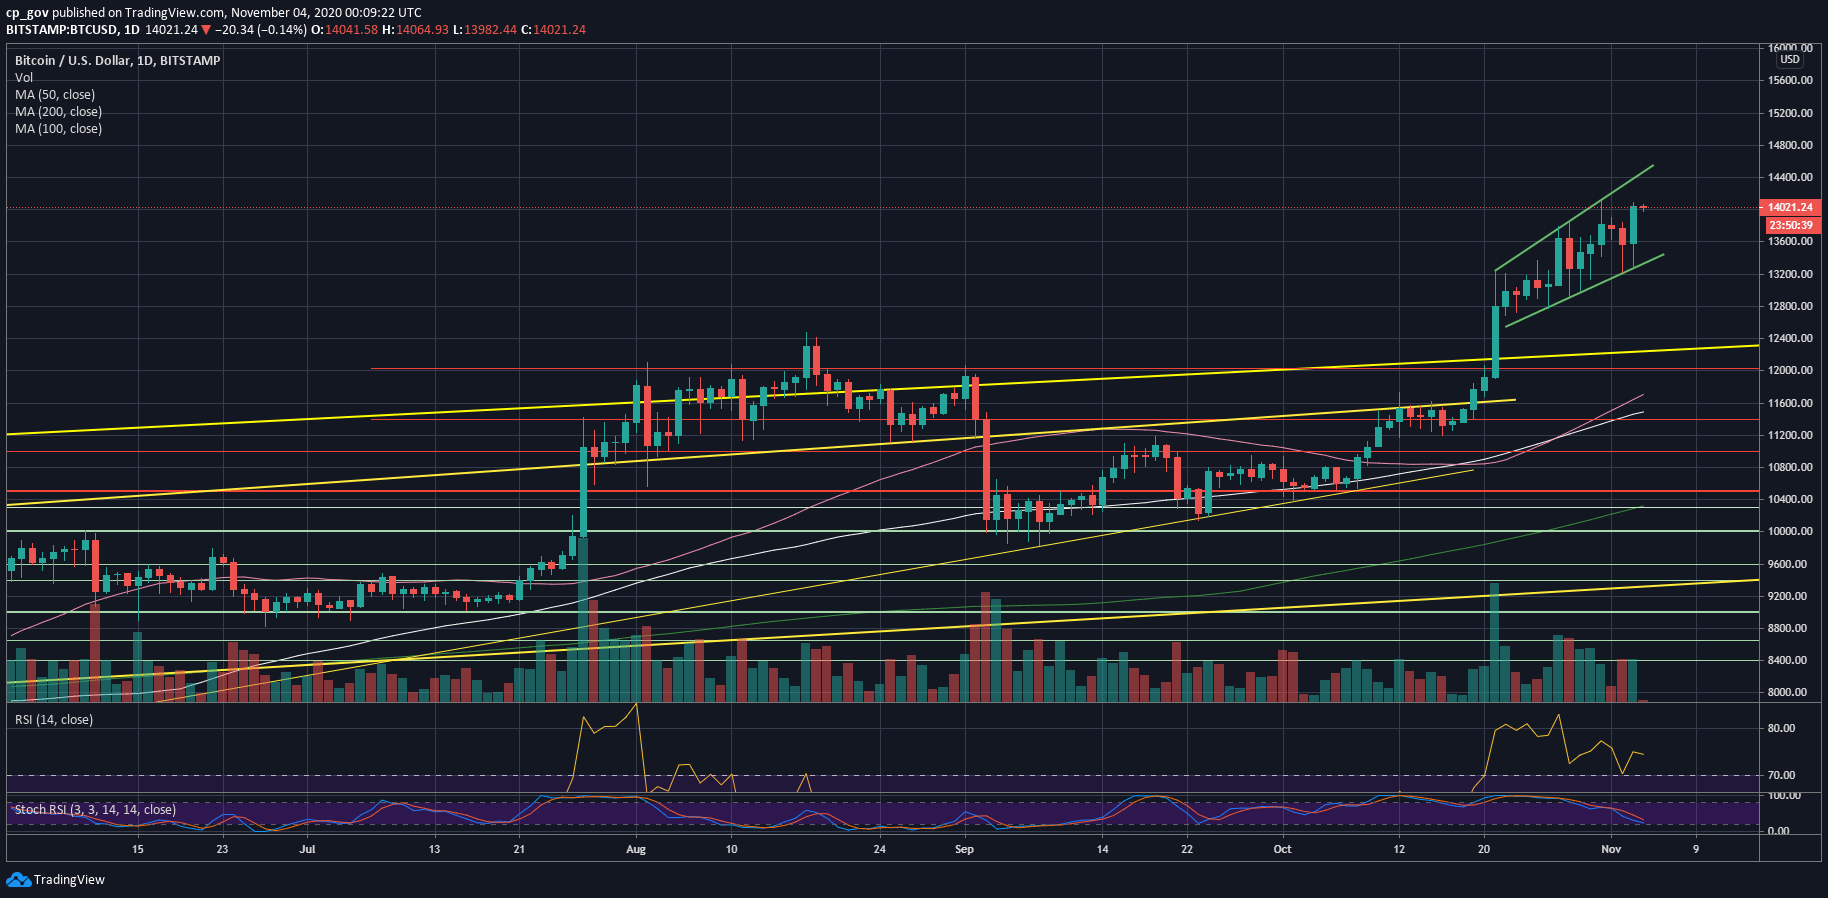
From the bullish side, we can see on the following daily chart that almost every candle over the past week is carrying a huge ‘wick.’ This means that the buyers are buying every single price dip.
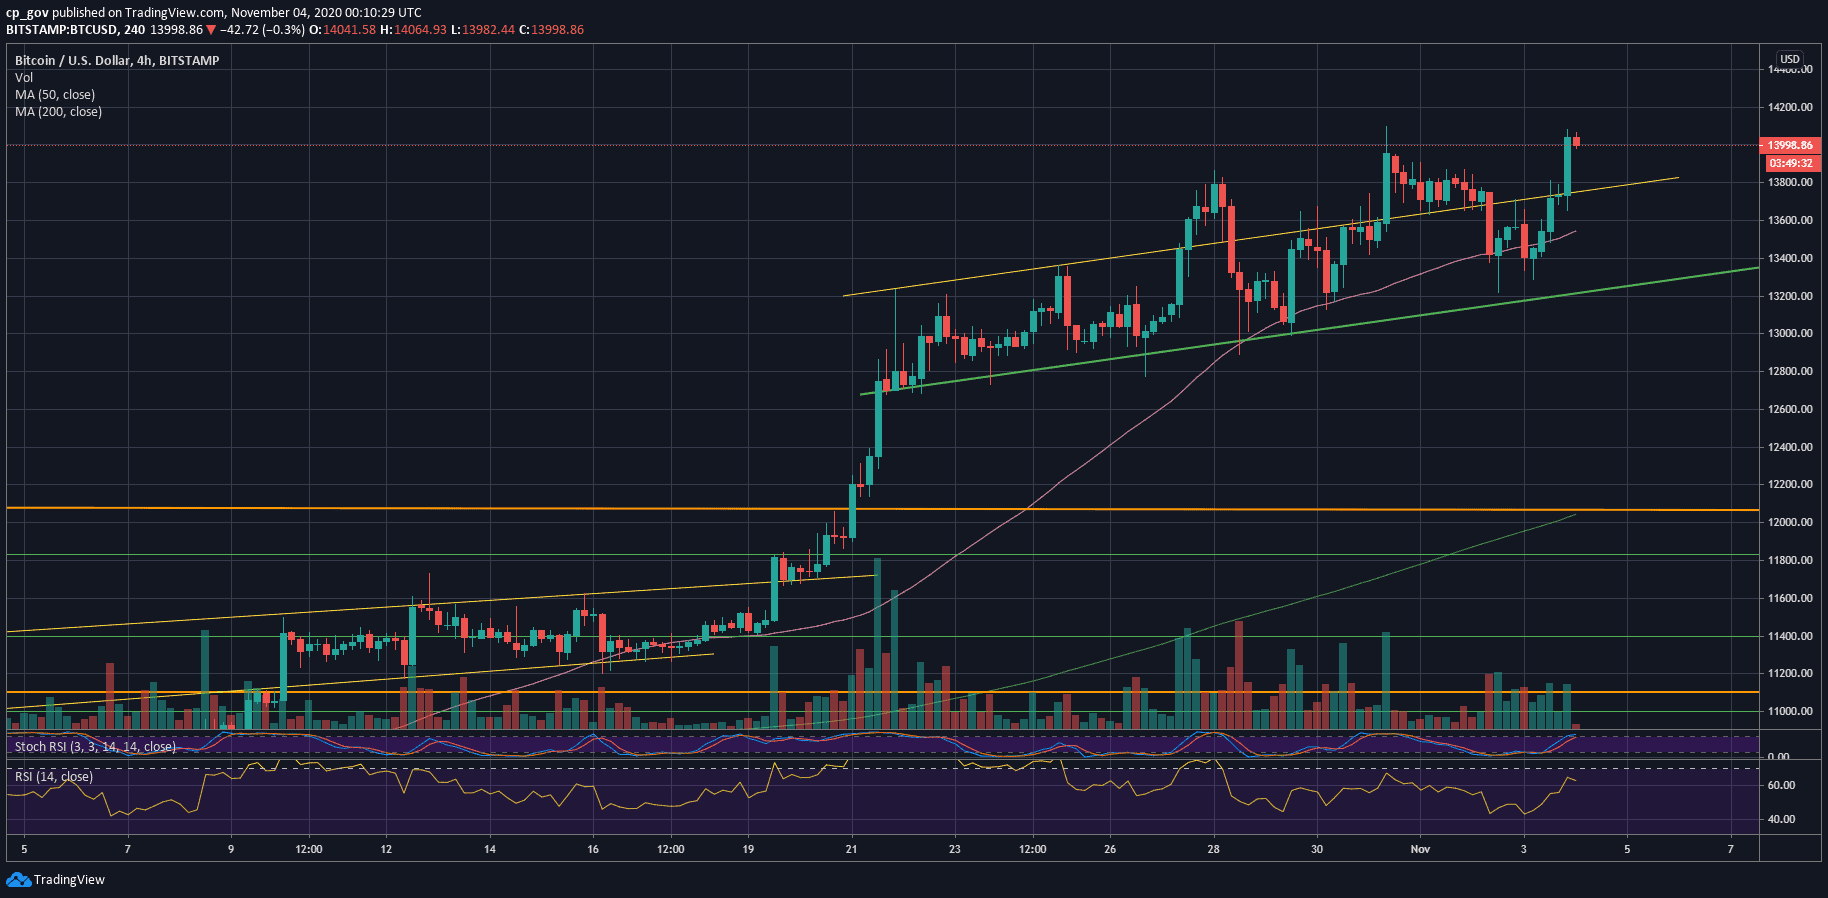
On the other hand, the RSI indicator is still showing bearish divergence on the daily timeframe. In the following shorter-term chart (the 4-hour), we can see that the divergence is slowly invalidating.
Besides, the $13,800 – $14,000 zone is the last significant barrier of the sellers. This contains the previous June 2019 high ($13,870) and the monthly close from the 2017 bubble peak – December 2017 and January 2018. So far, Bitcoin got rejected once (Saturday).
BTC Support and Resistance Levels To Watch
The first resistance is the current level between $14,000 and $14,100. This is the previous 1000-day high that was set last Saturday.
In case Bitcoin breaks up, there is not much resistance above until the all-time high, since Bitcoin was trading above that range for only numerous days.
If we look for resistance areas, we can see that $14,500 can be the first level of resistance (the marked ascending trend-line), before the psychological level at $15,000.
From the bearish side, failure to break the $14,100 high can set a double-top bearish formation. The first major support now lies around $13,800 – $13,870 (previous resistance), followed by the marked lower ascending trend-line (~$13,350). Further below lies the $12,800 support area.
Total Market Cap: $409 billion
Bitcoin Market Cap: $259 billion
BTC Dominance Index: 63.4%
*Data by CoinGecko


