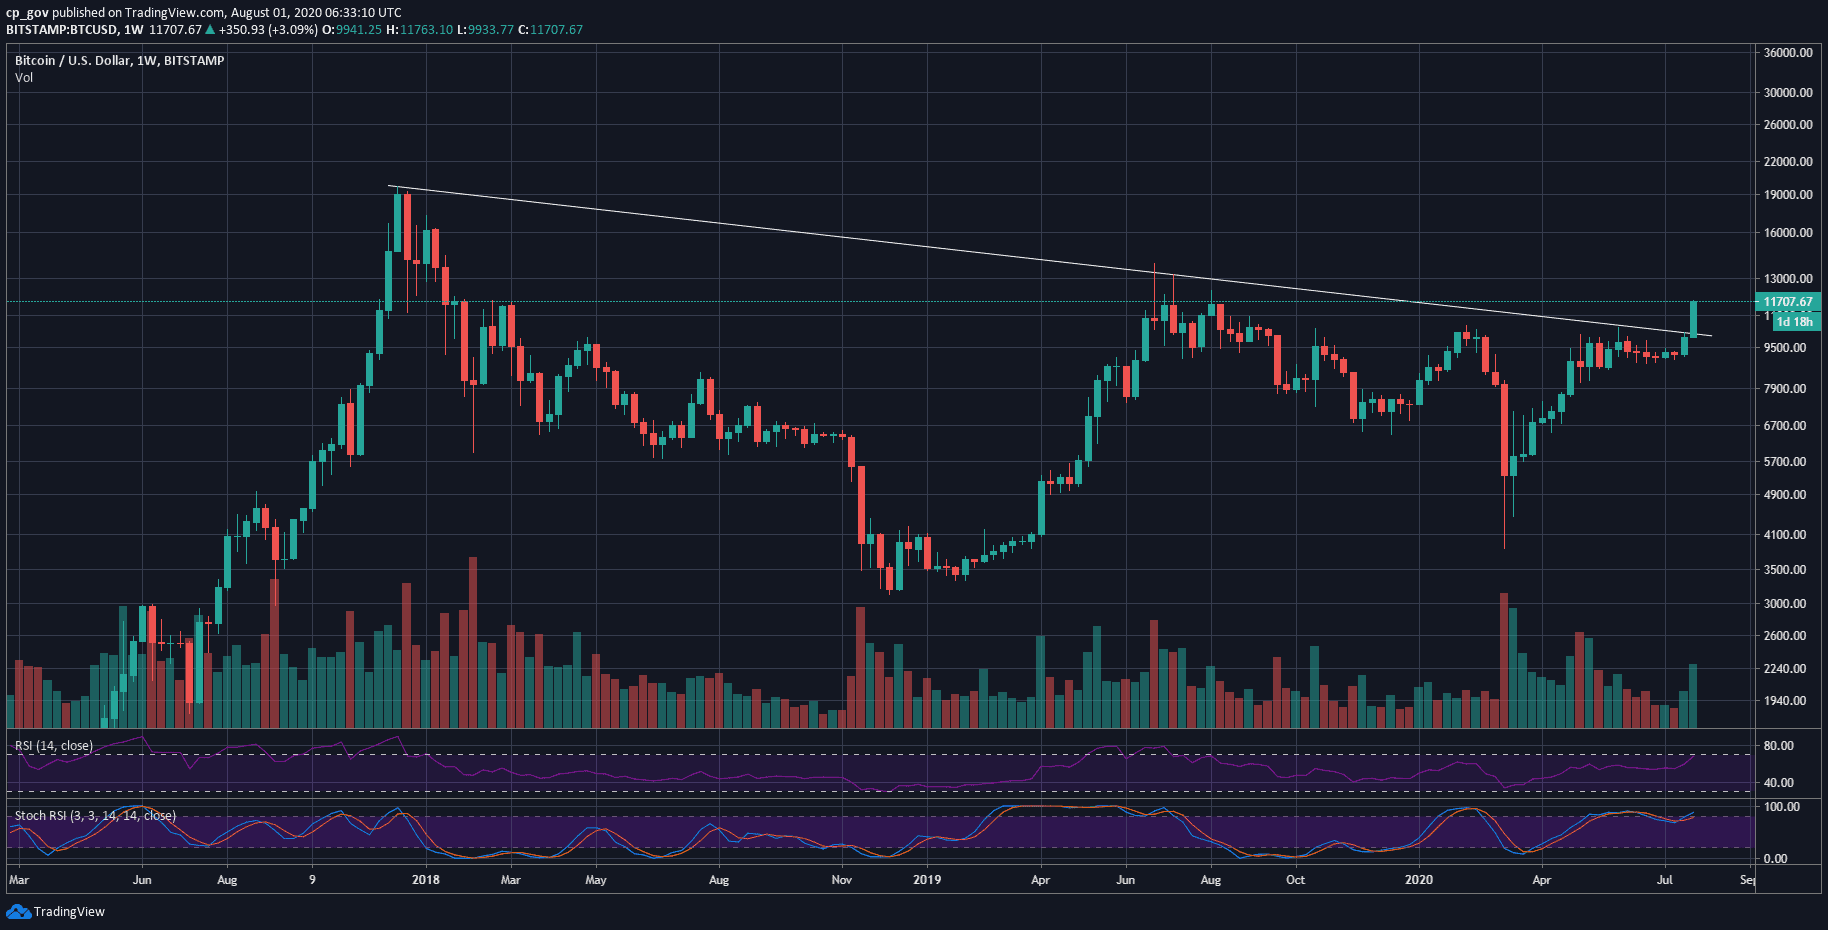
Today is the first day of August, and this means that a few hours ago, the monthly candle of July closed.A surprising fact is that only once in its history, Bitcoin had recorded a monthly close higher than yesterday’s – and that was during December 2017 – the peak of the bubble.After two months of dull price action, while Bitcoin was mostly traded at around 00, there came the breakout. And what a breakout it was.Looking at the following weekly chart, we can clearly see that the current bullish move started upon breaking 00, and most importantly, was breaking above the descending trend-line. Yes, the line that begun forming during December 2017 – Bitcoin’s all-time high near ,000.There are still two days to this impressive weekly candle; however, as of now, it is hard to believe
Topics:
Yuval Gov considers the following as important: AA News, Bitcoin (BTC) Price, BTC Analysis, BTCEUR, BTCGBP, btcusd, btcusdt
This could be interesting, too:
Chayanika Deka writes Yuga Labs Secures Major Win as SEC Closes Investigation Without Charges
Andrew Throuvalas writes Bitcoin Soars Back To ,000 After BlackRock CEO Says “Buy The Dip”
Chayanika Deka writes XRP, SOL, and ADA Inclusion in US Crypto Reserve Pushes Traders on Edge
Chayanika Deka writes Why Arthur Hayes Is Bullish on Bitcoin Under Trump’s Economic Strategy
Today is the first day of August, and this means that a few hours ago, the monthly candle of July closed.
A surprising fact is that only once in its history, Bitcoin had recorded a monthly close higher than yesterday’s – and that was during December 2017 – the peak of the bubble.
After two months of dull price action, while Bitcoin was mostly traded at around $9200, there came the breakout. And what a breakout it was.
Looking at the following weekly chart, we can clearly see that the current bullish move started upon breaking $9200, and most importantly, was breaking above the descending trend-line. Yes, the line that begun forming during December 2017 – Bitcoin’s all-time high near $20,000.
There are still two days to this impressive weekly candle; however, as of now, it is hard to believe that the candle will close below the weekly line (around $10,200).
The state of Bitcoin is now parabolic. Remember the past two times Bitcoin entered such mode: November 2017 and June 2019. In a matter of 3-4, Bitcoin doubled and tripled its value. So, things can get happen fast this time as well.
However, keep in mind that when possible price corrections come – it will hurt. Also, the indicators are overextended. The daily RSI is at its highest level since June 2019.
Bitcoin’s Next Price Targets
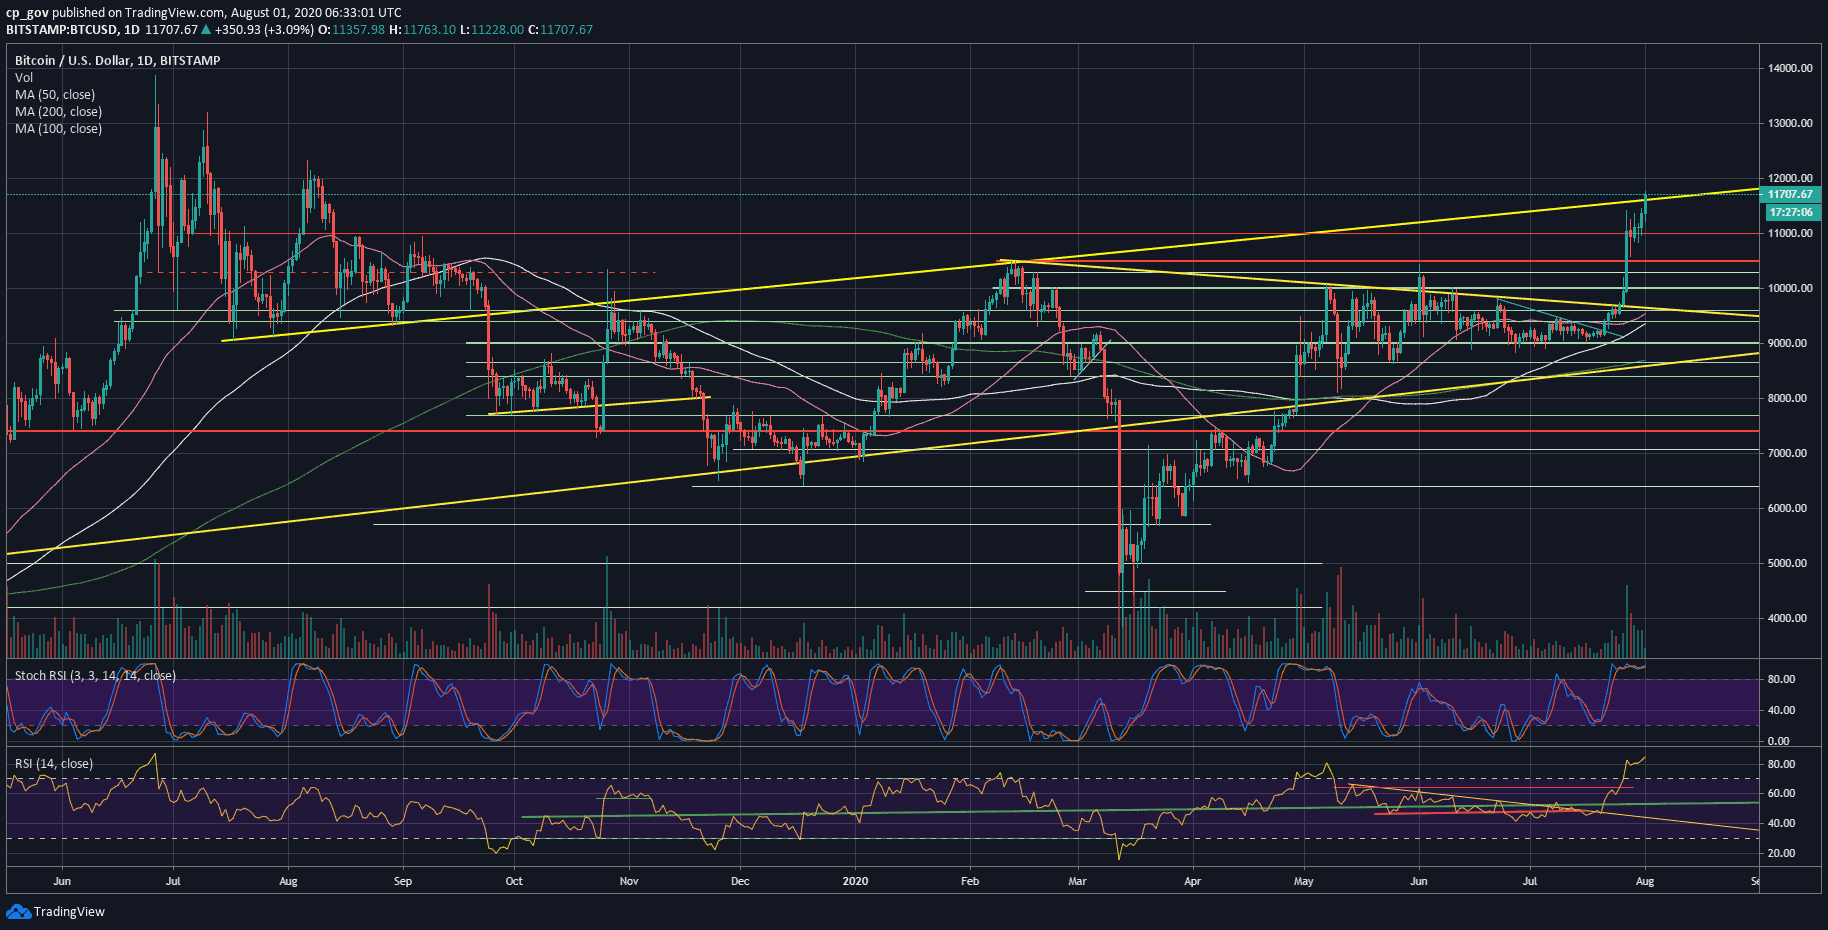
Looking at the following daily chart, we can see Bitcoin currently surpassing a critical ascending trend-line together with the horizontal resistance at $11,600.
A daily close above it will fuel the continuation of this move towards $11,800 (resistance from March 2018) and the psychological level of $12,000.
Further above lies $12,300, which was the highest level reached in August 2019 exactly a year ago. The latter is followed by the $12,500 resistance.
In case of a correction, the latest resistance levels will likely serve as support. The first level from below is $11,600, followed by $11,400 (prior high). Further below lies $11,00 and $10,800.
Total Market Cap: $345 billion
Bitcoin Market Cap: $215 billion
BTC Dominance Index: 62.5%
*Data by CoinGecko
BTC/USD BitStamp 1-Day Chart