Bitcoin price continues to breathe the highs, as the coin is currently trading slightly below K, following a few days of consolidation between ,600 and ,800.However, over the recent hours, we saw Bitcoin’s second attempt to breach the ,100 resistance, which is the 2020 high from a week ago (August 2nd).Despite a decent price surge, Bitcoin couldn’t hold more than several hours above the K prefix and tumbled to ,500 before recovering slightly, as of writing these lines.The good news is that the dip to ,500 quickly got bought by the Bulls, and the ascending trend-line on the 4-hour chart (the orange diagonal line) was kept steady.The bad news is that unless Bitcoin price would break ,100, this can possibly result in a Double Top formation, which is textbook bearish
Topics:
Yuval Gov considers the following as important: Bitcoin (BTC) Price, BTC Analysis, BTCEUR, BTCGBP, btcusd, btcusdt
This could be interesting, too:
Chayanika Deka writes XRP, SOL, and ADA Inclusion in US Crypto Reserve Pushes Traders on Edge
Chayanika Deka writes Why Arthur Hayes Is Bullish on Bitcoin Under Trump’s Economic Strategy
Mandy Williams writes Why the Bitcoin Market Is Stuck—and the Key Metric That Could Change It: CryptoQuant CEO
Wayne Jones writes Metaplanet Acquires 156 BTC, Bringing Total Holdings to 2,391
Bitcoin price continues to breathe the highs, as the coin is currently trading slightly below $12K, following a few days of consolidation between $11,600 and $11,800.
However, over the recent hours, we saw Bitcoin’s second attempt to breach the $12,100 resistance, which is the 2020 high from a week ago (August 2nd).
Despite a decent price surge, Bitcoin couldn’t hold more than several hours above the $12K prefix and tumbled to $11,500 before recovering slightly, as of writing these lines.
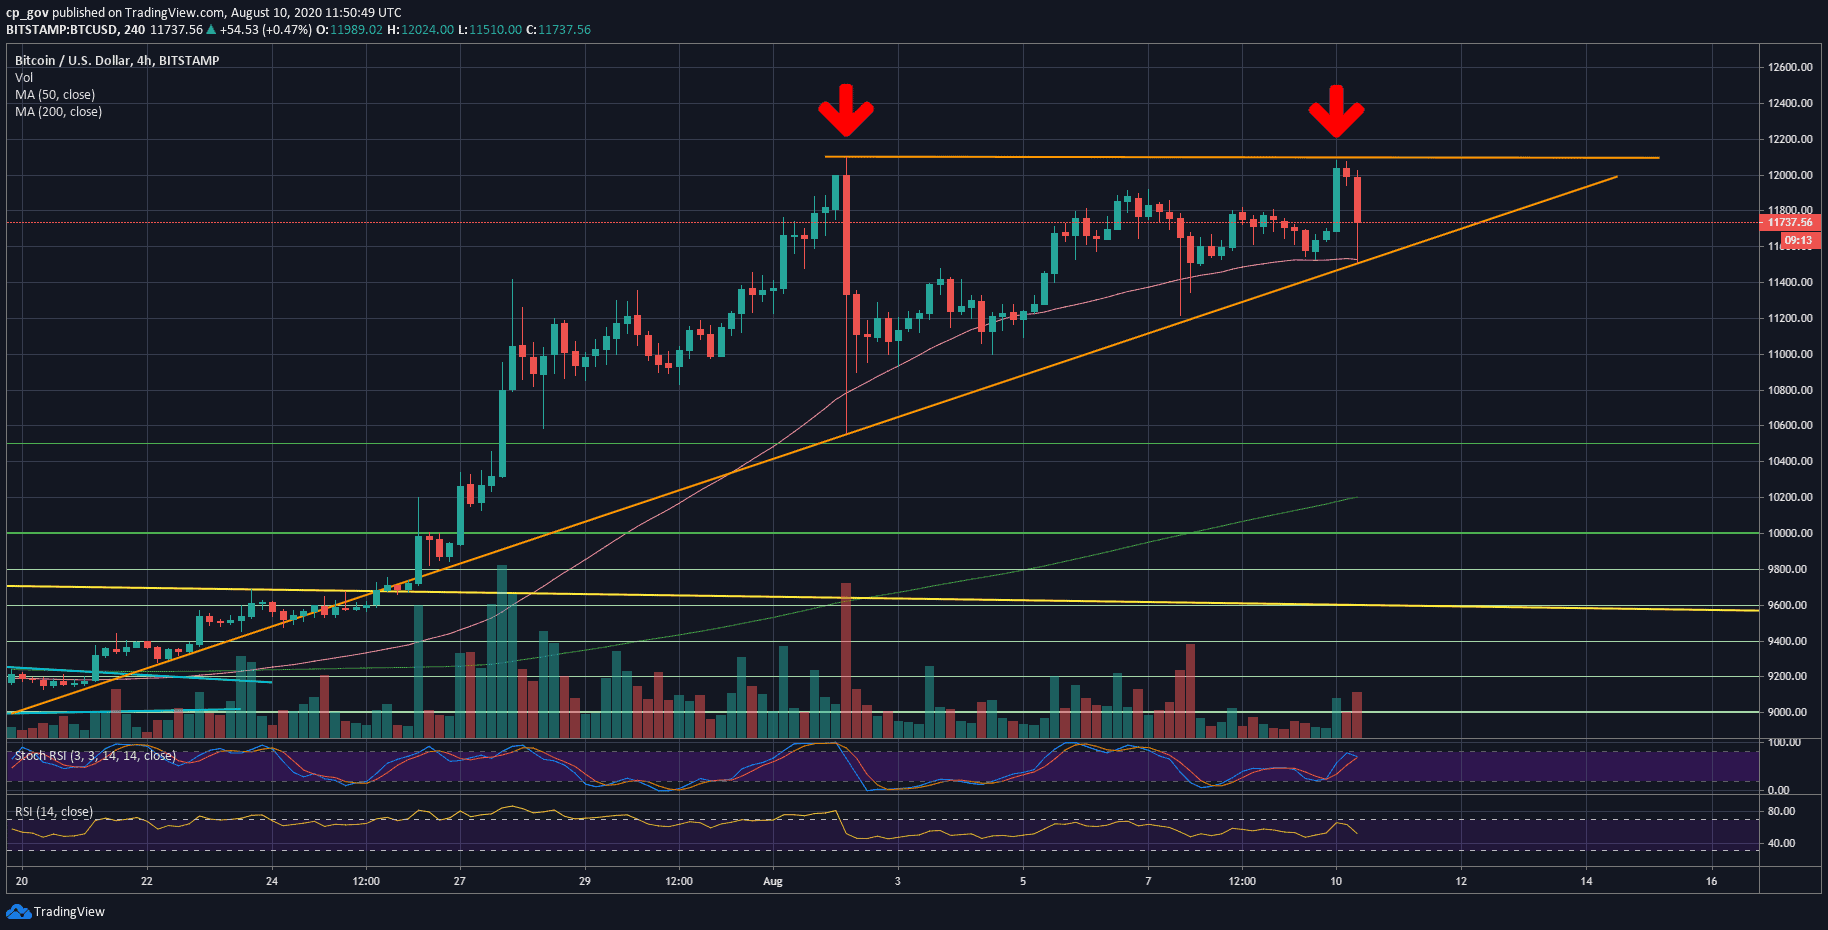
The good news is that the dip to $11,500 quickly got bought by the Bulls, and the ascending trend-line on the 4-hour chart (the orange diagonal line) was kept steady.
The bad news is that unless Bitcoin price would break $12,100, this can possibly result in a Double Top formation, which is textbook bearish and signals on a local top.
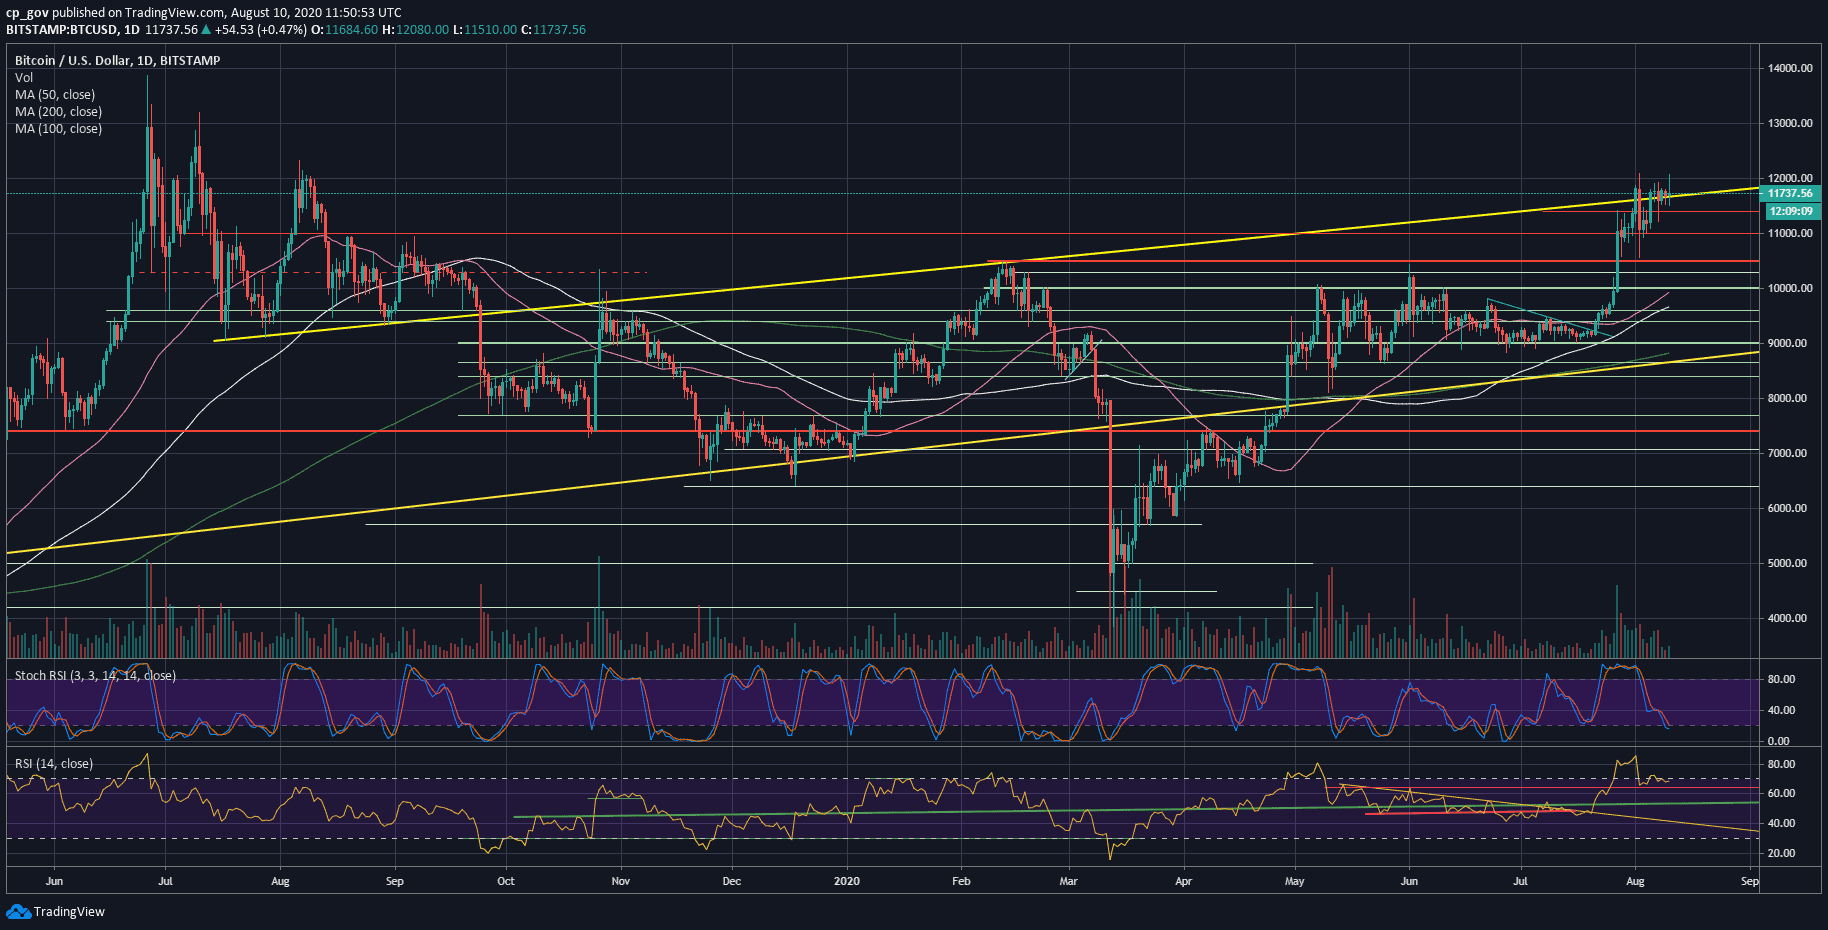
In addition, looking at the longer time-frame, which is the following daily chart, we can see that Bitcoin is having trouble with the yellow ascending line, which started forming during July 2019. Since reaching the line on the first day of August, BTC couldn’t complete a full-body daily candle above the trend-line.
Key Support and Resistance For Bitcoin’s Short-term
The first level of resistance now lies at $11,800, followed by $12,100, which is the 2020 high (the double-top, marked by red arrows on the following 4-hour chart).
In case of a breakout, the next significant resistance lies around $12,300, the high from August 2019 – a year ago. Further above lies $12,500 and $12,900.
From below, the first major support now lies at $11,500 – $11,600, along with the 4-hour ascending trend-line. In case Bitcoin breaks down, then the next support lies at $11,200, $11,000 before the previous 2020 high at $10,500.
Total Market Cap: $359.7 billion
Bitcoin Market Cap: $217 billion
BTC Dominance Index: 60.3%
*Data by CoinGecko
BTC/USD BitStamp 4-Hour Chart
BTC/USD BitStamp 1-Day Chart