Bitcoin took a break from trading during the month of September, with relatively low volatility. As shown on the following 4-hour chart, the marked symmetrical triangle was basically the story of September: Started with a massive dump and a slow consolidation, since then, around ,600. As can be seen below, Thursday signaled a breakout – in favor of the Bulls. Since breaking the triangle at .8K, we saw a healthy consolidation and finally a breakout of the -11.2K area, which was the most recent high. So far, as writing these lines, today’s daily candle marked ,500 as the daily high. This is the first resistance to watch. However, after three consecutive green days, Bitcoin might rest a bit. In case of a correction, the ,000 – ,2000 support would consider a
Topics:
Yuval Gov considers the following as important: Bitcoin (BTC) Price, BTC Analysis, BTCEUR, BTCGBP, btcusd, btcusdt
This could be interesting, too:
Chayanika Deka writes XRP, SOL, and ADA Inclusion in US Crypto Reserve Pushes Traders on Edge
Chayanika Deka writes Why Arthur Hayes Is Bullish on Bitcoin Under Trump’s Economic Strategy
Mandy Williams writes Why the Bitcoin Market Is Stuck—and the Key Metric That Could Change It: CryptoQuant CEO
Wayne Jones writes Metaplanet Acquires 156 BTC, Bringing Total Holdings to 2,391
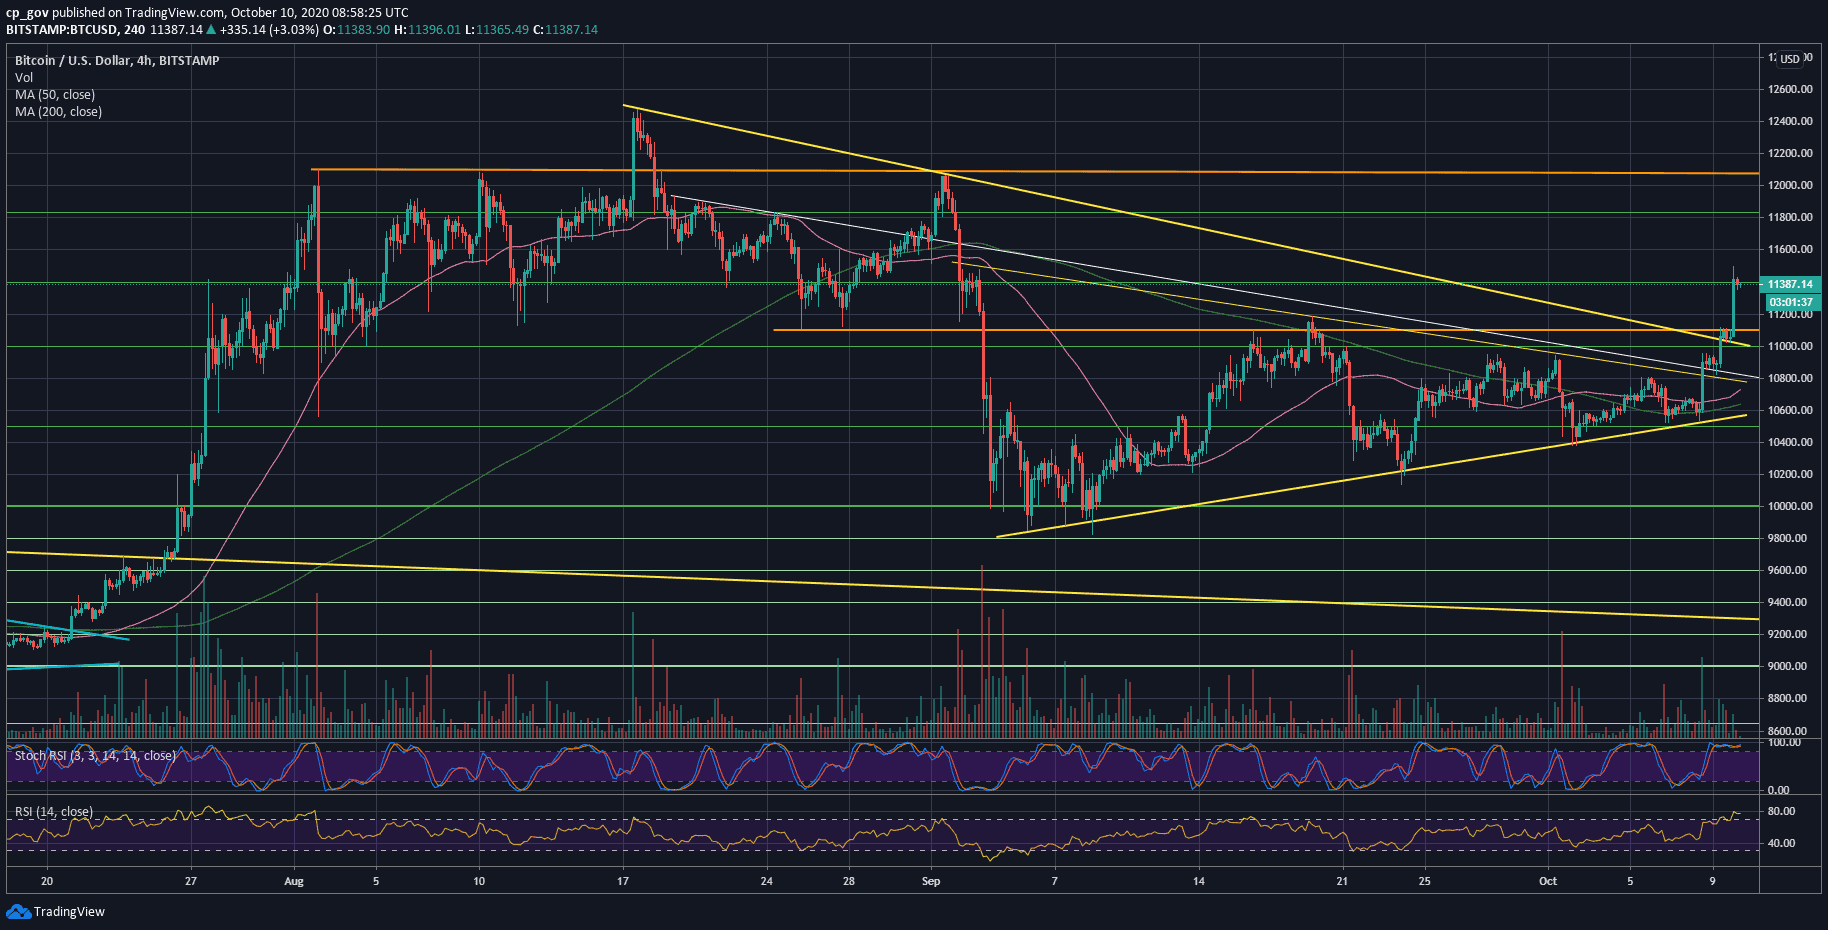
Bitcoin took a break from trading during the month of September, with relatively low volatility. As shown on the following 4-hour chart, the marked symmetrical triangle was basically the story of September: Started with a massive dump and a slow consolidation, since then, around $10,600.
As can be seen below, Thursday signaled a breakout – in favor of the Bulls. Since breaking the triangle at $10.8K, we saw a healthy consolidation and finally a breakout of the $11-11.2K area, which was the most recent high.
So far, as writing these lines, today’s daily candle marked $11,500 as the daily high. This is the first resistance to watch.
However, after three consecutive green days, Bitcoin might rest a bit. In case of a correction, the $11,000 – $11,2000 support would consider a very healthy retest. A daily close below $11K might change things in favor of the bears.
The Fundamentals and The Technicals
As we know, Bitcoin has been recently showing a positive correlation with Gold and the equity markets. The past days, especially Thursday and Friday, yielded 2-3% gains across major U.S. markets indexes. Shortly after Friday’s Wall Street close – it was Bitcoin’s turn to show its capabilities.
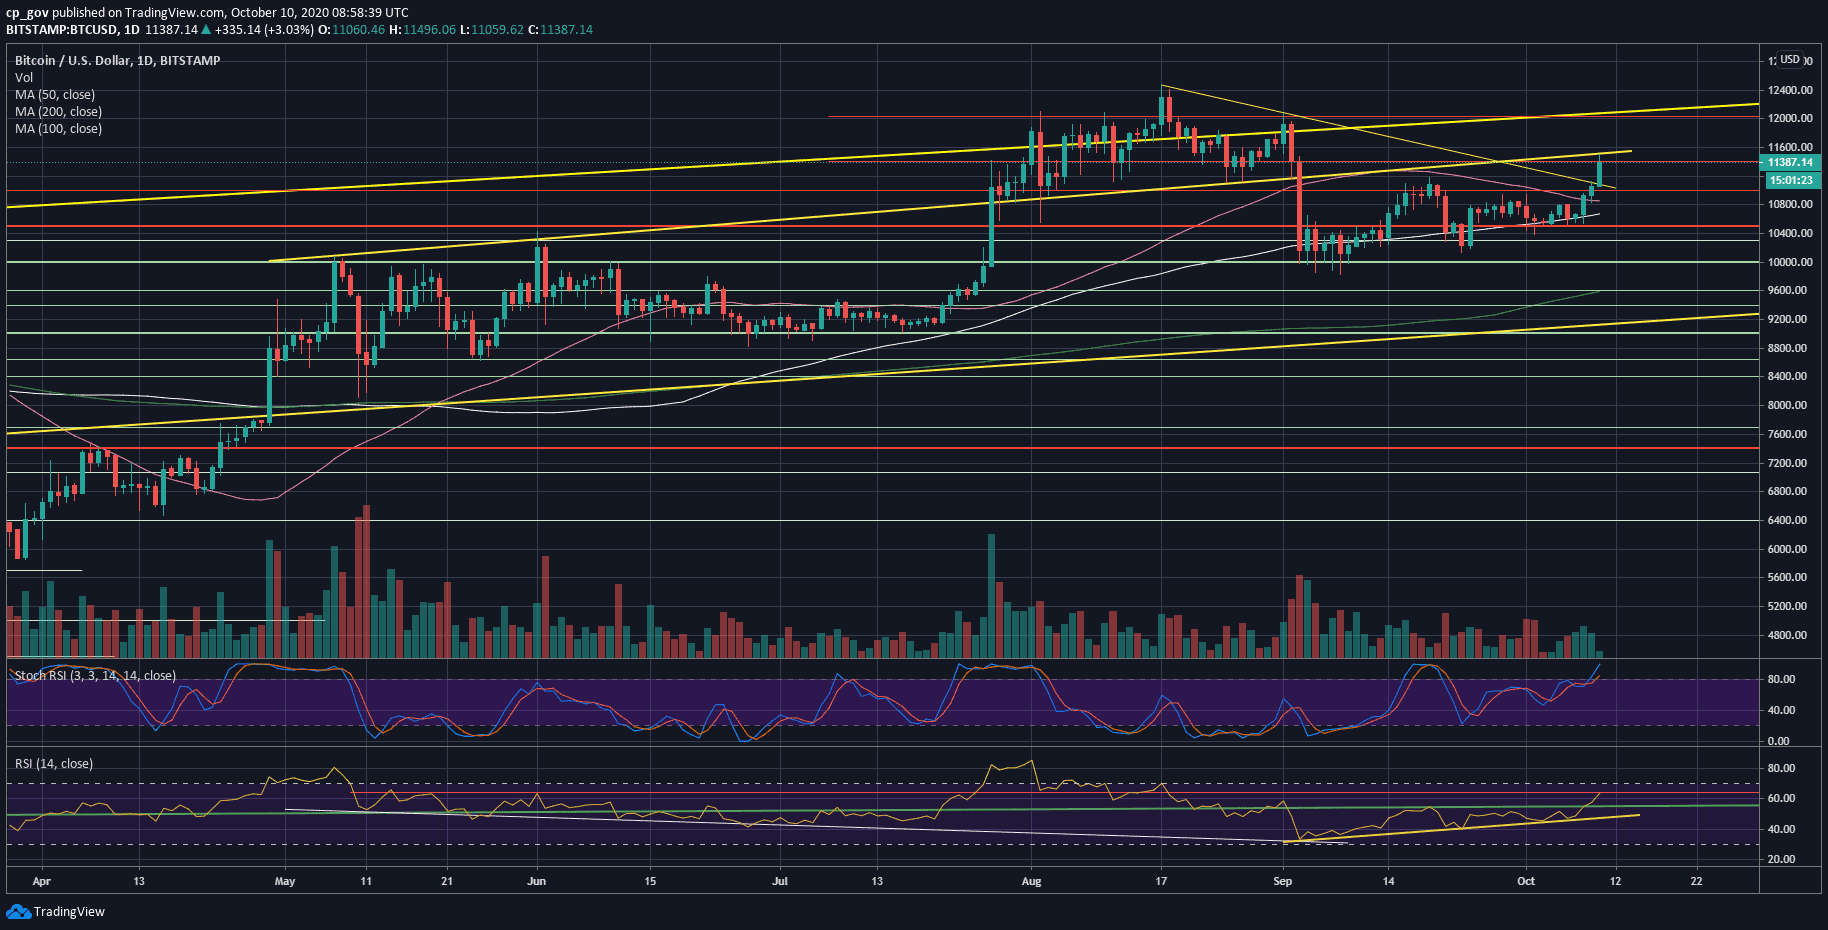
From a technical point of view, the daily RSI is now at 64-65, its highest point since August 17, 2020. Despite the excitement, the trading volume is still not significant.
BTC Levels to Watch in The Short-Term
As mentioned above, Bitcoin is now facing $11,400 – $11,500 as the first area of resistance. If BTC manages to break above, then $11,800 should be a weak resistance before the $12,000 – $12,100 resistance area.
From below, the first level of support now becomes $11,200, followed by $11,000 and $10,800.
Total Market Cap: $366 billion
Bitcoin Market Cap: $210 billion
BTC Dominance Index: 57.5%
*Data by CoinGecko
BTC/USD BitStamp 1-Day Chart
BTC/USD BitStamp 4-Hour Chart