Starting by looking at the bigger picture, Bitcoin price had made a remarkable run since October began, gaining almost 00 to its value. Looking at the following long-term weekly chart, we can see this week’s greenish candle that will be closed later today. From a technical point of view, as long as the candle close price is above the ,500 area (previous high) – we can safely say that BTC is on a healthy uptrend. BTC/USD weekly. Chart by TradingViewThe Good and The Bad: New 2020 High but Bearish Divergence Just a few hours ago, Bitcoin price recorded a new 2020 high close to ,400 (on Binance Futures); however, the primary cryptocurrency could not hold there, and quickly slumped to ,700 in a matter of one hour. Looking at the shorter-term chart, the 4-hour, we
Topics:
Yuval Gov considers the following as important: Bitcoin (BTC) Price, BTC Analysis, BTCEUR, BTCGBP, btcusd, btcusdt
This could be interesting, too:
Chayanika Deka writes XRP, SOL, and ADA Inclusion in US Crypto Reserve Pushes Traders on Edge
Chayanika Deka writes Why Arthur Hayes Is Bullish on Bitcoin Under Trump’s Economic Strategy
Mandy Williams writes Why the Bitcoin Market Is Stuck—and the Key Metric That Could Change It: CryptoQuant CEO
Wayne Jones writes Metaplanet Acquires 156 BTC, Bringing Total Holdings to 2,391
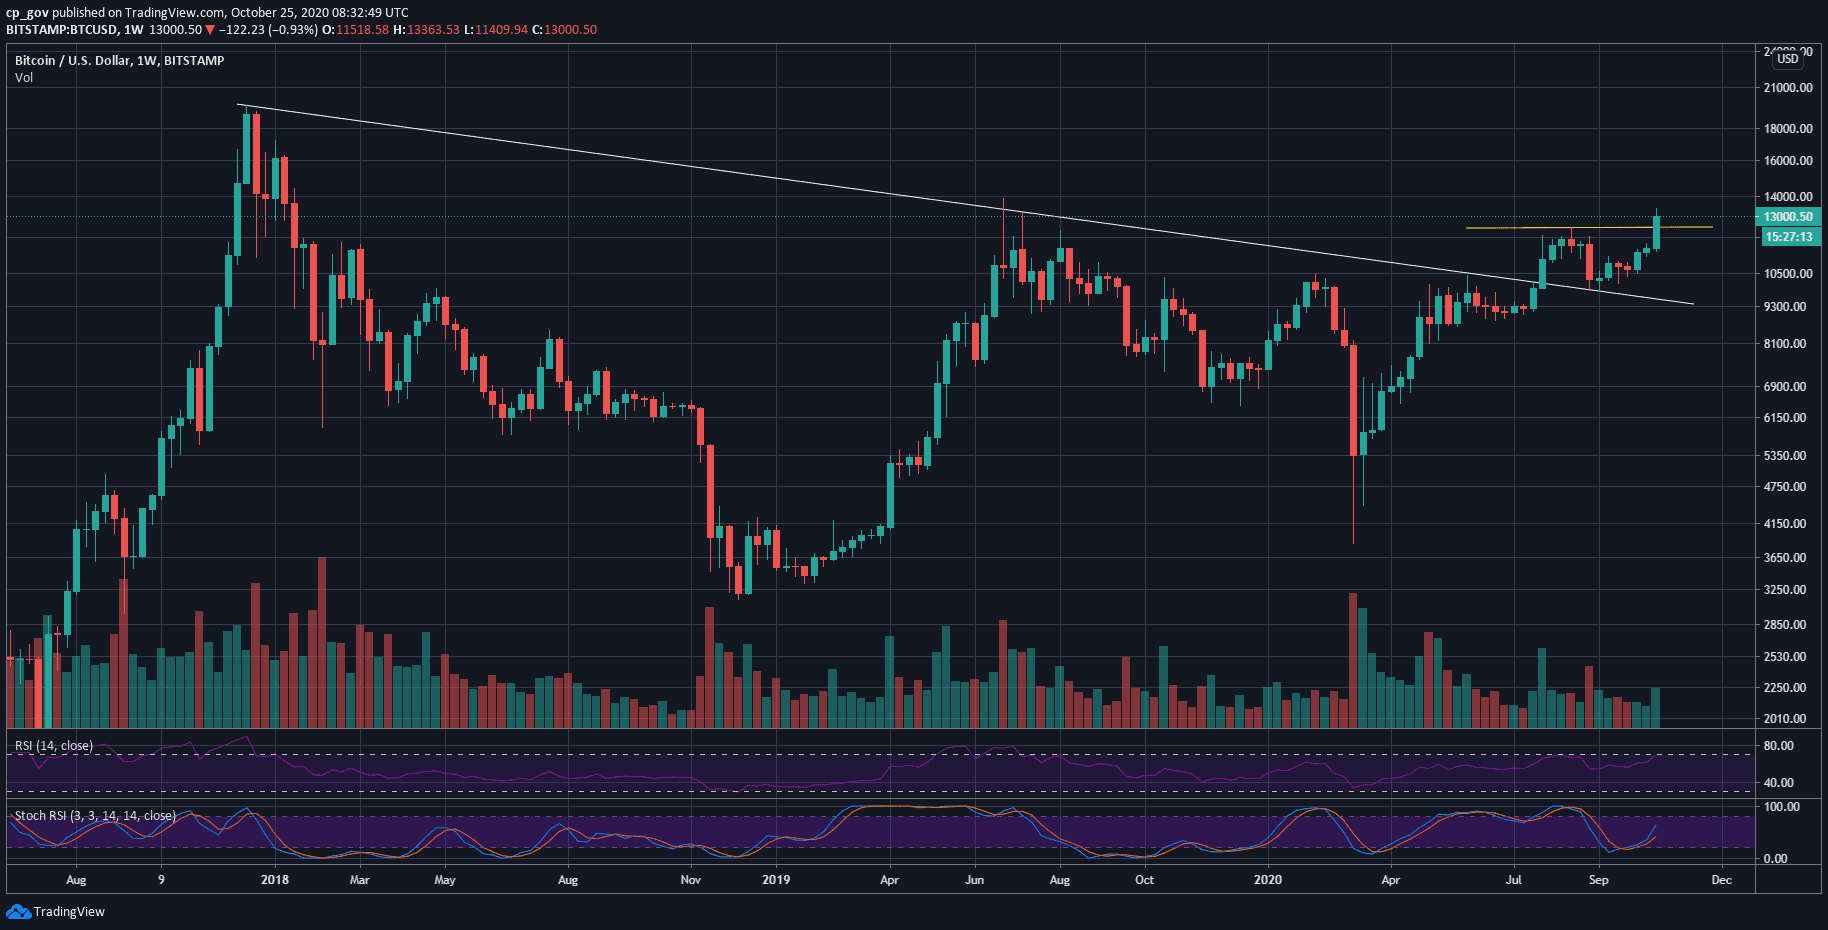
Starting by looking at the bigger picture, Bitcoin price had made a remarkable run since October began, gaining almost $3000 to its value.
Looking at the following long-term weekly chart, we can see this week’s greenish candle that will be closed later today. From a technical point of view, as long as the candle close price is above the $12,500 area (previous high) – we can safely say that BTC is on a healthy uptrend.
The Good and The Bad: New 2020 High but Bearish Divergence
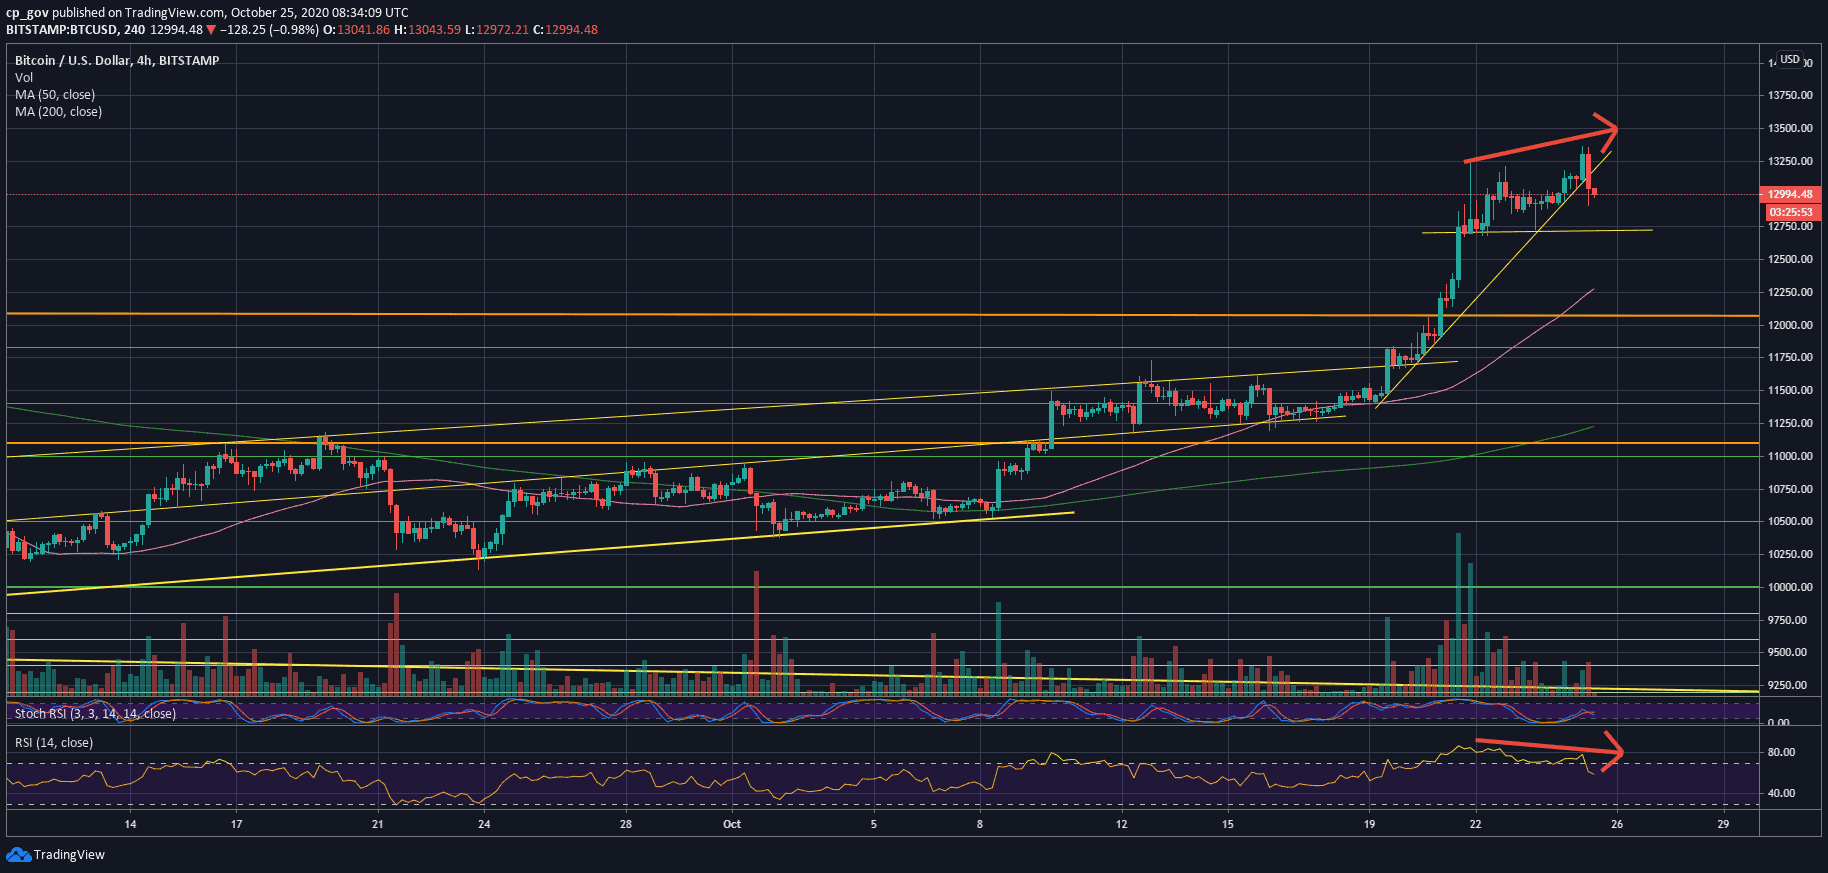
Just a few hours ago, Bitcoin price recorded a new 2020 high close to $13,400 (on Binance Futures); however, the primary cryptocurrency could not hold there, and quickly slumped to $12,700 in a matter of one hour.
Looking at the shorter-term chart, the 4-hour, we can identify a bearish divergence on the RSI. This is a bearish pattern and might indicate that the buying power is fading away.
This happens when the price goes through a higher-high, but the RSI indicator is doing the opposite and going through a lower-high.
Another worrying sign is the trading volume. Since its peak volume on October 20-21, four days ago, the trading volume decreased even though the BTC price had actually gone up.
BTC Support and Resistance Levels To Watch
As mentioned above, if BTC were to correct, then the first major level of support lies at the current levels around $12.9 – $13K. If Bitcoin breaks here, then the first significant level lies at $12,700, followed by the previous 2020 high from August at $12,400 – $12,500.
From the bullish side, if Bitcoin holds the $13,000 – then the first levels of resistance lie at $13,200, followed by today’s high around $13,400. Bitcoin will be looking to break the 2019 high from June – at around $13,880.
Total Market Cap: $400 billion
Bitcoin Market Cap: $240 billion
BTC Dominance Index: 60%
*Data by CoinGecko
BTC/USD BitStamp 4-Hour Chart