Yesterday, bitcoin’s price set another all-time high, this time at ,200 (Bitstamp). Nine days ago, the daily low was ,565. Since hitting that level, the primary cryptocurrency had gone through a fantastic journey of eight consecutive daily green candles.This is the longest period of consecutive daily green candles since June 2019’s bull run (8 candles). If today’s candle will close above ,840, though a green candle, this will become the longest period since October 2013.Back then, Bitcoin had gone through ten green days where the price increased from 1 to 7.This fact can just emphasize how impressive this bull run is. Not many people expected a new all-time high even before 2021.BTC Support and Resistance Levels To WatchWhile bitcoin had entered a price discovery territory,
Topics:
Yuval Gov considers the following as important: Bitcoin (BTC) Price, BTC Analysis, BTCEUR, BTCGBP, btcusd, btcusdt
This could be interesting, too:
Chayanika Deka writes XRP, SOL, and ADA Inclusion in US Crypto Reserve Pushes Traders on Edge
Chayanika Deka writes Why Arthur Hayes Is Bullish on Bitcoin Under Trump’s Economic Strategy
Mandy Williams writes Why the Bitcoin Market Is Stuck—and the Key Metric That Could Change It: CryptoQuant CEO
Wayne Jones writes Metaplanet Acquires 156 BTC, Bringing Total Holdings to 2,391
Yesterday, bitcoin’s price set another all-time high, this time at $24,200 (Bitstamp). Nine days ago, the daily low was $17,565. Since hitting that level, the primary cryptocurrency had gone through a fantastic journey of eight consecutive daily green candles.
This is the longest period of consecutive daily green candles since June 2019’s bull run (8 candles). If today’s candle will close above $23,840, though a green candle, this will become the longest period since October 2013.
Back then, Bitcoin had gone through ten green days where the price increased from $121 to $147.
This fact can just emphasize how impressive this bull run is. Not many people expected a new all-time high even before 2021.
BTC Support and Resistance Levels To Watch
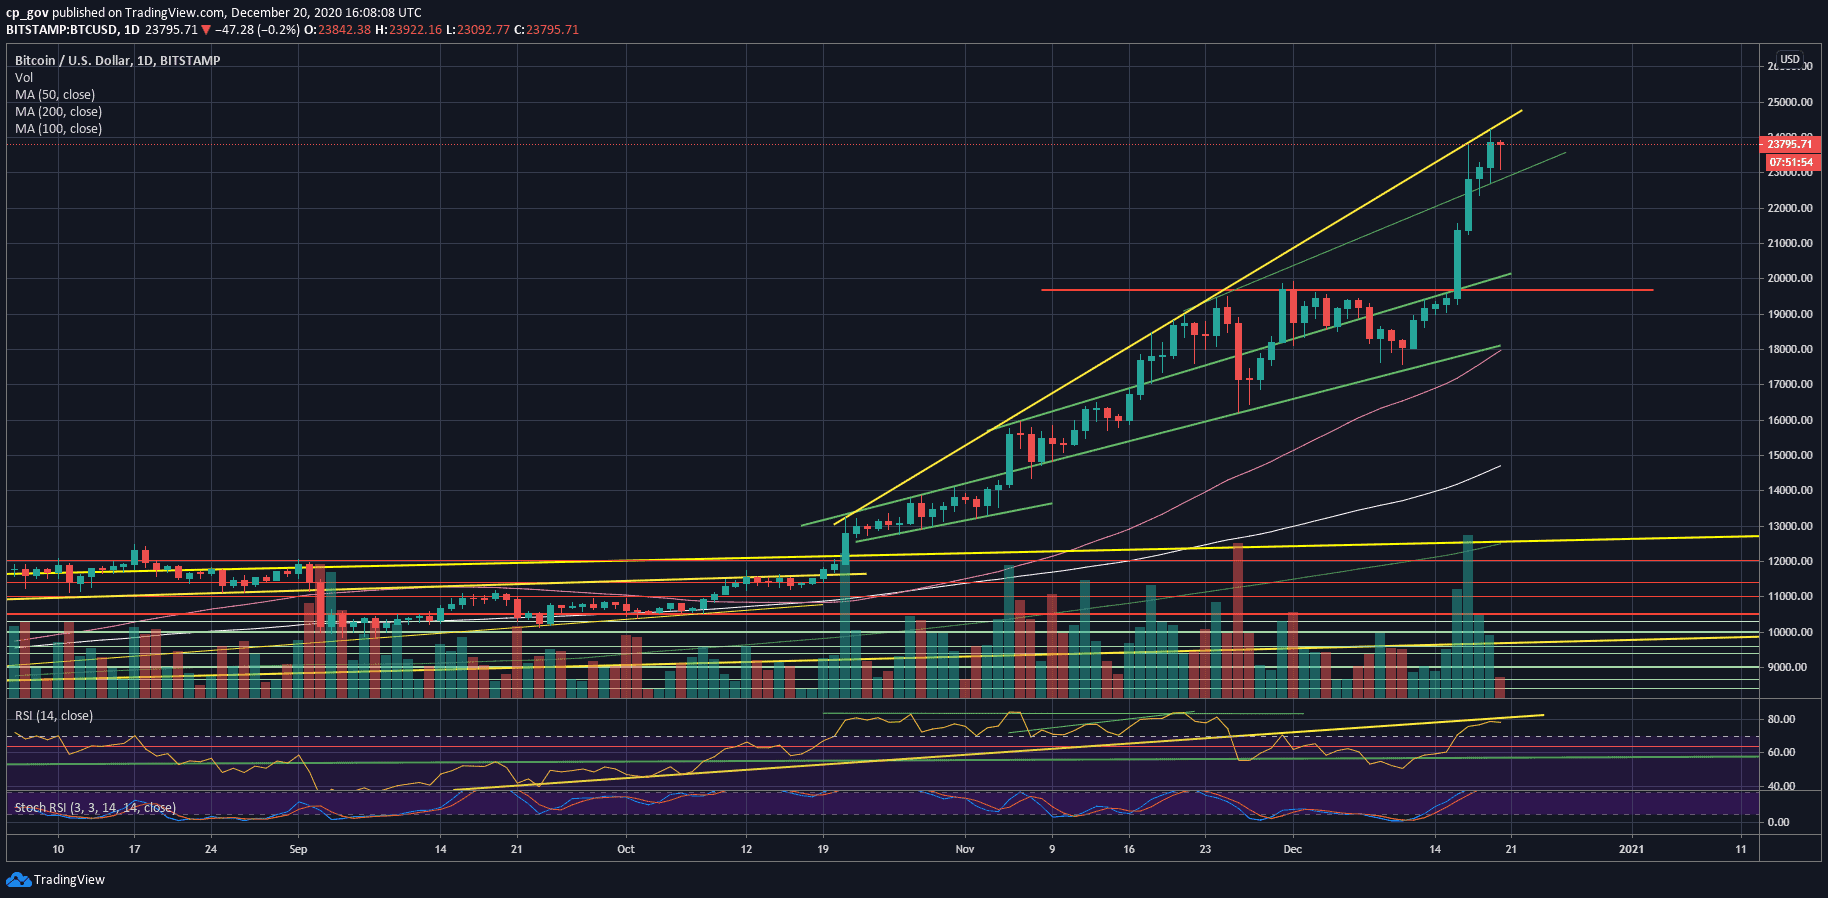
While bitcoin had entered a price discovery territory, where there is no actual resistance to the bullish side, we can rely on the top-yellow ascending line on the following daily chart.
This line was started forming mid-October and now lies around $24,500 – $24,600. Before that, the first resistance level for Bitcoin is the current ATH at $24,200.
Further above lies the psychological levels of $25,000 and $26,000.
As the RSI is getting near 80, there is a high probability of an incoming price correction.
From below, the first level of support now lies around today’s low at $23,000 – $23,200, along with the first green ascending trend-line.
Further below lies 0.236 Fibonacci Level around $22,250, followed by the 0.382 and 0.5 Fibonacci levels – $21,405 and $20,673, respectively.
Further below lies the previous all-time high of December 2017 at around $20,000.
Total Market Cap: $684 billion
Bitcoin Market Cap: $443 billion
BTC Dominance Index: 64.8%
*Data by CoinGecko
BTC/USD BitStamp 1-Day Chart